. 2025 Jul 24:23:e00682.
doi: 10.1016/j.ohx.2025.e00682. eCollection 2025 Sep.

A float-controlled self-contained laser gauge for monitoring river levels in tropical environments

Affiliations

A float-controlled self-contained laser gauge for monitoring river levels in tropical environments

Alain Pierret et al. HardwareX. .

Abstract

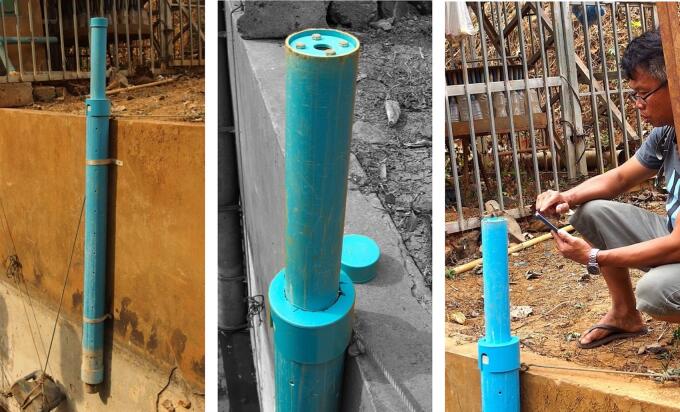
In this paper we present the design, construction and performance of a self-contained float-controlled water level gauge for monitoring water levels in streams and small rivers. This device is inexpensive (cost of about EUR 220), easy to build (no electronics skills or specialized tools required; assembled in a few hours) and straightforward to use. The gauge remains autonomously operational for several weeks in remote locations without the need for an external power supply or solar panel and in the harsh tropical climatic conditions. Data can be downloaded wirelessly in the field using an Android smartphone or tablet. This gauge is capable of a measurement precision of ±1 mm at temperatures ranging from 20 to 30 °C and accurate to within 2 mm of manual readings in a controlled laboratory environment. In the field, the mean absolute error (MAE) of measurements taken with the water level gauge compared to that obtained with the OTT-SE200 - a commercial float-controlled angle encoder water level gauge - over a full tropical rainy season and for a measurement range of 0.5 m, was 2.6 mm (n = 8,017).

Keywords: Ad hoc technology; Data logging; Hydrometry; Micro-controller; Time-of-Flight; Tropical environments.


Conflict of interest statement

The authors declare that they have no known competing financial interests or personal relationships that could have appeared to influence the work reported in this paper.

Figures

None
Graphical abstract
Fig. 1
Fig. 1
Schematic illustrating the principle of the water level measurement using a ToF laser distance meter.
Fig. 2
Fig. 2
Overall view of the float-controlled self-contained water level gauge for the monitoring of stream levels. Far left: view of the complete gauge main housing with access to reset switch at the top. Left: transparent view of the gauge's mechanical and electronic components. Right: field setup for water level monitoring in a weir showing the strainer tube fixed to the wall of the weir and the long float guide tube at the top of which the gauge main housing is inserted. Far right: transparent view of the mechanical and electronic components of the field installation.
Fig. 3
Fig. 3
Overview of the electronics and wiring of the float-controlled self-contained water level gauge.
Fig. 4
Fig. 4
Parts of the self-contained gauge assembly #1 – Distance meter module cap; #2 − self-locking cable for distance meter unit holder; #3 − Locking screw; #4 − Reset push-button insulating cover; #5 − Rubber membrane for reset push button; #6 − Bolts and nuts set for reset switch insulating cover; #7 − Reset push-button insulating cover holder; #8 − Distance meter unit; #9 – Distance meter unit holder; #10 − External enclosure; #11–32 Gb micro-SD card; #12 − self-locking cable for electronics assembly; #13 − CR1220 coin cell battery; #14 − Electronics assembly; #15 − Electronic module holder; #16 − Reset push button; #17 − Reset push-button cap.
Fig. 5
Fig. 5
Drawings with dimensions of the PVC parts used for the construction of the self-contained water level gauge assembly.
Fig. 6
Fig. 6
Drawings with dimensions of the PVC parts used for the construction of electronic module holder.
Fig. 7
Fig. 7
Electronics assembly. a. Overall view of the electronics assembly #14 showing the RTC module to the top left, the MKR MEM card with 32 Gb micro-SD card inserted in the micro-SD drive, 2x 1MΩ resistors and electrical wires soldered and the self-locking cable #12 securing it on top of the MKR WIFI 1010 card; b. Detailed view of soldering GND and VCC pins of RTC module under the MKR MEM card.
Fig. 8
Fig. 8
Installation of the distance meter unit in its holder. a. Parts of the distance meter unit holder, including self-locking cable #12 (left), distance meter unit holder #9 with ø 6 mm bolts and nuts (center), #8, distance meter unit (right); b. Internal view of the distance meter unit holder #9 showing the position of the distance meter fixing bolts; c. Rear view of the distance meter unit holder#9 with the distance meter unit #8 installed; d. Front view of the distance meter unit holder #9 with the distance meter unit #8 installed and the self-locking cable #2 sufficiently tightened so that the holder #9 can be inserted at one end of the external enclosure #10 of the gauge assembly; e. External view of the distance meter unit holder #9 showing the position of the self-locking cable #2 on the side of the cut-out slit; f. Front view of the distance meter unit holder #9 with the distance meter #8 unit installed and the bead of silicon sealant applied around its two optical windows.
Fig. 9
Fig. 9
Electronic module holder construction and wiring. a. overall view of the electronic module holder #15 showing cut-outs and positioning of holes for bolts and electric wires; b. components to be assembled with the electronic module holder #15, including the electronics assembly #14, contact bolts and nuts, lug terminals and electric wires; c. view of the electronic module holder #15 after the electrical wires have been laid; d. view of the electronic module holder after the electrical wires have been laid and with the reset push button #16 connected and installed in reset push-button cap #17 and with electronics assembly #14 connected to the distance meter #8 installed in the distance meter unit holder #9.
Fig. 10
Fig. 10
View showing the installation of the batteries in the electronic module holder #15 and the detail of electrical contacting using bolts and nuts.
Fig. 11
Fig. 11
Assembling of the reset push-button. a. Components of the reset push-button including the push-button cap #17 (top), the push-button #16 (bottom left), its O-ring (bottom centre) and tightening nut (bottom right); b. External view of the reset push-button; c. Internal view of the reset push-button; d. Detail of reset push-button #16 wiring and insertion into its cap #17.
Fig. 12
Fig. 12
Assembling of the reset push button cap with insulating cover; a. Components of the reset push button cap and cover including the reset push-button insulating cover #4 (top left), the rubber membrane for reset push button #5 (top center), the reset push-button insulating cover holder #7 (top right) and the ø 6 mm bolts and nuts #6; b. Positioning of the rubber membrane and bolts on the insulating cover #4; c. External view of the push button cap after assembly showing the rubber membrane sandwiched between the insulating cover #4 and the insulating cover holder #7; d. Internal view of the push button cap after assembly showing the position of the tightening nuts.
Fig. 13
Fig. 13
Final assembly of the gauge unit. a. Close-up showing the end of the electronic module holder #15 (left), the distance meter connector with the metal collar screwed tight (center) and the distance meter unit holder #9 (right); b. External view of the distance meter module cap #1 showing the holes to be aligned with the distance meter emitter and sensor windows when attaching #1 to the external enclosure #10; c. Insertion of the electronic module holder #15 into the external enclosure #10, ensuring slot in the distance meter unit holder #9 is aligned with the hole drilled on external enclosure #10 to receive the locking screw #3; d. Insertion of the distance meter module cap #1 onto the external enclosure #10; e. Final locking of the distance meter unit using the locking screw #3; f. Overall view of the complete gauge unit with distance meter module cap #1 to the left and reset push-button insulating cover to the right.
Fig. 14
Fig. 14
Transparent view of the fully assembled gauge, with indication of the reference numbers for mechanical and electronic components (see Fig. 4 for parts list).
Fig. 15
Fig. 15
Left: Drawings with dimensions of the PVC parts used for the field setup for water level monitoring in a weir. #18 − Float lower end cap; #19 − Float body; #20 − Float upper end cap; #21 − Removable end cap for #22; #22 − Float guide tube; #23 − End cap for #25; #24 − End cap for #25; #25 − External strainer tube. Right: Transparent view of the fully assembled water monitoring device as installed in a weir, with indication of the reference numbers for mechanical components.
Fig. 16
Fig. 16
PVC parts for water level monitoring in a weir; a. Overall view of external strainer tube #25 with end caps #23 and 24 inserted; b. Detail of external strainer tube #25 showing holes regularly drilled to allow for free water circulation; c. Overall view from the top side of the float guide tube #22 inserted in the external strainer tube.
Fig. 17
Fig. 17
Preparing the float; a. Weigh the estimated necessary mass of sand; b. Pour sand into the container formed by the PVC tube #19 and sealed end cap #18 until the desired floating line is reached; c. Seal top end cap #20 to finalize the float.
Fig. 18
Fig. 18
Checking alignment of the distance meter laser beam. a. Insert the gauge unit at the top end of float guide tube #22; b. Draw a circle of the same diameter as that of tube #22 on a sheet of cardboard; c. Gently move the cardboard sheet away from the end of the tube to check that the beam is as close as possible to the centre of the circle.
Fig. 19
Fig. 19
Field deployment of the water level gauge for water level monitoring in a weir; a. Overall view of the complete device installed on the wall of a weir using wall mounting brackets; b. Top view of the gauge unit inserted at the upper end of the float guide tube #22 which is itself inserted into the strainer tube #25, the removable end cap (#21) for #22 is taken out and placed on the edge of the wall allowing access to the push-button cover assembly; c. Data downloading in the field using the Bluetooth Low Energy connectivity with Android app ‘Serial Bluetooth Terminal’.
Fig. 20
Fig. 20
Flowchart of the water level gauge program.
Fig. 21
Fig. 21
Screenshots of the’Serial Bluetooth Terminal’ application used for BLE communication with the of self-contained water level gauge; a. Main window; b, c. Device selection; d. Connection to device; e. Main menu of the water level gauge; f. Example of reading of data stored on the device’s micro-SD card; g,h,i. steps to follow to save data buffer.
Fig. 22
Fig. 22
Screenshots showing the configuration of the’Serial Bluetooth Terminal’ application used for BLE communication with the self-contained water level gauge using an Android smartphone; a. Selecting ‘Settings’; b,c. Under the ‘Terminal’ tab, deselecting ‘Show timestamps’ and selecting ‘Buffer size: Unlimited’; d,e. Under the ‘Misc.’ tab, deselecting ‘Keep screen on when connected’ and selecting ‘Show notification when connected’, choosing ‘Save + log folder’ to set the local file path where the data buffer is to be saved; f, g, h. Access saved files by clicking on the top right three vertical dots of the top ribbon, then ‘Configuration > Export’.
Fig. 23
Fig. 23
Picture showing the enclosure containing the four tested units while being submitted to 0–5 °C temperatures in a fridge.
Fig. 24
Fig. 24
Distance measurements obtained with one JRT-M703A distance meter at 6 s time intervals over a period of approx. 7 h and for a temperature ranging of 0 to 45 °C.
Fig. 25
Fig. 25
Picture of the experimental setup used to compare the water levels measured using the self-contained water level gauge with that measured manually using a ruler and with values from the OTT-SE200 water level meter.
Fig. 26
Fig. 26
Comparison between the water level measured using the self-contained water level gauge and manual measurements (left panel) or OTT-SE200 water level meter (right panel) through an experimental filling-emptying cycle of an amplitude of 600 mm with rising and receding rates of ∼10 mm. min−1.
Fig. 27
Fig. 27
Field deployment of the self-contained water level gauge at the M−TROPICS critical zone observatory during the 2024 monsoon.
Fig. 28
Fig. 28
Field comparison of the performance of the self-contained water level gauge with that of the OTT-SE200 water level instrument during the 2024 rainy season in the M−TROPICS experimental catchment, northern Laos. Left panel results for upstream gauging station (19°51′37.3″N 102°10′21.6″E, elevation 538 m); right panel: results from downstream gauging station (19°51′29.6″N 102°10′12.5″E, elevation 521 m).

Similar articles

References

    1. Nord G., Safdar S., Hasanyar M., Eze K.O., Biron R., Freche G., Denis H., Legout C., Hauet A., Esteves M. Streamflow monitoring at high temporal resolution based on non-contact instruments in a river prone to bathymetric shifts. ESS Open Archive. 2024 doi: 10.22541/essoar.171289312.20509603/v1. - DOI
    1. Ribolzi O., Karambiri H., Bariac T., Benedetti M., Caquineaux S., Descloitres M., Aventurier A. Mechanisms affecting stormflow generation and solute behaviour in a Sahelian headwater catchment. J. Hydrol. 2007;337:104–116. doi: 10.1016/j.jhydrol.2007.01.019. - DOI
    1. Boithias L., Ribolzi O., Lacombe G., Thammahacksa C., Silvera N., Latsachack K., Soulileuth B., Viguier M., Auda Y., Robert E., Evrard O., Huon S., Pommier T., Zouiten C., Sengtaheuanghoung O., Rochelle-Newall E. Quantifying the effect of overland flow on Escherichia coli pulses during floods: use of a tracer-based approach in an erosion-prone tropical catchment. J. Hydrol. 2021;594 doi: 10.1016/j.jhydrol.2020.125935. - DOI
    1. Ligaray M., Kim M., Baek S., Ra J.-S., Chun J., Park Y., Boithias L., Ribolzi O., Chon K., Cho K. Modeling the fate and transport of malathion in the Pagsanjan-Lumban Basin Philippines. Water. 2017;9:451. doi: 10.3390/w9070451. - DOI
    1. Chen Y., Teo F.Y., Wong S.Y., Chan A., Weng C., Falconer R.A. Monsoonal extreme rainfall in Southeast Asia: a review. Water. 2025;17(1):5. doi: 10.3390/w17010005. - DOI

LinkOut - more resources