. 2025 Jul 21:16:1590670.
doi: 10.3389/fimmu.2025.1590670. eCollection 2025.

Exploring the predictive "psycho-biomarkers" for checkpoint immunotherapy in cancer

Affiliations

Exploring the predictive "psycho-biomarkers" for checkpoint immunotherapy in cancer

Qian Zuo et al. Front Immunol. .

Abstract

Background: In recent decades, cancer immunotherapy has transformed the treatment landscape, offering significant advantages over traditional therapies by improving progression-free survival (PFS) and overall survival (OS). However, immune checkpoint inhibitors (ICIs) treatment has been associated with an increased risk of mortality in its early stages. Therefore, identifying reliable biomarkers to predict which patients will benefit clinically from ICIs therapy is critical. Depression, a common form of chronic psychological stress, has emerged as a regulator of tumor immunity and is gaining attention as a target for novel cancer treatments. To date, no studies have explored the potential of depression-related genes in predicting response to ICIs therapy.

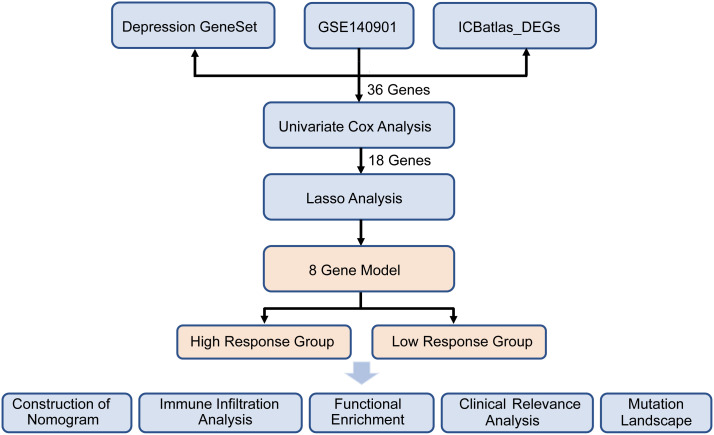
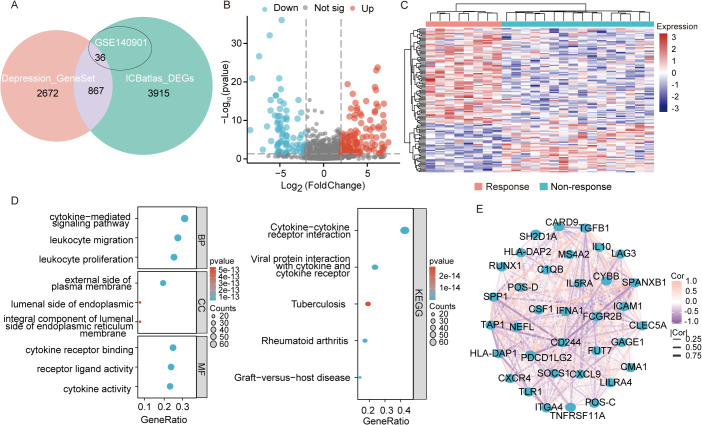
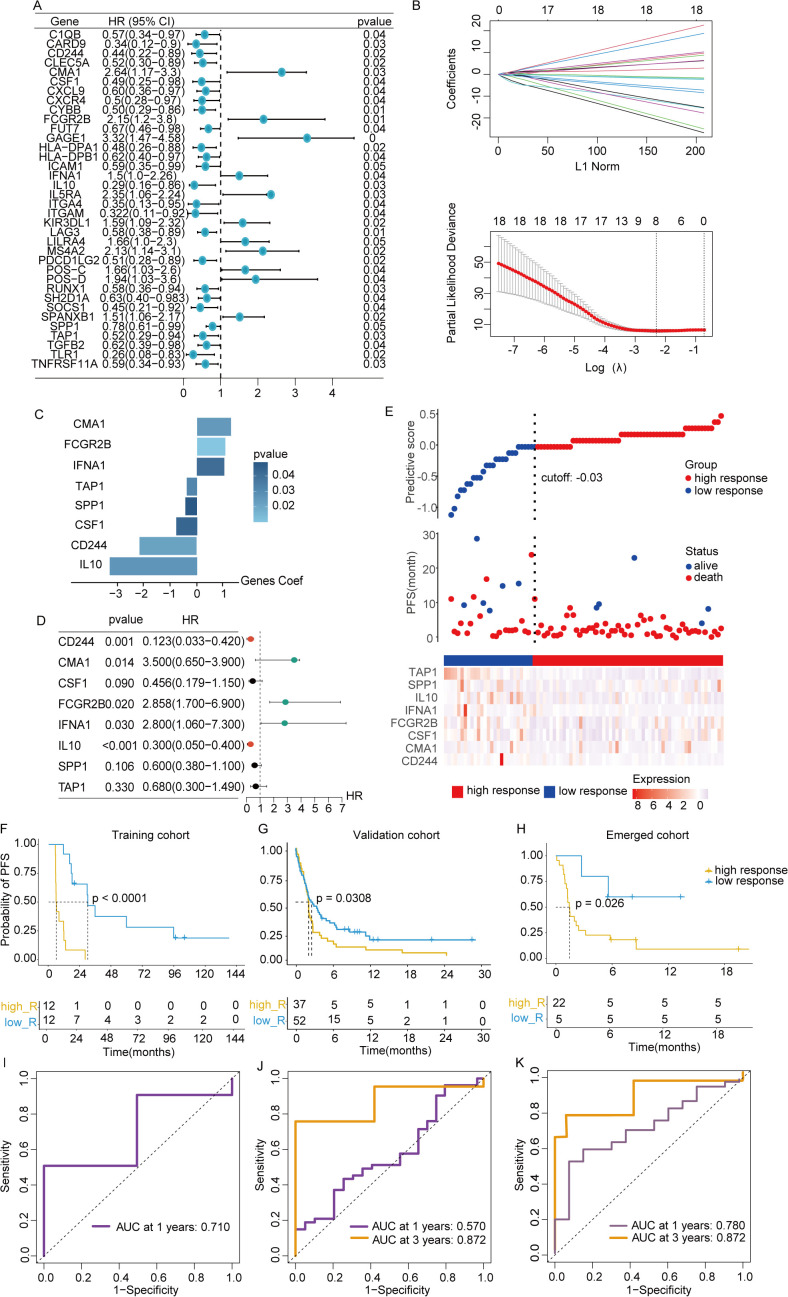
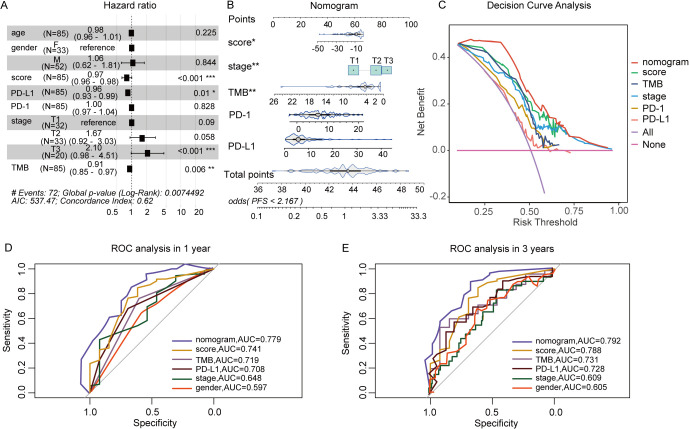
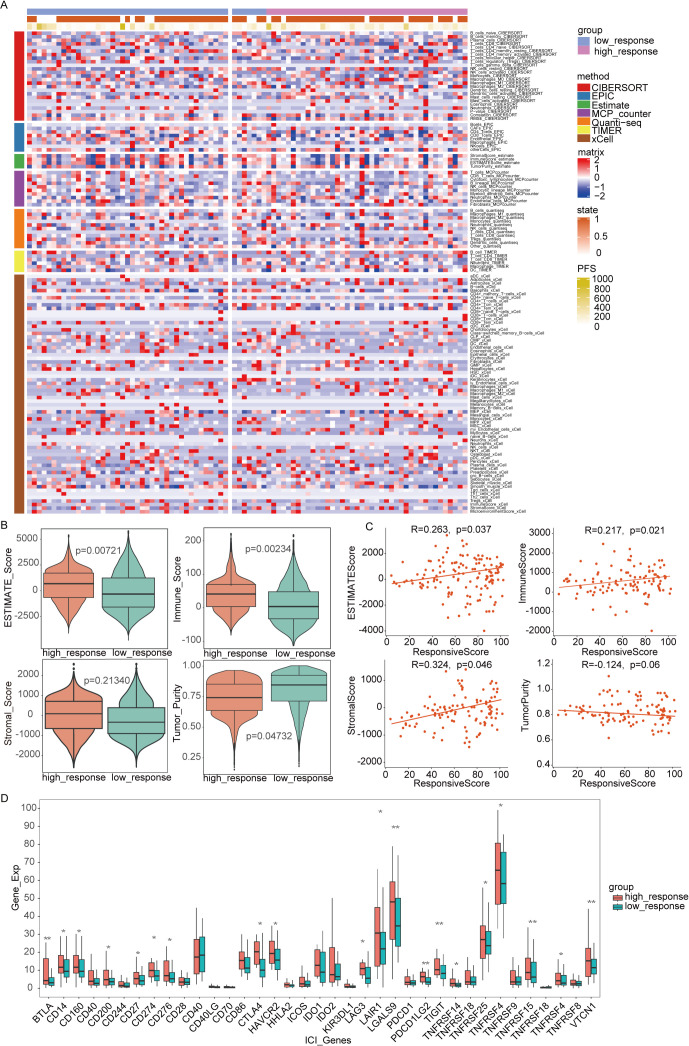
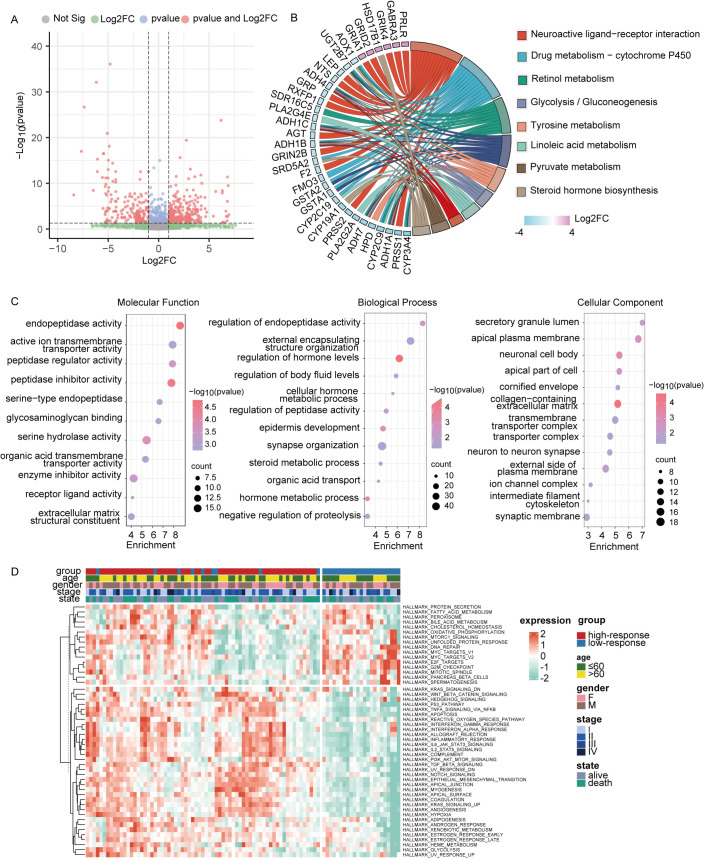
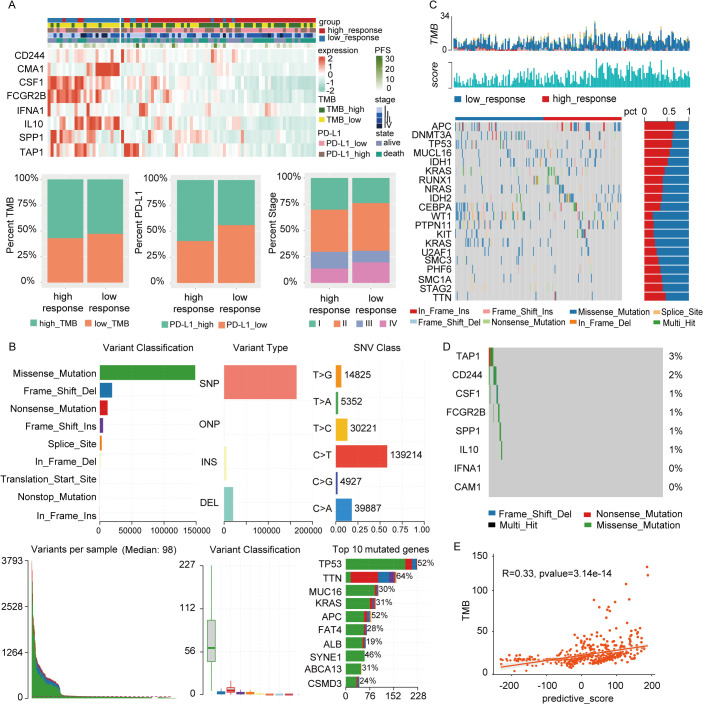
Methods: Public datasets of ICIs-treated patients were obtained from the TCGA and GEO databases, followed by comprehensive analyses, including bulk mRNA sequencing (mRNA-seq), co-expression network construction, and Gene Ontology enrichment. Regression analysis, using Cox proportional hazards and least absolute shrinkage and selection operator (Lasso), identified eight depression-related genes to build a predictive model for clinical outcomes in ICIs therapy. Additionally, correlations were explored between the depression-related predictive score and clinical parameters, including tumor mutational burden (TMB) and immune cell infiltration, establishing the score as a potential predictor of ICIs response.

Results: The model categorized patients into high- and low-responsiveness groups, with significant differences in disease-free survival (DFS) between them. Validation using both internal and external datasets demonstrated the model's strong predictive accuracy. Further analysis revealed that this response stratification correlates with immune cell abundance and TMB in cancer patients.

Conclusion: This study suggests that depression-related genetic traits could serve as biomarkers for ICIs therapy response, tumor mutations, and immune system alterations. Our findings offer insights into personalized therapeutic strategies for early intervention and prognosis in specific cancer types.

Keywords: breast cancer; immunotherapy efficacy; predictive model; psycho-biomarkers; psychological stress.


Conflict of interest statement

The authors declare that the research was conducted in the absence of any commercial or financial relationships that could be construed as a potential conflict of interest.

Figures

Figure 1
Figure 1
The flowchart of this study.
Figure 2
Figure 2
Transcriptomic analysis of DEGs in GSE140901. (A) The intersection of genes obtained in depression geneset, ICBatlas-DEGs, and GSE140901 database. (B) Differentially expressed genes (DEGs) volcano plot of the 122 DEGs in GSE140901, red represents significantly upregulated genes, blue represents significantly downregulated genes, grey represents genes with non-significant differences, the horizontal axis is log2Fold Change and the vertical axis is -log10q-value. (C) Heat map displaying the 122 DEGs created with the pheatmap R package (https://cran.r-project.org/bin/windows/base/old/4.1.3/). (D) GO and KEGG analysis of the 122 DEGs in GSE140901. (E) PPI network map of the 36 genes from the intersection of depression geneset, ICBatlas DEGs, and GSE140901 database.
Figure 3
Figure 3
Construction of predictive signature. (A) Unitivariate Cox analysis was performed on the 36 intersected genes from the intersection of depression geneset, ICBatlas-DEGs, and GSE140901 database. (B) LASSO regression analysis based on the 36 intersected genes to develop the predictive model. (C) The 8 genes that ultimately built the signature. (D) Hazard ratios of the 8 model genes sourced from LASSO. (E) Variations in disease-free survival status and the expression levels of the 8 genes between groups with high and low responsive rates. (F–H) Values of AUC for the TCGA train, test, and full cohort. (I–K) Analysis of survival within the TCGA train, test, and full cohort. *P<0.05, **P< 0.01, ***P<0.001, ns indicates No significance.
Figure 4
Figure 4
The Construction of nomogram based on predictive score and clinical factors. (A) Multivariate Cox analysis of responsive score and clinical factors. (B) Nomogram to predict the ICIs outcomes of patients with cancer. (C) Decision curve for the nomogram. (D, E) Nomogram’s 1- and 3-year disease-free survival time ROC curve, respectively. *P<0.05, **P<0.01, ***P<0.001.
Figure 5
Figure 5
Immune infiltration analysis between two subtypes. (A) The full cohort’s distribution and correlation of the 22 tumor-infiltrating immune cells (TICs). (B, C) Analysis of the correlation between immune score and responsive score, ESTIMATE score and responsive score, stromal score and responsive score, tumor purity and responsive score. (D) Variations in the abundance levels related to immune-checkpoint-related genes between groups with high and low responses. *P<0.05, **P< 0.01, ***P<0.001.
Figure 6
Figure 6
Analysis of functional enrichment across two subtypes. (A) Genes that were expressed differently between two subtypes in the entire cohort were displayed on the volcano map. (B) Differentially expressed genes were selected for KEGG analysis (|FC|>2, p < 0.05). (C) GO analysis of differentially expressed genes (|FC|>2, p < 0.05). (D) Differences in GSVA scores between two subtypes were displayed by heat map. *P<0.05, **P< 0.01, ***P<0.001.
Figure 7
Figure 7
Clinical relevance and gene mutation analysis between two subtypes. (A) There were significant differences in PD-L1 expression, TMB status, N stage, and progression-free survival between groups with high and low responses. (B) Mutation landscape in full cohort, including variant classification, variant type, SNV class, variants per sample, variant classification summary, and top 10 mutated genes. (C) The representative gene mutations of the two subtypes. (D) The mutations of 8 model genes. (E) The correlation between TMB and responsive score.

Similar articles

References

    1. Ferlay J, Colombet M, Soerjomataram I, Parkin DM, Pineros M, Znaor A, et al. Cancer statistics for the year 2020: an overview. Int J Cancer. (2021). doi: 10.1002/ijc.33588, PMID: - DOI - PubMed
    1. Pauken KE, Dougan M, Rose NR, Lichtman AH, Sharpe AH. Adverse events following cancer immunotherapy: obstacles and opportunities. Trends Immunol. (2019) 40:511–23. doi: 10.1016/j.it.2019.04.002, PMID: - DOI - PMC - PubMed
    1. Pardoll DM. The blockade of immune checkpoints in cancer immunotherapy. Nat Rev Cancer. (2012) 12:252–64. doi: 10.1038/nrc3239, PMID: - DOI - PMC - PubMed
    1. de Miguel M, Calvo E. Clinical challenges of immune checkpoint inhibitors. Cancer Cell. (2020) 38:326–33. doi: 10.1016/j.ccell.2020.07.004, PMID: - DOI - PubMed
    1. Chen Y, Pei Y, Luo J, Huang Z, Yu J, Meng X. Looking for the optimal pd-1/pd-L1 inhibitor in cancer treatment: A comparison in basic structure, function, and clinical practice. Front Immunol. (2020) 11:1088. doi: 10.3389/fimmu.2020.01088, PMID: - DOI - PMC - PubMed

Substances

LinkOut - more resources