. 2025 Jul 16;6(7):102660.
doi: 10.1016/j.xcrp.2025.102660. Epub 2025 Jun 16.

Excitation and polarization of isolated neurons by high-frequency sine waves for temporal interference stimulation

Affiliations

Excitation and polarization of isolated neurons by high-frequency sine waves for temporal interference stimulation

Iurii Semenov et al. Cell Rep Phys Sci. .

Abstract

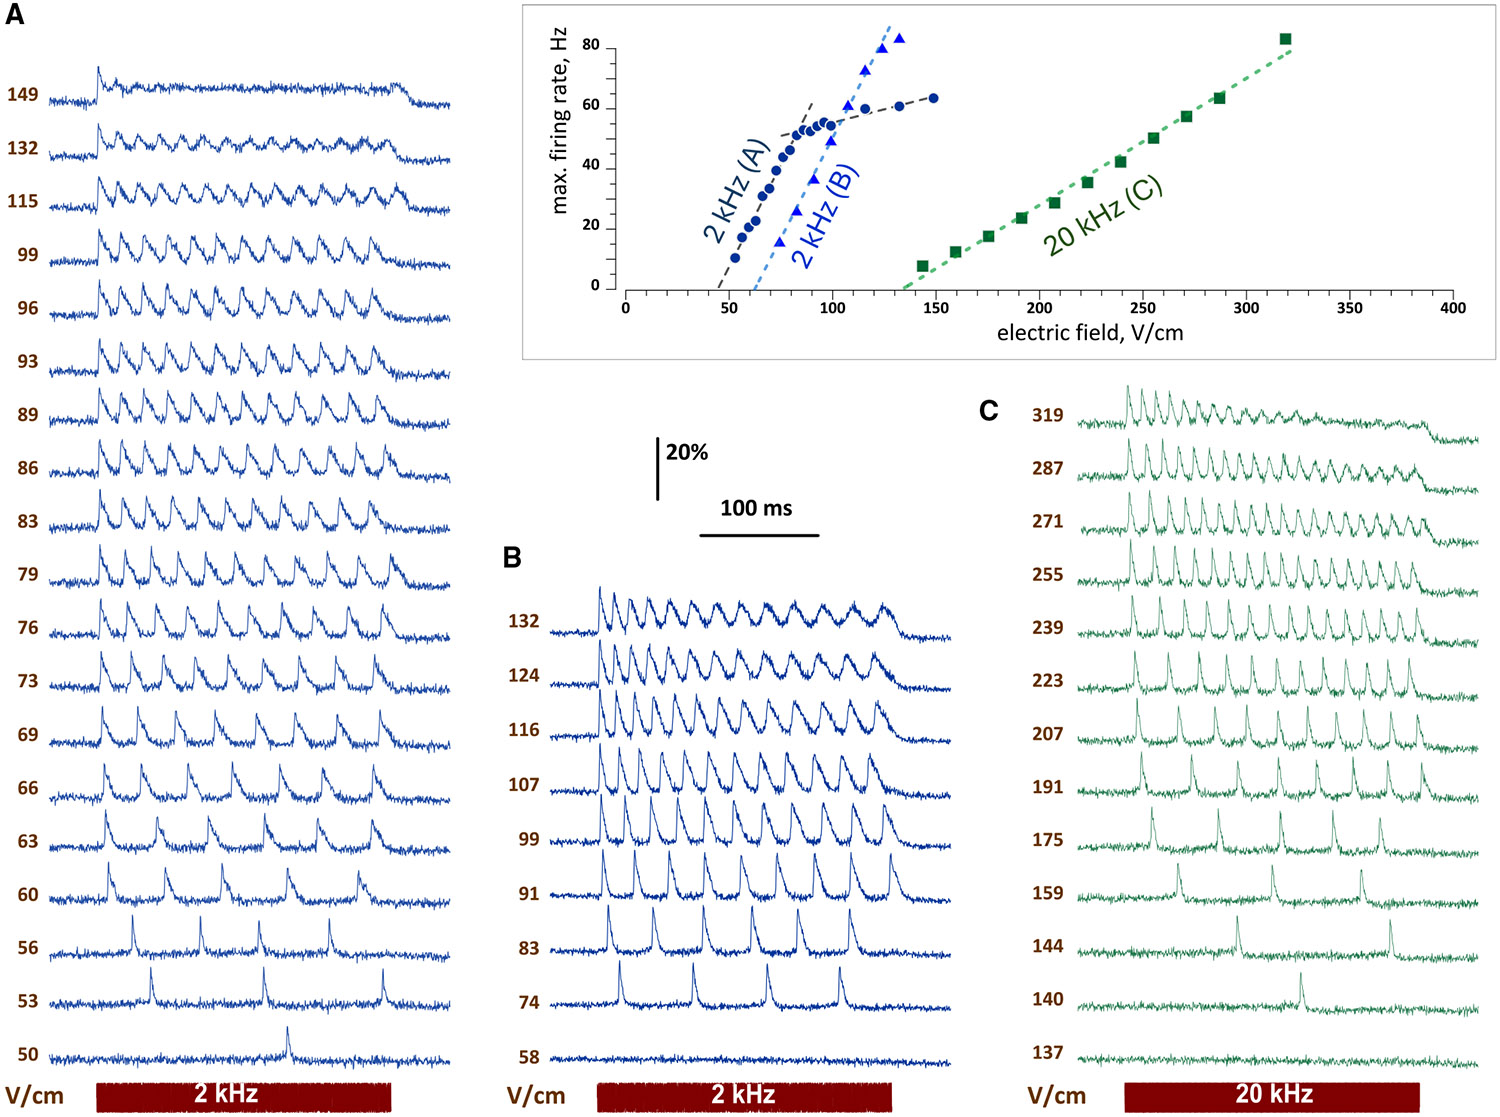
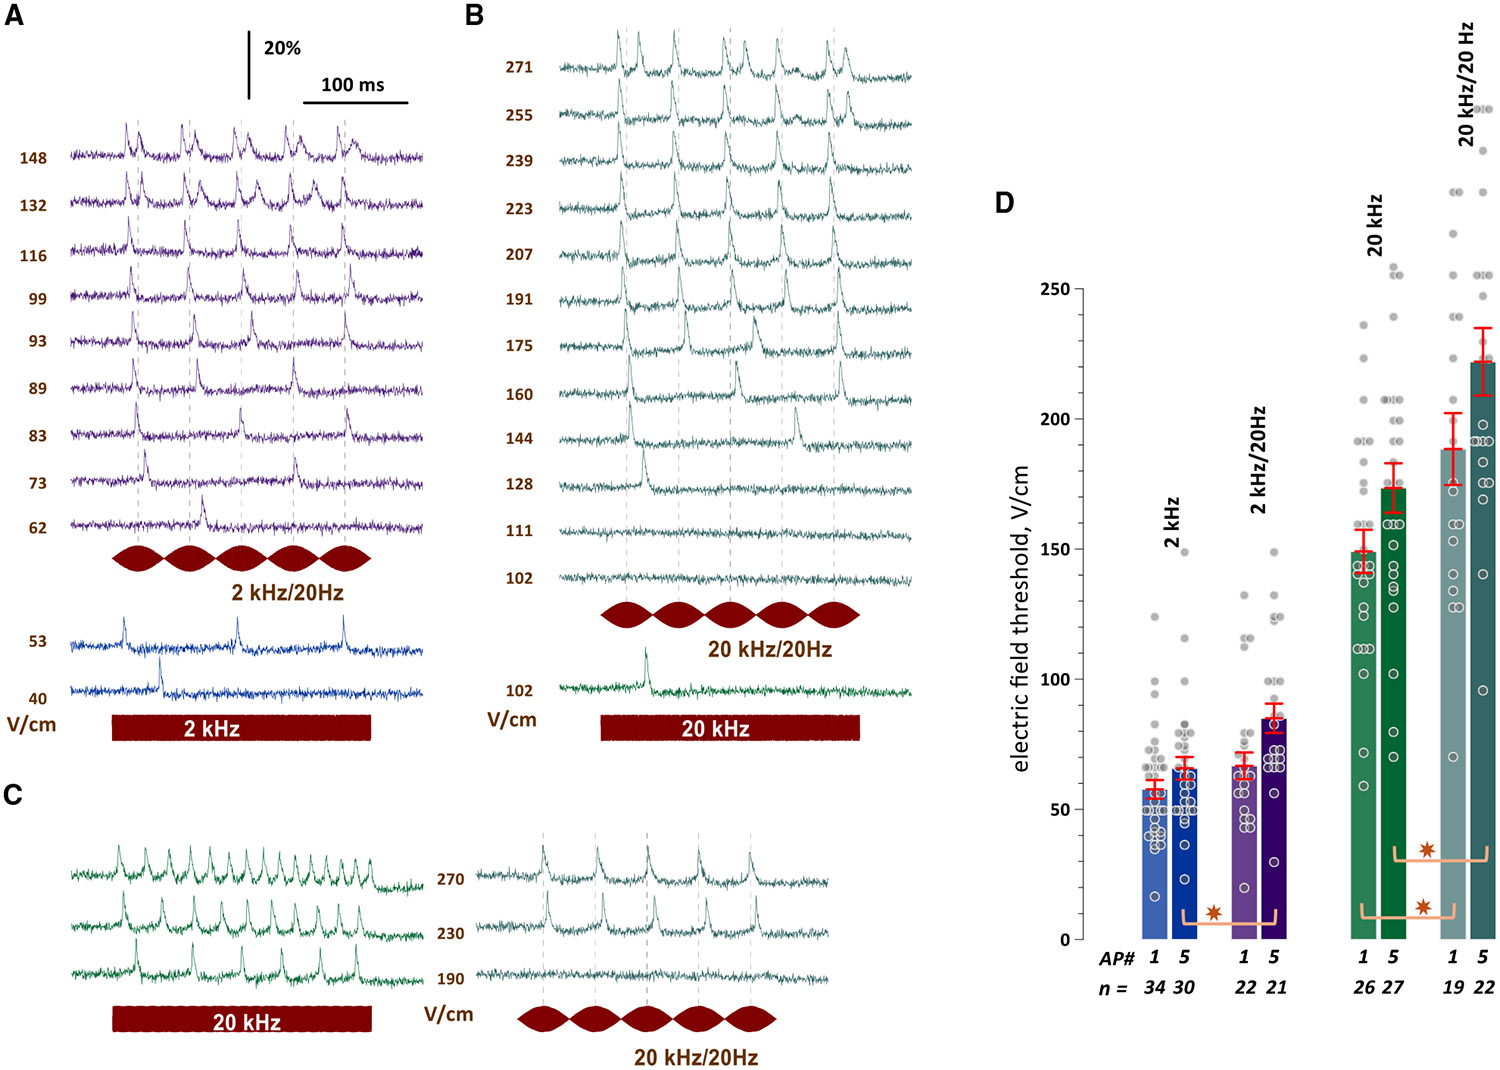
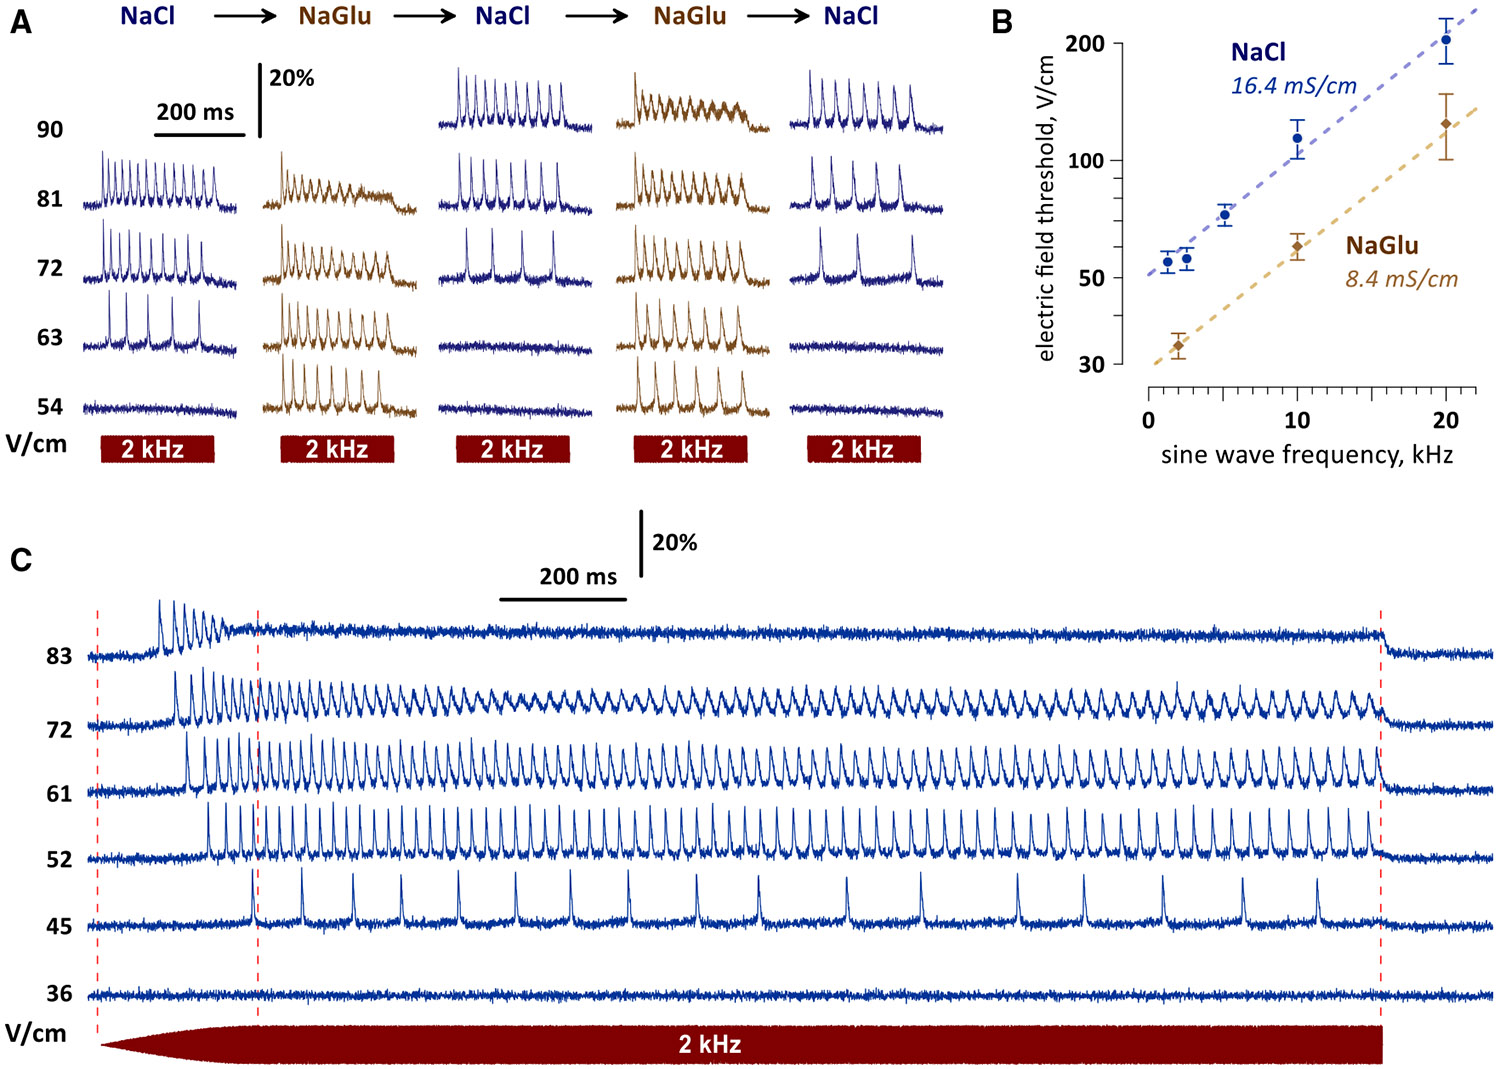
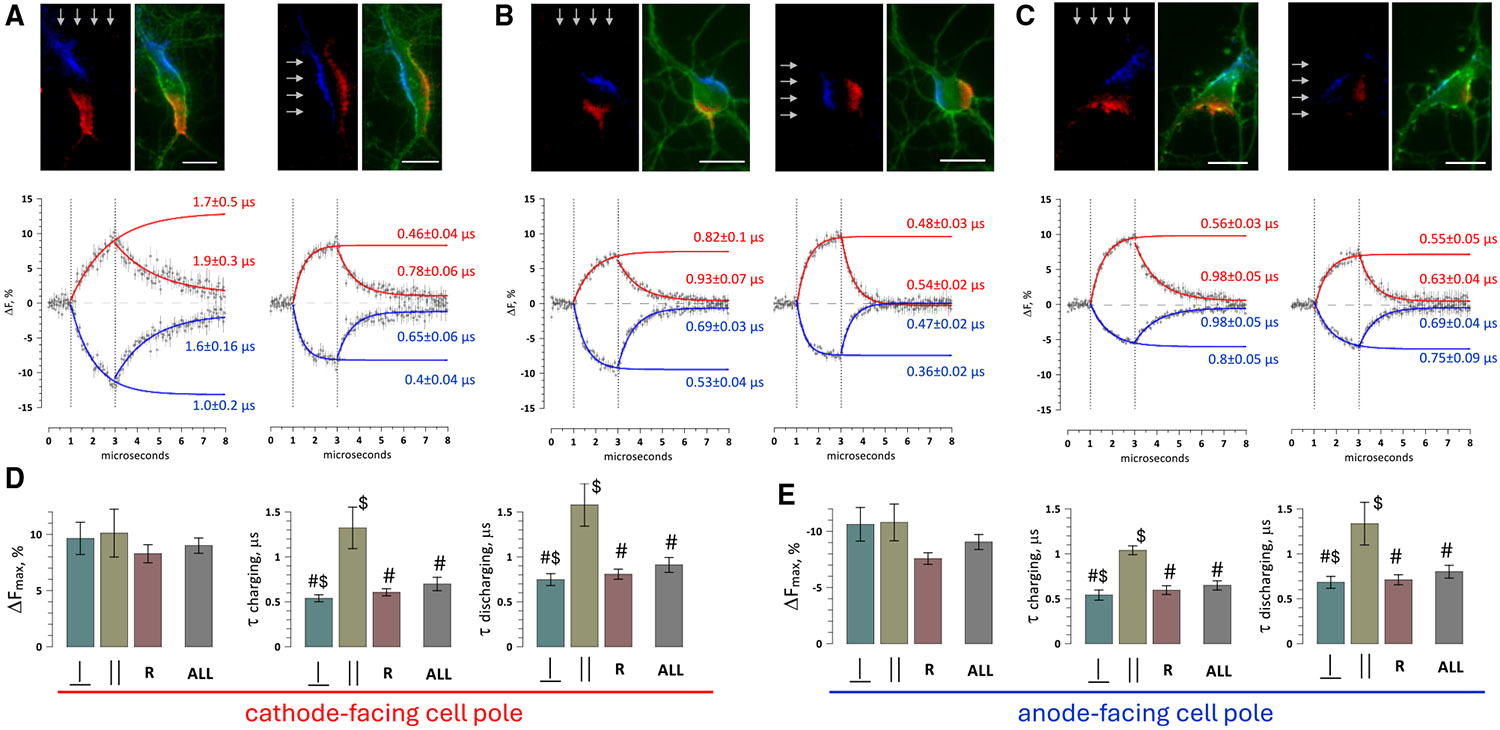
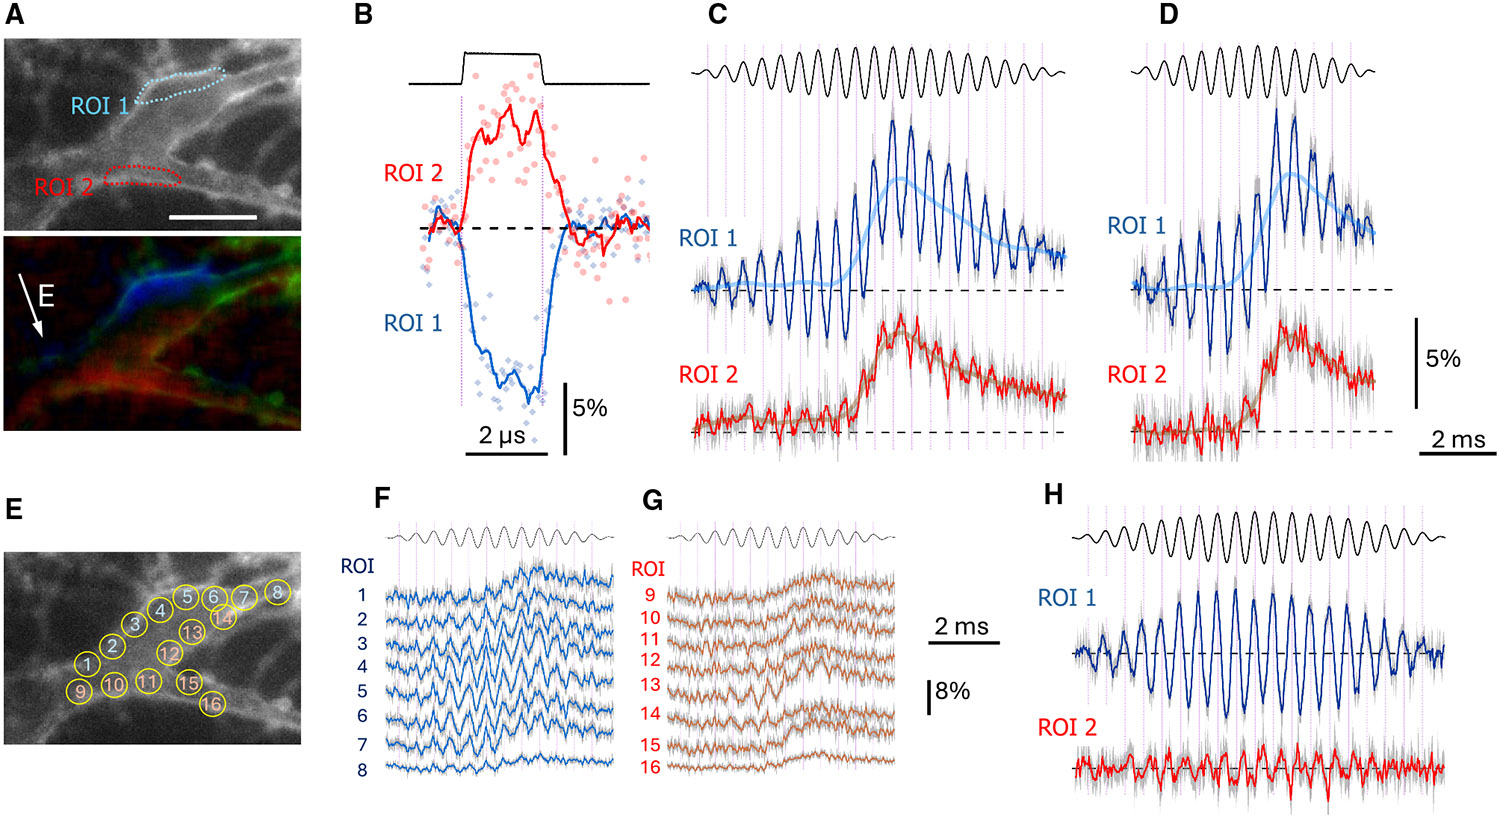
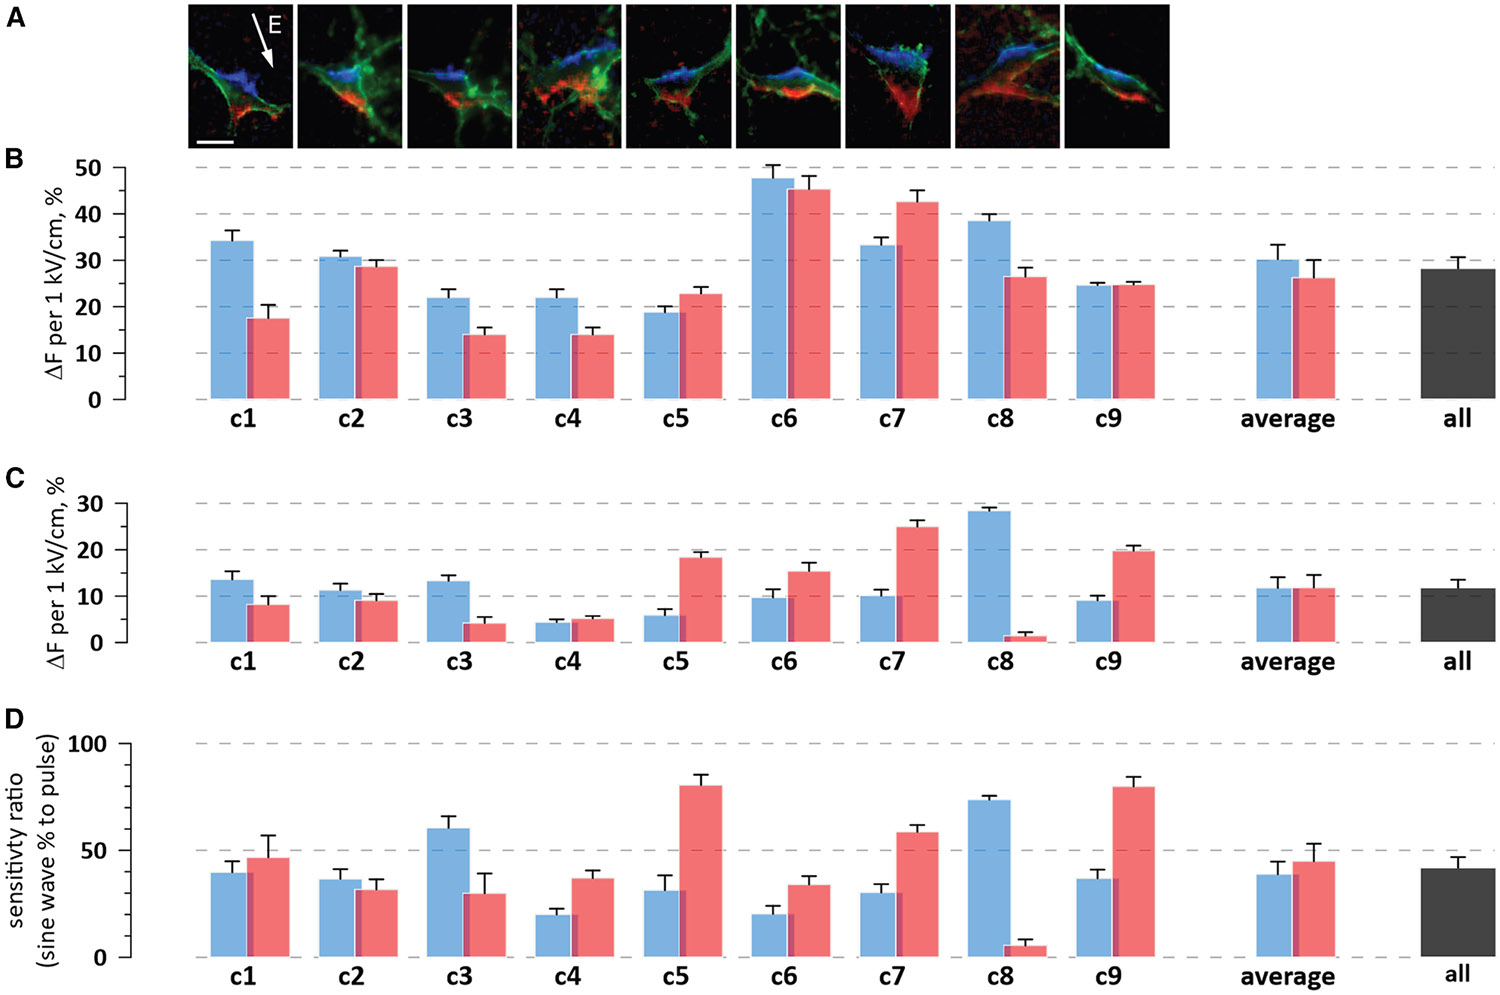
The capacity of temporal interference (TI) stimulation to target deep brain regions without affecting nearby surface electrodes remains uncertain. Using artifact-free optical recording, we compare excitation patterns and thresholds in hippocampal neurons stimulated by "pure" and amplitude-modulated sine waves, representing TI waveforms near electrodes and at the target, respectively. We show that pure 2- and 20-kHz sine waves induce repetitive firing at rates that increase up to 60-90 Hz with stronger electric fields. Beyond this limit, action potentials merge into sustained depolarization, resulting in an excitation block. Modulating the sine waves at 20 Hz aligns firing with amplitude "beats" and prevents the excitation block but does not lower excitation thresholds. Thus, off-target TI effects appear unavoidable, though the patterns of neuronal excitation and downstream effects may differ from those at the target. We further analyze membrane charging and relaxation kinetics at nanoscale resolution and confirm an excitation mechanism independent of envelope extraction.


Conflict of interest statement

DECLARATION OF INTERESTS The authors declare no competing interests.

Figures

Figure 1.
Figure 1.. Unmodulated sine waves at 2 and 20 kHz induce repetitive neuronal firing and excitation block
(A–C) Effect of the electric field strength of a 250-ms sine wave on firing responses in three representative neurons. Shown are traces of the optical membrane potential at the indicated electric field strength (V/cm). The stimulating signal outline and frequency (kHz) are shown under the traces. Inset: the dependence of the maximum firing rate on the electric field strength in the neurons presented in (A)–(C). See also the main text and Figures S1 and S2.
Figure 2.
Figure 2.. Modulated sine waves stimulate less efficiently and elicit different firing patterns compared to unmodulated sine waves
(A) Effect of the electric field strength (V/cm) on the response of a representative neuron to a 250-ms-long, 2-kHz sine wave modulated at 20 Hz. The same neuron was also tested by unmodulated 2-kHz sine waves just above the excitation threshold (lower traces). The stimulation signals (2 kHz/20 Hz and 2 kHz) are shown underneath the traces. See Figure 1 and the main text for more details. (B) Same as (A) but for 20-kHz carrier frequency. (C) Comparison of firing patterns when the same neuron was stimulated by modulated and unmodulated sine waves at the same electric field strengths. (D) Electric field thresholds for 2- and 20-kHz sine waves, with and without 20-Hz amplitude modulation. The thresholds were defined as the minimum electric field strength that elicits 1 or 5 action potentials (APs #1 and #5) during a 250-ms-long stimulation. Bars represent the threshold means ± SEM for n individual neurons in each group. *p < 0.02 for the difference in thresholds of modulated and unmodulated signals, with a two-tailed unpaired t test.
Figure 3.
Figure 3.. Neurons in a less conductive medium are activated and inhibited by weaker electric fields
(A) Reversible and reproducible potentiation of stimulation in a low-conductivity medium. A representative neuron was stimulated by 250-ms, 2-kHz sine waves at different electric field strengths (V/cm), first in the NaCl-based physiological solution (16.4 mS/cm). The same stimuli were tested again after switching to a low-conductivity solution (8.4 mS/cm) composed with sodium gluconate (NaGlu) instead of NaCl. Solutions were switched several times, repeating the stimulation sessions. Note the consistently stronger responses in the NaGlu-based solution despite a gradual rundown and reduction of the neuron’s excitability. See Figure 1 and the main text for more details. (B) Lowering the solution conductivity from 16.4 to 8.4 mS/cm reduces excitation thresholds approximately 2-fold across the range of sine wave frequencies from 2 to 20 kHz. The thresholds were defined as the minimum electric field strength to elicit at least one action potential during a 250-ms-long stimulation with unmodulated sine waves. Mean ± SEM; 4–8 neurons tested per each datapoint. Dashed lines are best fits using the exponential function. (C) Sustained firing and depolarization in a neuron subjected to a 2-s stimulation by unmodulated 2-kHz sine waves at different electric field strengths (V/cm) in the NaGlu-based solution. The sine wave’s amplitude was gradually ramped up from zero to the indicated strength during the first 250 ms. The stimulation protocol was designed to match the one tested previously in brain neurons using current clamp (figure 1F in Grossman et al.).
Figure 4.
Figure 4.. Membrane polarization by 2-μs pulses and the kinetics of charging and relaxation
(A–C) Membrane polarization in elongated, round, and triangular neurons exposed to 2-μs, 140 V/cm rectangular pulses. Two pairs of images show the same neuron exposed to the electric field from two orthogonal directions (arrows). Left images in each pair show depolarization (red) and hyperpolarization (blue) of the optical transmembrane potential (TMP) by the end of the 2-μs pulse. In the right images, de- and hyperpolarized regions overlay the entire cell image (green). Scale bar: 20 μm. Graphs underneath (middle row) show the time course of the optical TMP (ΔF, percentage of the value before the pulse) in the de- and hyperpolarized regions during the 2-μs pulse (between vertical dotted lines) and after it. Measurements were taken at 50-ns intervals, averaged across eight trials, and plotted as the mean values ± SEM (small light gray symbols with vertical error bars). They were fitted with exponential functions (solid red and blue lines for the cathode- and anode-facing poles, respectively), with legends showing the respective charging and relaxation time constants (±SEM). (D and E) Kinetic parameters averaged across a group of neurons with similar shape and orientation to the electric field, separately at the cathode-facing (D) and anode-facing (E) cell poles. The parameters presented are the mean values ± SEM of the maximum optical TMP (the asymptotic ΔFmax, %, determined from the fit equations; note the inverted axis for the anodic pole) and of the charging and discharging time constants (τ, μs). For elongated neurons, the parameters were averaged separately for cells oriented parallel (‖, n = 3) and perpendicular (⊥, n = 6) to the electric field. All other cell shapes were designated as “random” (R, n = 10), and the data for the orthogonal field orientations were pooled together. The kinetic parameters were also averaged for all cells and all orientations (ALL, n = 19). #p < 0.01 between charging and discharging time constants (paired two-tailed t test). $p < 0.01 between the orthogonal cell orientations (unpaired two-tailed t test).
Figure 5.
Figure 5.. Enhanced asymmetry of membrane charging by sine waves compared to rectangular pulses
(A) Identification of de- and hyperpolarized membrane regions in a neuron placed in the electric field (arrow). Top image (gray) is the neuron stained with FluoVolt dye. At the bottom, the same image (in green) is combined with images of the emission gain (red) and loss (blue) by the end of a 2-μs, 257 V/cm square pulse. Two regions of interest (ROIs 1 and 2) were placed over the most hyper- and depolarized areas, respectively; for clarity, they are shown in the gray image with blue and red contours. Arrow is the electric field direction. Scale bar: 20 μm. (B) NMembrane polarization by the 2-μs pulse (top trace) in ROIs 1 and 2. Changes in fluorescence were measured in 50-ns steps. Solid red and blue lines are the running averages using a 5-datapoint window. (C and D) Membrane polarization in the same ROIs during stimulation with a single beat of a 2-kHz sine wave modulated at 100 (C) or 154 (D) Hz. The stimulating signals are shown above the traces; the peak electric field was 136 V/cm. Changes in fluorescence were measured in 20-μs steps and averaged across 12 sine wave stimulation sessions; solid blue and red lines connect the mean values of the 12 sessions, with the light gray background representing the SEM of the means. Note that the oscillations of the optical TMP in ROIs 1 and 2 are antiphasic, and their amplitudes in ROI 2 are paradoxically small. These high-frequency oscillations superimpose a gradual whole-cell depolarization that develops as the sine wave amplitude increases. The time course of the whole-cell depolarization and subsequent repolarization is approximated by the locally estimated scatterplot smoothing (LOESS) fits of the raw data (semi-transparent wider lines cutting through the apparent midpoints of the oscillations). (E) Multiple ROIs marked over the cell to check if switching from pulse to sine wave stimulation caused migration of the most polarized regions away from those identified in (A). (F and G) Same as (D), but measurements were taken in 16 new ROIs (E) drawn on the opposite sides of the cell. Note that the largest oscillations on the lower half of the cell (in ROIs 13 and 14) unexpectedly are synphasic to those on the opposite side. (H) FluoVolt emission oscillations at the sine wave frequency. Same data as in (C) after the subtraction of LOESS fits. See also Figure S3.
Figure 6.
Figure 6.. Sine waves charge neurons less efficiently than pulses
(A) FluoVolt images of 9 neurons at the end of a 2-μs, 257 V/cm rectangular pulse. Hyperpolarization is in blue, depolarization is in red, and the cell outline is in green. See Figure 5A for more details. Two regions of interest (ROIs; not shown for clarity) were selected over the brightest red and blue areas. Scale bar: 20 μm. (B) Electric field sensitivity of FluoVolt to 2-μs pulses. C1 through C9 are cells in the images above; C7 and C8 are the same cells as in Figures 5 and S3. Blue and red bars show the normalized FluoVolt sensitivity in the hyper- and depolarized ROIs, respectively. Mean values ± SEM of 21 measurements from 1 to 2 μs into the pulse. The measurements were also averaged across 9 cells in each ROI (“average”) and pooled together for both ROI (“all”). (C) Electric field sensitivity of FluoVolt to 2-kHz sine waves modulated at 100 Hz (see Figures 5C and S3C). The whole-cell response was subtracted as shown in Figure 5H, and the FluoVolt sensitivity was determined in the same two ROIs as in (B). Error bars are the standard errors of regression coefficients between the emission change and the electric field strength. Other labels are the same as in (B). (D) The apparent reduction of FluoVolt sensitivity when cells are polarized by sine waves. Bars are the ratio of values in (D) and (C). Other labels are the same as in (B).

Similar articles

References

    1. Park JS, Oh DH, Hwang NK, and Lee JH (2018). Effects of neuromuscular electrical stimulation in patients with Parkinson’s disease and dysphagia: A randomized, single-blind, placebo-controlled trial. NeuroRehabilitation 42, 457–463. 10.3233/NRE-172306. - DOI - PubMed
    1. Yadav AP, and Nicolelis MAL (2017). Electrical stimulation of the dorsal columns of the spinal cord for Parkinson’s disease. Mov. Disord 32, 820–832. 10.1002/mds.27033. - DOI - PubMed
    1. Davis P, and Gaitanis J (2020). Neuromodulation for the Treatment of Epilepsy: A Review of Current Approaches and Future Directions. Clin. Ther 42, 1140–1154. 10.1016/j.clinthera.2020.05.017. - DOI - PubMed
    1. San-Juan D, Dávila-Rodríguez DO, Jiménez CR, González MS, Carranza SM, Hernández Mendoza JR, and Anschel DJ (2019). Neuromodulation techniques for status epilepticus: A review. Brain Stimul. 12, 835–844. 10.1016/j.brs.2019.04.005. - DOI - PubMed
    1. Martz ME, Hart T, Heitzeg MM, and Peltier SJ (2020). Neuromodulation of brain activation associated with addiction: A review of real-time fMRI neurofeedback studies. Neuroimage. Clin 27, 102350. 10.1016/j.nicl.2020.102350. - DOI - PMC - PubMed

LinkOut - more resources