. 2025 Sep 16;152(11):765-783.
doi: 10.1161/CIRCULATIONAHA.125.073610. Epub 2025 Aug 5.

Ponatinib, But Not the New Abl-Kinase Inhibitor Asciminib, Activates Platelets, Leukocytes, and Endothelial Cell TNF Signaling to Induce Atherosclerotic Plaque Inflammation, Myocardial Infarction, and Stroke

Affiliations

Ponatinib, But Not the New Abl-Kinase Inhibitor Asciminib, Activates Platelets, Leukocytes, and Endothelial Cell TNF Signaling to Induce Atherosclerotic Plaque Inflammation, Myocardial Infarction, and Stroke

Alec Stepanian et al. Circulation. .

Abstract

Background: Imatinib, the first Abl-tyrosine kinase inhibitor (TKI), improved leukemia outcomes without cardiovascular side effects. Newer agents, including ponatinib, addressed imatinib resistance, improving cancer remission, but substantially increased arterial thrombotic events, including myocardial infarction (MI) and stroke. The mechanism behind ponatinib-induced thrombosis and the cardiovascular effect of asciminib, a newly approved Abl-TKI, remain unknown.

Methods: The effect of clinically relevant plasma concentrations of imatinib, ponatinib, and asciminib were compared with vehicle in vivo using SR-BI-mut/LDLR-knockout (KO) mice to assess spontaneous MI and stroke risk. The mechanism was interrogated in C57BL/6J mice, assessing leukocyte trafficking and thromboinflammation by intravital microscopy and flow cytometry, respectively, and in ApoE-KO mice, assessing plaque phenotype by flow cytometry and histology. In vitro effects on human umbilical vein endothelial cells (ECs) and human coronary artery ECs were determined by flow cytometry, PCR, and immunoblotting. The role of TNF (tumor necrosis factor) signaling was evaluated by pharmacological inhibition and small interfering RNA knockdown.

Results: In SR-BI-mut/LDLR-KO mice, ponatinib significantly accelerated death from MI and stroke compared with vehicle, imatinib, and asciminib. In human ECs, only ponatinib increased expression of TNF receptors (TNFRs) and adhesion molecules (P-selectin, ICAM1 [intercellular adhesion molecule 1], and VCAM1 [vascular cell adhesion molecule 1]). Ponatinib rapidly induced TNFR2 membrane trafficking and TNF signaling in human umbilical vein ECs. TNFR inhibition or TNFR2 knockdown prevented ponatinib induction of EC adhesion molecules. In vivo, ponatinib increased mesenteric vessel adhesion molecules, leukocyte rolling and adhesion to vessels, leukocyte and platelet activation, and platelet-leukocyte aggregates. In ApoE-KO mice, ponatinib increased plaque necrotic core and inflammation, consistent with a rupture-prone phenotype. Asciminib-treated mice developed none of these in vitro or in vivo toxicities. In C57BL/6J mice, TNFR inhibition blocked ponatinib-induced mesenteric adhesion molecule expression and leukocyte trafficking, but not platelet-leukocyte aggregation. TNFR blockade prevented ponatinib-induced plaque inflammation in ApoE-KO mice and MI and stroke in SR-BI-mut/LDLR-KO mice.

Conclusions: Ponatinib, a potent anticancer therapy, activates ECs, platelets, and leukocytes, driving plaque inflammation and death from MI and stroke in mice, mirroring clinical cardiotoxicities in patients with cancer. Asciminib did not induce these effects, suggesting it might be a safer option for imatinib-resistant patients with cancer. Inhibition of TNFR-mediated endothelial activation is sufficient to prevent ponatinib-induced major adverse cardiovascular events.

Keywords: asciminib hydrochloride; atherosclerosis; cardio-oncology; endothelial cells; imatinib mesylate; inflammation; ponatinib hydrochloride.


Conflict of interest statement

The authors report no relevant conflicts of interest. Dr Chen is a founder of and owns shares in Satellite Biosciences, a company that is developing cell-based therapies; and Ropirio Therapeutics, a company that is developing pharmaceuticals. Dr Jaffe is a consultant for Boehringer Ingelheim in an unrelated area.

Figures
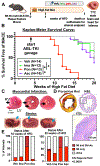
Fig.1:
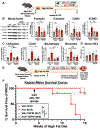
Fig.1:. Ponatinib Induces Spontaneous Myocardial Infarction (MI) and Stroke in the SR-BI-mut/LDLR-KO Plaque Rupture Mouse Model:
(A) Experimental paradigm: 8-week-old male SR-BI-mut/LDLR-KO mice were fed high fat diet (HFD) for 4 weeks to model high risk factor burden followed by randomization to oral administration of vehicle (Veh), imatinib (Ima), ponatinib (Pon), or asciminib (Asc) at doses that achieve clinically relevant serum levels. (B) Kaplan-Meier Survival Curve: Pon significantly accelerates the development of major adverse cardiovascular events (MACE) defined as the composite of death and euthanasia for spontaneous MI or stroke. (C) Representative TTC stained heart and brain sections indicating MI (black arrow) or stroke (blue arrow). Red indicates live tissue; gray indicates areas of necrosis. (D) Representative histologic section of heart from a Pon-treated mouse with MI, showing fibrosis by picrosirius red and inflammation by H&E stain. (E) Quantification of the percent of mice still alive or dead with evidence of MI, stroke, or both after 16 weeks and 20 weeks of HFD. N=12-16 mice/drug. *p<0.05 via Log-rank test (B) and chi-square test (E). (A) made with Biorender.com.
Fig.2:
Fig.2:. Ponatinib Induces Leukocyte Trafficking and EC Adhesion Molecules:
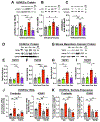
6-week-old male C57BL/6J mice were treated for 3 days by oral gavage with vehicle (Veh), imatinib (Ima), ponatinib (Pon), or asciminib (Asc), and intravital microscopy (IVM) was performed to image leukocyte trafficking. (A) Representative IVM static images of mesenteric vessels. Quantification of (B) leukocyte rolling and (C) leukocyte adhesion. N=10-12 mice per group. (D) Representative immunoblots of mesenteric vessel lysates isolated from identically treated mice and (E) quantification of P-selectin, E-selectin, ICAM1, and VCAM1. N=3-4 sets of pooled (2 mice each) mesenteric vessels. (F) Representative immunoblots of lysate from human coronary artery endothelial cells (HCAECs) treated with Veh, Ima, Pon, or Asc for 24 hours and (G) quantification of E- and P-selectin, ICAM1, and VCAM1 protein. N=4 experiments. *p<0.05, **p<0.01, ***p<0.001, ****p<0.0001, via one way ANOVA with Tukey’s posttest.
Fig. 3:
Fig. 3:. Ponatinib Increases TNF Receptor Expression and Signaling in Human ECs which is Necessary for Adhesion Molecule Induction:
(A-C) Human umbilical vein endothelial cells (HUVECs) were treated with vehicle (Veh), imatinib (Ima), ponatinib (Pon), or asciminib (Asc) for 10 minutes. Representative immunoblots and quantification of; (A) phospho-TRAF2, (B) phospho-ETK, and (C) phospho-NFkB-p65 each normalized to their respective total protein level. N=4-6 experiments. (D-F) Human coronary artery endothelial cells (HCAECs) were treated with Abl-TKIs for 24 hours. Representative immunoblots and quantification of; (E) TNFR1 and (F) TNFR2. N=3-4 experiments. (G-I) Mice were treated for 3 days with Abl-TKIs. Representative immunoblots of mesenteric vessel lysates and quantification of; (H) TNFR1 and (I) TNFR2. N=4 sets of 2 pooled mouse mesenteric vessels. (J-K) HUVECs were pretreated for 15 minutes with Veh or TNFR inhibitor (TNFRi R-7050) and then treated with Veh or Pon for 24 hours. Quantification of (J) mRNA by PCR (N=6-9 experiments) and (K) surface P-selectin and ICAM1 protein by flow cytometry (N=4 experiments). *p<0.05, **p<0.01, ***p<0.001, via one way ANOVA (A-I), two-way ANOVA (J-K), with Tukey’s posttest.
Fig. 4:
Fig. 4:. Ponatinib Rapidly Induces TNF Type 2 Receptors (TNFR2) on the EC Surface Followed by Increased Adhesion Molecule Expression:
(A-C) Time course of HUVECs treated with vehicle (Veh) or ponatinib (Pon) for 15 minutes to 24 hours with flow cytometry to quantify the fold change in surface mean fluorescence intensity (MFI) of; (A) TNFR2, (B) P-selectin, and (C) ICAM1 compared to vehicle. N=8 experiments. (D) Experimental schematic showing the site of action of the TNFR inhibitor (TNFRi) and the vesicle-mediated trafficking inhibitor brefeldin (BRE) used to test the role of TNF signaling versus TNFR membrane trafficking upregulation of TNFR on the EC surface. (E-F) HUVECs were pretreated for 15 minutes with (E) TNFRi or (F) Brefeldin followed by Veh or Pon for 30 minutes and the fold change in the MFI of TNFR2 surface expression compared to vehicle was quantified. (G) HUVECs were pretreated for 15 minutes with TNFRi followed by Veh or Pon for 24 hours and the fold change in the MFI of TNFR2 surface expression compared to vehicle was quantified. N=4 experiments. (H-K) HUVECs were treated with siRNAs specific for (H-I) TNFR1 or (J-K) TNFR2 compared to scrambled (scr) siRNA control for 24 hours followed by Veh or Pon for an additional 24 hours. (H, J) representative immunoblots and (I, K) quantification of P-selectin, E-selectin, ICAM1 and VCAM1. N=5-6 experiments. *p<0.05, **p<0.01, ***p<0.001, ****p<0.0001, via two-way ANOVA with Sidak’s posttest (A-C), two-way ANOVA with Tukey’s posttest (E-K). (D) made with Biorender.com.
Fig. 5:
Fig. 5:. Ponatinib Induces Rupture Prone Plaque Phenotypes and Plaque Inflammation in ApoE-KO Mice:
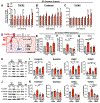
(A) Experimental paradigm: ApoE-KO mice were fed HFD for 4 weeks followed by randomization to oral administration of vehicle (Veh), imatinib (Ima), ponatinib (Pon), or asciminib (Asc) for 4 additional weeks at doses that achieve clinically relevant serum levels. (B) Representative Oil Red O-stained aortic root cryosections and (C) Quantification of plaque cross-sectional area and the percentage of plaque area composed of neutral lipids and necrotic core. (D) Quantification by flow cytometry of aortic arch total CD45+ leukocytes, CD3+/CD19− T-cells, Ly6G−/CD19−/F4/80+ macrophages, and Ly-6G−/CD19−/F4/80− monocytes. N=13-19 mice per group. (E) Representative descending aorta lysate immunoblots and quantification of; (F) P-selectin, (G) E-selectin, (H) ICAM1, (I) VCAM1, (J) TNFR1, and (K) TNFR2. N=6 pairs of pooled aortas per group. *p<0.05, **p<0.01, ***p<0.001, ****p<0.0001, via one-way ANOVA with Tukey’s posttest. (A) made with Biorender.com.
Fig. 6:
Fig. 6:. Ponatinib Activates Blood Platelets, Leukocytes and Induces Platelet-Leukocyte Aggregate Formation In Vivo:
C57BL/6J mice were treated for 3 days with vehicle (Veh), imatinib (Ima), ponatinib (Pon) or asciminib (Asc) and blood flow cytometry and PCR performed to quantify; (A-B) PSGL1 expression on CD45+ single leukocytes and (C-D) P-selectin expression on CD41+ single platelets, each expressed as the fold change in mean fluorescence intensity (MFI) compared to vehicle. (E) PSGL1 mRNA and (F) TNF mRNA by PCR. N=4-6 mice per group. (G) Serum TNF quantified by ELISA. N=8-15 mice per group. (H-I) CD45+ events were gated for CD41 expression to quantify platelet-leukocyte aggregates. N=4-6 mice per group. *p<0.05, **p<0.01, ***p<0.001, ****p<0.0001, via one-way ANOVA with Tukey’s posttest.
Fig. 7:
Fig. 7:. TNFR Inhibition Prevents Ponatinib-Induced EC Activation and Leukocyte Trafficking In Vivo:
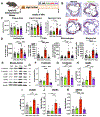
C57BL/6J mice were treated with vehicle (Veh) or ponatinib (Pon) each with Veh or TNF receptor inhibitor (TNFRi) for 3 days. (A-B) Representative immunoblots of mesenteric vessel lysate with quantification of P-selectin, E-selectin, ICAM1, and VCAM1. N=3 sets of 2 pooled mesenteric vessel lysates. (C-E) Representative intravital microscopy (IVM) static images of mesenteric vessels. Quantification of (D) leukocyte rolling and (E) leukocyte adhesion. (F) Serum TNF measured by ELISA. N=5-6 mice per group. (G-K) Mice were treated with Veh or Pon, each with Veh or TNFRi, for 3 days and blood collected for flow cytometry. All CD45+ single leukocytes were gated and (G-H) PSGL1 expression was quantified and expressed as fold change in MFI compared to vehicle. All CD41+ single platelets were gated and (I-J) P-selectin expression was quantified and expressed as the fold change in MFI compared to vehicle. (K) CD45+ leukocyte-containing events were gated for CD41 expression to quantify platelet-leukocyte aggregates. *p<0.05, **p<0.01, ***p<0.001, ****p<0.0001, via two-way ANOVA with Tukey’s posttest.
Fig. 8:
Fig. 8:. TNFR Inhibition Prevents Ponatinib-Induced Atherosclerotic Plaque Inflammation and Rescues Ponatinib-induced MACE in Mice:
(A-D) Experimental paradigm for atherosclerosis study: Male and female ApoE-KO mice were fed high fat diet (HFD) for 4 weeks and then randomized to vehicle (Veh) or ponatinib (Pon) alone or with TNF receptor inhibitor (TNFRi) for 4 additional weeks. (B) Representative immunoblots and quantification of adhesion molecules P-selectin, E-selectin, ICAM1, and VCAM1 in descending aortas. (C) Quantification of aortic arch total CD45+ leukocytes, CD3+/CD19− T cells, Ly6G−/CD19−/F4/80+ macrophages, and Ly-6G−/CD19−/F4/80− monocytes by flow cytometry. Data are represented as fold change compared to vehicle for each sex and males and females are combined. (D) Blood TNF measured by ELISA. N=5-8 mice per group. (E-F) Experimental paradigm for plaque rupture: 8-week-old male SR-BI-mut/LDLR-KO mice were fed HFD for 4 weeks and then randomized to Veh or Pon alone or with TNFRi and followed until death or euthanasia for MI or stroke. (F) Kaplan-Meier Survival Curve: TNFRi co-treatment prevented ponatinib induction of major adverse cardiovascular events (MACE), the composite of death, MI and stroke. N=5-8 mice per group. *p<0.05, **p<0.01, ***p<0.001, ****p<0.0001, via two-way ANOVA with Tukey’s posttest (B-D) and Log-rank test (F). (A) and (E) made with Biorender.com.

References

    1. Herrmann J, Yang EH, Iliescu CA, Cilingiroglu M, Charitakis K, Hakeem A, Toutouzas K, Leesar MA, Grines CL, Marmagkiolis K. Vascular Toxicities of Cancer Therapies: The Old and the New--An Evolving Avenue. Circulation. 2016;133:1272–1289. doi: 10.1161/CIRCULATIONAHA.115.018347 - DOI - PMC - PubMed
    1. Ryan TD, Bates JE, Kinahan KE, Leger KJ, Mulrooney DA, Narayan HK, Ness K, Okwuosa TM, Rainusso NC, Steinberger J, et al. Cardiovascular Toxicity in Patients Treated for Childhood Cancer: A Scientific Statement From the American Heart Association. Circulation. 2025. doi: 10.1161/CIR.0000000000001308 - DOI - PMC - PubMed
    1. Hunter T. Treatment for chronic myelogenous leukemia: the long road to imatinib. J Clin Invest. 2007;117:2036–2043. doi: 10.1172/JCI31691 - DOI - PMC - PubMed
    1. Quintas-Cardama A, Kantarjian H, Cortes J. Imatinib and beyond--exploring the full potential of targeted therapy for CML. Nat Rev Clin Oncol. 2009;6:535–543. doi: 10.1038/nrclinonc.2009.112 - DOI - PubMed
    1. Druker BJ, Guilhot F, O'Brien SG, Gathmann I, Kantarjian H, Gattermann N, Deininger MWN, Silver RT, Goldman JM, Stone RM, et al. Five-Year Follow-up of Patients Receiving Imatinib for Chronic Myeloid Leukemia. New England Journal of Medicine. 2006;355:2408–2417. doi: 10.1056/NEJMoa062867 - DOI - PubMed

MeSH terms