. 2025 Dec;73(12):2386-2406.
doi: 10.1002/glia.70075. Epub 2025 Aug 5.

Selective Deletion of NBCe1 in Reactive Astrocytes Attenuates Ischemic Stroke Brain Damage

Affiliations

Selective Deletion of NBCe1 in Reactive Astrocytes Attenuates Ischemic Stroke Brain Damage

Okan Capuk et al. Glia. 2025 Dec.

Abstract

The electrogenic sodium bicarbonate transporter 1 (NBCe1/Slc4a4), predominantly expressed in astrocytes, is important for brain pH regulation and homeostasis. Increased NBCe1 expression in reactive astrocytes has been associated with neuronal degeneration in ischemic stroke. However, the effects of astrocytic NBCe1 inhibition in stroke remain contradictory, and the underlying mechanisms are unclear. Here, we show that wild-type (WT) mice exhibited elevated NBCe1 expression in the peri-lesional regions at 3 days post-stroke. Astrocytic Nbce1 gene deletion in inducible Gfap-Cre ERT2+/-; Nbce1 f/f mice (Nbce1 iΔAstro) resulted in a significant reduction in NBCe1 mRNA and protein expression in astrocytes. Compared to WT stroke mice, Nbce1 iΔAstro mice displayed reduced infarct volume, decreased brain swelling, improved cerebral blood flow, and accelerated neurological function recovery in the 1-5-day acute post-stroke period. Moreover, Nbce1 iΔAstro stroke mice exhibited decreased blood-brain barrier (BBB) permeability, accompanied by preserved perivascular AQP4 polarization, upregulation of Kir4.1 protein expression, and reduced astrocyte domain volume. Importantly, Nbce1 iΔAstro stroke brains revealed an anti-inflammatory cytokine profiling signature, marked by increased TIMP-1 expression. Together, our findings suggest that astrocytic upregulation of pH regulatory protein NBCe1 after stroke contributes to increased BBB permeability, reactive astrogliosis, inflammation, and perivascular AQP4 dysregulation. Targeting astrocytic NBCe1 may represent a promising new therapeutic strategy to mitigate astroglial dysfunction in the post-stroke brain.

Keywords: AQP4; NBCe1; astrocytic end‐feet; brain pH homeostasis; ischemic stroke.


Conflict of interest statement

The authors declare no conflicts of interest.

Figures
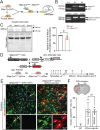
FIGURE 1
FIGURE 1
Generation and characterization of Nbce1 iΔAstro mice. (A) Breeding scheme and generation of astrocyte‐specific Nbce1 knockout mice. (B) Representative PCR analysis of ear biopsy DNA for identification of Cre recombinase and Nbce1 floxed allele. (C) Representative western blotting image and quantification of NBCe1 protein expression in astrocytes isolated from WT and astrocyte‐specific Nbce1 knockout mice. Data are expressed as relative change to WT control. Data are mean ± SD, via unpaired t‐test; n = 4; *p < 0.05 vs. WT. (D) Genetic map and breeding scheme of GfapCre ERT2+/− and Ai14 tdTomato reporter mouse line. (E) Representative confocal images of GFAP immunostaining and tdTom transgene expression in peri‐lesional cortex of WT and GfapCre +/−; tdTom reporter mice at 3 days post‐stroke. (F) Quantification of GFAP‐expressing cells recombined as evaluated by tdTom co‐expression. Data are mean ± SD, n = 4; ns = not significant via unpaired t test.
FIGURE 2
FIGURE 2
Nbce1 deficiency in astrocytes reduced infarct volume and improved sensorimotor functions in stroke mice. (A) Schematic of experimental protocol and timeline. (B) Representative NeuN+ staining images and summary of neurodegeneration in WT or Nbce1 iΔAstro brains at 3 days post stroke. Data are mean ± SD. n = 3; *p < 0.05 vs. WT via unpaired t‐test. (C) Representative T2‐weighted MRI brain images of WT and Nbce1 iΔAstro brains. (D) Quantitative analysis of stroke and hemispheric swelling volume. Data are presented as violin plots. n = 5–6; *p < 0.05 vs. WT via unpaired t‐test. (E) Neuroscore summary. Data are mean ± SEM. n = 4–9; *p < 0.05 vs. WT via two‐way ANOVA followed by Sidak's multiple comparisons. (F–H) Foot fault and adhesive sensation and removal tests prior to tMCAO surgery (−1, baseline) and at 1–5 days post‐tMCAO surgery. Data are mean ± SEM. n = 9; *p < 0.05 vs. WT via two‐way ANOVA followed by Sidak's multiple comparisons.
FIGURE 3
FIGURE 3
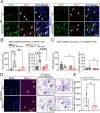
NBCe1 expression is upregulated in GFAP+ reactive astrocytes following ischemic stroke. (A) Representative confocal images showing dual RNAscope F‐ISH and immunofluorescence signals using Nbce1 probes and GFAP antibodies in WT and Nbce1 iΔAstro mice in the peri‐lesion areas at 3 days post stroke. Arrows: High expression; Arrow heads: Low expression. (B, C) Quantification of RNAscope signal as Nbce1 transcript clusters in GFAP+ and non‐GFAP+ cells. Data are mean ± SD, n = 5–6. **p < 0.01, ****p < 0.001; versus the indicated group via two‐way ANOVA followed by Sidak's multiple comparisons. (D) Representative confocal images showing NBCe1 protein expression in IL peri‐lesion areas of WT and Nbce1 iΔAstro brains at 3 days post stroke. (E) Quantification of NBCe1+ puncta within GFAP+ astrocytes. Data are mean ± SD, n = 5–6. *p < 0.05 versus the indicated group via unpaired t‐test.
FIGURE 4
FIGURE 4
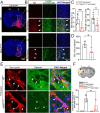
Selective deletion of Nbce1 in GFAP+ astrocytes reduced BBB damage in ischemic stroke brains. (A) Representative low magnification brain map images of EB and DAPI fluorescence in WT and Nbce1 iΔAstro brains at 3 days post‐stroke. (B) Representative confocal images of EB and lectin fluorescence in WT and Nbce1 iΔAstro stroke brains. Arrows: High Evans Blue (EB) fluorescence. Arrowheads: Low EB fluorescence. (C, D) Quantification of EB dye intensity, penetrated area, and EB+ cells in two groups. Data are mean ± SD, n = 4–5; *p < 0.05, **p < 0.01 vs. WT IL via unpaired t test. (E) Representative confocal Z‐stack images of tom‐Lectin labeled vessels and albumin leakage in the peri‐lesion regions. Arrows: High expression. Arrowheads: Low expression. (F) Schematic of data collection from contralateral and peri‐lesion regions and quantification of albumin fluorescence intensity. Data are mean ± SD, n = 5; *p < 0.05 vs. WT IL via unpaired t test.
FIGURE 5
FIGURE 5
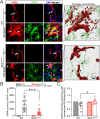
Selective deletion of Nbce1 in GFAP+ astrocytes preserved perivascular AQP4 distribution and reduced its parenchymal expression in stroke brain. (A) Representative confocal images of AQP4 and GFAP immunofluorescence staining in WT and Nbce1 iΔAstro brain sections at 3 days post‐stroke. Arrows: High parenchymal AQP4 expression. Arrowheads: Low parenchymal AQP4 expression. Right panel: 3D reconstruction images in A. Arrows: High expression of AQP4 in astrocyte soma and processes. Arrowheads: Low expression of AQP4 in astrocyte soma and processes. (B) Quantification analysis of AQP4+ puncta in GFAP+ astrocytes. Data are mean ± SD, n = 15–18 replicates from n = 4 brains; *p < 0.05 compared with WT IL via unpaired t‐test. (C) Quantification analysis of perivascular AQP4 polarity. Data are mean ± SD, n = 7; *p < 0.05 vs. WT IL via unpaired t‐test.
FIGURE 6
FIGURE 6
Kir4.1 expression is upregulated in ischemic peri‐lesion areas of Nbce1 iΔAstro stroke brains. (A) Representative low magnification immunofluorescence images showing Kir4.1 expression in WT and Nbce1 iΔAstro stroke mice. Sampling areas in the ischemic peri‐lesion are shown by the white squares. (B) Representative confocal images of Kir4.1 and GFAP immunofluorescence staining in WT and Nbce1 iΔAstro brain sections at 3 days post‐stroke. Arrows: High Kir4.1 expression in astrocytes. Arrowheads: Low Kir4.1 expression. (C, D) Quantification of Kir4.1 signals in CL and IL hemispheres. Data are mean ± SD, n = 5. *p < 0.05, **p < 0.01 versus the indicated group via two‐way ANOVA followed by Sidak's multiple comparisons (C) and unpaired t‐test (D). (E) Representative confocal images showing Kcnj10 (Kir4.1) mRNA and GFAP expression in WT and Nbce1 iΔAstro mice in the peri‐lesion areas at 3 days post stroke. Arrows: High expression; Arrow heads: Low expression. (F) Quantification of Kcnj10 transcript spots in GFAP+ cells. Data are mean ± SD, n = 5. *p < 0.05 via unpaired t‐test. G. Representative confocal images of WT and Nbce1 iΔAstro stroke brain sections showing Dio labeled astrocytes in the ischemic peri‐lesional areas. (H) 3D reconstruction and quantification of astrocyte volume using IMARIS software. Data are mean ± SD, n = 5. *p < 0.05, **p < 0.01 versus the indicated group via two‐way ANOVA followed by Sidak's multiple comparisons.
FIGURE 7
FIGURE 7
Nbce1 iΔAstro mice exhibit faster recovery of regional cerebral blood flow after ischemic stroke. (A) Schematic of experimental design. (B, C) Representative laser speckle imaging analysis of rCBF in the WT and Nbce1 iΔAstro mice prior to sham (B) or tMCAO (C) surgeries. Images shown are for baseline, at 5 min, 1‐, 2‐, or 3‐days post‐sham surgery or tMCAO. Dashed circles indicate the regions of interest for quantification of blood perfusion in MCA regions. (D) Summary analysis of rCBF changes as a percentage of pre‐ischemic baseline in CL and IL hemispheres. Data are mean ± SD, n = 3. (E) Summary analysis of rCBF changes as a percentage of pre‐ischemic baseline in CL and IL hemispheres. Data are mean ± SEM, n = 4; *p < 0.05 vs. WT IL via two‐way ANOVA followed by Sidak's multiple comparisons. (F) Representative confocal images and 3D image reconstructions of CD31 immunostaining and lectin staining in peri‐lesional cortex of WT and Nbce1 iΔAstro brains at 3 days post‐stroke. (G–I) Quantification of vessel volume density, length density, and diameter in CL and IL hemispheres of WT and Nbce1 iΔAstro stroke brains. Data are mean ± SD, n = 5; ns = not significant via two‐way ANOVA followed by Sidak's multiple comparisons. Data are mean ± SEM, n = 5; *p < 0.05 vs. WT via unpaired t‐test.

References

    1. Amatruda, M. , Turati J., Weiss J., et al. 2025. “Aldh1l1‐Cre/ERT2 Drives Flox‐Mediated Recombination in Peripheral and CNS Infiltrating Immune Cells in Addition to Astrocytes During CNS Autoimmune Disease.” Brain and Behavior 15, no. 2: e70239. 10.1002/brb3.70239. - DOI - PMC - PubMed
    1. Bani‐Sadr, A. , Mechtouff L., De Bourguignon C., et al. 2023. “Blood‐Brain Barrier Permeability and Kinetics of Inflammatory Markers in Acute Stroke Patients Treated With Thrombectomy.” Neurology 101, no. 5: e502–e511. 10.1212/WNL.0000000000207460. - DOI - PMC - PubMed
    1. Bankhead, P. , Loughrey M. B., Fernández J. A., et al. 2017. “QuPath: Open Source Software for Digital Pathology Image Analysis.” Scientific Reports 7, no. 1: 16878. 10.1038/s41598-017-17204-5. - DOI - PMC - PubMed
    1. Barbay, T. , Pecchi E., Franco J. J. R., et al. 2024. “Functional Contribution of Astrocytic Kir4.1 Channels to Spasticity After Spinal Cord Injury.” Preprint, bioRxiv, 2024.2010.2011.617793. 10.1101/2024.10.11.617793. - DOI - PubMed
    1. Barisano, G. , Montagne A., Kisler K., Schneider J. A., Wardlaw J. M., and Zlokovic B. V.. 2022. “Blood‐Brain Barrier Link to Human Cognitive Impairment and Alzheimer's Disease.” Nature Cardiovascular Research 1, no. 2: 108–115. 10.1038/s44161-021-00014-4. - DOI - PMC - PubMed

Substances

LinkOut - more resources