Observational Study
. 2025 Aug;97(8):e70533.
doi: 10.1002/jmv.70533.

Vaccination Coverage Against Coronavirus Disease 2019 in People Living on Quilombos in Brazil and Its Association With the Human Development Index and the Quality of the Health System

Affiliations
Observational Study

Vaccination Coverage Against Coronavirus Disease 2019 in People Living on Quilombos in Brazil and Its Association With the Human Development Index and the Quality of the Health System

Patrícia Teixeira Costa et al. J Med Virol. 2025 Aug.

Abstract

Since the slavery period in Brazil, the Quilombola population has faced problems related to social vulnerability and poor health. The coronavirus disease (COVID)-19 pandemic has made this social inequality more evident, and the postpandemic scenario has proved even more challenging with the difficult access to basic living conditions, including low vaccination coverage. In view of this, this study aims to present the epidemiological profile of vaccination against COVID-19 in the population living in quilombos in Brazil. An observational study was carried out using information from the National Health Data Network provided by the Brazilian Ministry of Health. Vaccination coverage was correlated with the human development index (HDI) and health quality indicators. In the Quilombola population, a total of 1 848 494 doses of vaccines were administered, mostly related to the first dose (45.43%) and the second or single-dose vaccine vials (42.17%), representing a vaccination coverage of 48.43% and 49.41%, respectively; in addition, a total of 159.26 doses were administered per 100 inhabitants. There was an imbalance in the vaccination coverage rate and the number of doses administered in relation to the macroregions of Brazil and the Federative Units. In terms of doses administered by age group, the highest concentration was observed among individuals aged 20-59, with over 100 000 doses administered within each group. In the Spearman correlation, the following coefficients were significant: (a) first dose with municipal health spending [CC = -0.57]; (b) second dose or single-dose vaccine vial with HDI [CC = 0.58], HDI-income [CC = 0.58], HDI-education [CC = 0.65], and municipal health spending [CC = -0.61]; and (c) the total number of doses with HDI [CC = 0.58], HDI-income [CC = 0.56], HDI-education [CC = 0.67], and municipal health spending [CC = -0.55]. The epidemiological profile of vaccination against COVID-19 in the Quilombola population in Brazil was associated with a wide variability in relation to macroregions and Federative Units, with few Federative Units vaccinating more than 50% of Quilombola individuals. Among the markers evaluated, the best HDI and the best quality of health services were associated with better vaccination coverage for the first dose, second dose, single-dose vaccine vial, and total number of doses administered in the Quilombola population, demonstrating that there is a relation between social and economic characteristics and the management of vaccines with a potential influence on the outcomes associated with the COVID-19 pandemic.

Keywords: SARS‐CoV‐2; epidemiology; pandemic; public health; quilombo; vaccine; vulnerable population.


Conflict of interest statement

The authors declare no conflicts of interest.

Figures

Figure 1
Figure 1
Number of doses of vaccines against coronavirus disease (COVID)‐19 administered in the Quilombola population of Brazil—temporal description. The image shows the percentage of the total number of doses administered by type of dose [dose 1 (first dose), dose 2 (second dose) and single dose, booster dose, and total number of doses]. The number of vaccine doses administered was obtained from the National Health Data Network, Brazilian Ministry of Health, updated on 07/31/2024.
Figure 2
Figure 2
Profile of vaccination against coronavirus disease (COVID)‐19 in the Quilombola population of Brazil. (A) Overview of the distribution of dose profiles of COVID‐19 vaccines used in the Quilombola population of Brazil. (B) Overview of the distribution of dose profiles of COVID‐19 vaccines used in the Quilombola population of Brazil according to the age group of the analyzed population. The number of vaccine‐administered doses was obtained from the National Health Data Network, Brazilian Ministry of Health, updated on 07/31/2024. The age range description was made according to the platform used to obtain the data.
Figure 3
Figure 3
Overview of the vaccination profile (vaccination coverage rate and number of doses per 100 inhabitants) against coronavirus disease (COVID)‐19 of the Quilombola population in Brazil according to the first dose, second dose, or single dose, and total number of doses. The data are presented by macroregion (green: South, Central‐West, North, Southeast, and Northeast) and Federation Units [blue and red (best rates): States and Federal District]. The vaccination coverage rate for Quilombolas was calculated using the following formula: [(Number of inhabitants/Number of vaccine doses administered) * 100]. Thus, the index shows the number of doses per 100 inhabitants, representing the vaccination coverage (%) of the population served in relation to the first and second (or single dose) doses of COVID‐19 vaccines. The number of doses of vaccines administered was obtained from the National Health Data Network, Brazilian Ministry of Health, updated on 07/31/2024.
Figure 4
Figure 4
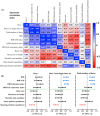
Spearman's correlation coefficient (CC) between the human development index (HDI) and health quality indicators of the Federative Units of Brazil with the doses of vaccines administered in the Quilombola population of Brazil. (A) Correlation matrix for Spearman's CC. (B) Spearman's CC with the description of their respective 95% confidence intervals (95% CI) for the markers associated to the first dose, second dose (or single dose), and for the total number of doses. In (A), the blue markers indicate positive correlation indices, and the red markers indicate negative correlation indices. In (B), the blue markers indicate significant and positive correlation indices, and the red markers indicate significant and negative correlation indices. The Quilombolas' vaccination coverage rate was calculated using the following formula: [(Number of inhabitants/Number of vaccine doses administered) * 100]. In this way, the index shows the number of doses per 100 inhabitants, being representative of the vaccination coverage (%) of the population served in relation to the first and second (or single dose) doses of the vaccines against coronavirus disease (COVID)‐19. The number of doses of vaccines administered was obtained from the National Health Data Network, Ministry of Health of Brazil, updated on 07/31/2024. The HDI values were calculated by the Atlas of Human Development in Brazil [35]. The quality of health services was assessed using indicators obtained on the Institute for Health Policy Studies portal. The indicators were divided into thematic blocks: (a) basic care, (b) resources, (c) mortality and morbidity, and (d) spending (municipal and state) (IEPS Data Portal—iepsdata.org.br) [36]. The thematic blocks were described by the position occupied by each State or Federal District according to the indicators evaluated, that is, the first position is indicative of better indices in the indicators and, from there, up to position 27, we have a decrease in the evaluated indices (drop in the quality of health according to the indicators evaluated in the thematic block). GNI, Gross National Income.
Figure 5
Figure 5
Overview of the association between vaccination coverage for the first dose of the coronavirus disease (COVID)‐19 vaccine in the Quilombola population of Brazil according to the human development index, quality of health services, Federation Units, and macroregions (South, Central‐West, North, Southeast, and Northeast). The vaccination coverage rate for Quilombolas was calculated using the following formula: [(Number of inhabitants/Number of vaccine doses administered) * 100]. In this way, the index shows the number of doses per 100 inhabitants and is representative of the vaccination coverage (%) of the population served in relation to the first dose of COVID‐19 vaccines. The number of doses of vaccines administered was obtained from the National Health Data Network, Brazilian Ministry of Health, updated on 07/31/2024. The human development index values were calculated by the Atlas of Human Development in Brazil [35]. The quality of health services was assessed using indicators obtained from the Institute for Health Policy Studies portal. The indicators were divided into thematic blocks: (A) basic care, (B) resources, (C) mortality and morbidity, (D) state health spending, and (E) municipal health spending (IEPS Data Portal—iepsdata.org.br) [36]. The thematic blocks were described by the position occupied by each State or Federal District according to the indicators assessed, ‐that is, the first position is indicative of better indices in the indicators and, from there, up to position 27, we have a decrease in the indices assessed (drop in the quality of health according to the indicators assessed in the thematic block). [Northeast] AL, Alagoas; BA, Bahia; CE, Ceará; MA, Maranhão; PB, Paraíba; PE, Pernambuco; PI, Piauí; RN, Rio Grande do Norte; SE, Sergipe; [Southeast] ES, Espírito Santo; MG, Minas Gerais; RJ, Rio de Janeiro; SP, São Paulo; [North] AC, Acre; AM, Amazonas; AP, Amapá; PA, Pará; RO, Rondônia; RR, Roraima; TO, Tocantins; [Central‐West] FD, Federal District; GO, Goiás; MS, Mato Grosso do Sul; MT, Mato Grosso; [South] PR, Paraná; RS, Rio Grande do Sul; SC, Santa Catarina.
Figure 6
Figure 6
Overview of the association between vaccination coverage for the second dose of the coronavirus disease (COVID)‐19 vaccine in the Quilombola population of Brazil according to the human development index, quality of health services, Federation Units, and macroregions (South, Central‐West, North, Southeast, and Northeast). The vaccination coverage rate for Quilombolas was calculated using the following formula: [(Number of inhabitants/Number of vaccine doses administered) * 100]. In this way, the index shows the number of doses per 100 inhabitants and is representative of the vaccination coverage (%) of the population served in relation to the second dose of COVID‐19 vaccines. The number of doses of vaccines administered was obtained from the National Health Data Network, Brazilian Ministry of Health, updated on 07/31/2024. The human development index values were calculated by the Atlas of Human Development in Brazil [35]. The quality of health services was assessed using indicators obtained from the Institute for Health Policy Studies portal. The indicators were divided into thematic blocks: (A) basic care, (B) resources, (C) mortality and morbidity, (D) state health spending, and (E) municipal health spending (IEPS Data Portal—iepsdata.org.br) [36]. The thematic blocks were described by the position occupied by each State or Federal District according to the assessed indicators, that is, the first position is indicative of better indices in the indicators and, from there, up to position 27, we have a decrease in the assessed indices (drop in the quality of health according to the indicators assessed in the thematic block). [Northeast] AL, Alagoas; BA, Bahia; CE, Ceará; MA, Maranhão; PB, Paraíba; PE, Pernambuco; PI, Piauí; RN, Rio Grande do Norte; SE, Sergipe; [Southeast] ES, Espírito Santo; MG, Minas Gerais; RJ, Rio de Janeiro; SP, São Paulo; [North] AC, Acre; AM, Amazonas; AP, Amapá; PA, Pará; RO, Rondônia; RR, Roraima; TO, Tocantins; [Central‐West] FD, Federal District; GO, Goiás; MS, Mato Grosso do Sul; MT, Mato Grosso; [South] PR, Paraná; RS, Rio Grande do Sul; SC, Santa Catarina.
Figure 7
Figure 7
Overview of the association between vaccination coverage for the total number of doses of the coronavirus disease (COVID)‐19 vaccine in the Quilombola population of Brazil according to the human development index, quality of health services, Federation Units, and macroregions (South, Central‐West, North, Southeast, and Northeast). The vaccination coverage rate for Quilombolas was calculated using the following formula: [(Number of inhabitants/Number of vaccine doses administered) * 100]. Thus, the index shows the number of doses per 100 inhabitants. The number of doses of vaccines administered was obtained from the National Health Data Network, Brazilian Ministry of Health, updated on 07/31/2024. The human development index values were calculated by the Atlas of Human Development in Brazil [35]. The quality of health services was assessed using indicators obtained from the Institute for Health Policy Studies Portal. The indicators were divided into thematic blocks: (A) basic care, (B) resources, (C) mortality and morbidity, (D) state health spending, and (E) municipal health spending (IEPS Data Portal—iepsdata.org.br) [36]. The thematic blocks were described by the position occupied by each State or Federal District according to the indicators assessed, i.e. the first position is indicative of better indices in the indicators and, from there, up to position 27, we have a decrease in the indices assessed (drop in the quality of health according to the indicators assessed in the thematic block). [Northeast] AL, Alagoas; BA, Bahia; CE, Ceará; MA, Maranhão; PB, Paraíba; PE, Pernambuco; PI, Piauí; RN, Rio Grande do Norte; SE, Sergipe; [Southeast] ES, Espírito Santo; MG, Minas Gerais; RJ, Rio de Janeiro; SP, São Paulo; [North] AC, Acre; AM, Amazonas; AP, Amapá; PA, Pará; RO, Rondônia; RR, Roraima; TO, Tocantins; [Central‐West] FD, Federal District; GO, Goiás; MS, Mato Grosso do Sul; MT, Mato Grosso; [South] PR, Paraná; RS, Rio Grande do Sul; SC, Santa Catarina.

Similar articles

References

    1. Polidoro M., de Assis Mendonça F., Meneghel S. N., et al., “Territories Under Siege: Risks of the Decimation of Indigenous and Quilombolas Peoples in the Context of COVID‐19 in South Brazil,” Journal of Racial and Ethnic Health Disparities 8 (2021): 1119–1129, 10.1007/s40615-020-00868-7. - DOI - PMC - PubMed
    1. Ribeiro B. C., Garcia C. G. R., Lima L. J. P., Guerreiro J. F., Póvoa M. M., and Cunha M. G., “Malaria in a Vulnerable Population Living in Quilombo Remnant Communities in the Brazilian Amazon: A Cross‐Sectional Study From 2005‐2020,” Revista do Instituto de Medicina Tropical de São Paulo 66 (2024): e25, 10.1590/S1678-9946202466025. - DOI - PMC - PubMed
    1. Ramos Costa L. G., Mercês Pinheiro A. C., Cabral Miranda I. P., et al., “Aspects of Sexuality in Quilombola Communities' Young Adults in Eastern Brazilian Amazon,” Behavioral Sciences 13 (2023): 492, 10.3390/bs13060492. - DOI - PMC - PubMed
    1. Martins A. F., de Souza D. R. V., de Rezende Neto J. M., et al., “A Higher Number of SARS‐COV‐2 Infections in Quilombola Communities Than in the Local Population in Brazil,” Frontiers in Public Health 11 (2023): 1095162, 10.3389/fpubh.2023.1095162. - DOI - PMC - PubMed
    1. Madureira K. G. and Barsaglini R., “The Mata Cavalo/Brazil Quilombo and the COVID‐19 Syndemic: Racism and the Right to (R)Exist in Question,” Ciencia & Saude Coletiva 29 (2024): e08322023, 10.1590/1413-81232024293.08322023. - DOI - PubMed

Publication types

Substances

LinkOut - more resources