Observational Study
. 2025 Aug 1;66(11):6.
doi: 10.1167/iovs.66.11.6.

Polarization-Sensitive Optical Coherence Tomography Imaging of Posterior Staphyloma Edges in Eyes With High Myopia

Affiliations
Observational Study

Polarization-Sensitive Optical Coherence Tomography Imaging of Posterior Staphyloma Edges in Eyes With High Myopia

Yijin Wu et al. Invest Ophthalmol Vis Sci. .

Abstract

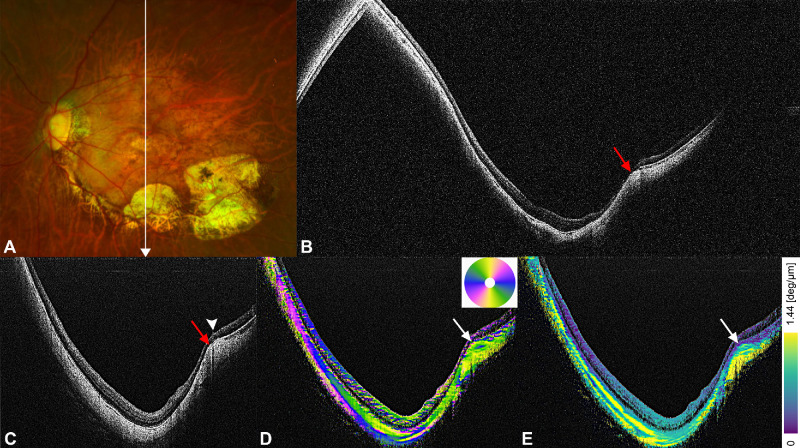
Purpose: To investigate the arrangement and orientation of the collagen fibers in the inner and outer scleral layers at the edges of posterior staphylomas using polarization-sensitive optical coherence tomography (PS-OCT).

Methods: This observational case series study enrolled 105 patients with high myopia (refractive error <-6.0 diopters or axial length ≥26.5 mm) who underwent PS-OCT examinations between August 2023 and May 2024 at the Institute of Science Tokyo. Posterior staphyloma was diagnosed in 88 eyes of 60 patients using ultra-widefield OCT, followed by PS-OCT image processing. Thirty-six eyes from 27 patients with clearly identifiable staphyloma edges were included for final analysis. PS-OCT images were analyzed to assess the scleral fiber orientation and birefringence at the staphyloma edges, including macular and inferior types.

Results: Optic axis images showed that 25 (18 upper and 7 lower) of 30 (83.3%) macular staphyloma edges had an aggregation of the inner scleral fibers, characterized by an arc-like gathering of the horizontal fibers along the edge. All eight upper edges of the eight eyes with an inferior staphyloma had an aggregation of the inner scleral fibers with relatively linear horizontal fibers across the macula. Birefringence images of the upper and lower edges of the macular and inferior staphylomas had different patterns, including a mixture of low and high, and relatively high birefringence.

Conclusions: An uneven aggregation of inner scleral fibers at the staphyloma edges in highly myopic eyes offers novel insights into staphyloma pathogenesis. This finding also holds pivotal implications for developing targeted interventions to prevent the progression of staphylomas in high myopia.


Conflict of interest statement

Disclosure: Y. Wu, None; H. Lu, None; C. Chen, None; J. Xiong, None; M. Yamanari, Tomey Corporation (E), JP 6463051 B2 (P), US 9593936 B2 (P), EP 2995245 B1 (P), JP 6542178 B2 (P), JP 7332131 B2 (P) issued to Tomey Corporation; H. Takahashi, None; K. Sugisawa, None; M. Okamoto, Tomey Corporation (E); Y. Wang, None; Z. Wang, None; T. Takahashi, None; K. Kamoi, None; K. Ohno-Matsui, Tomey Corporation (R), Santen (C), CooperVision (C)

Figures

Figure 1.
Figure 1.
Polarization-sensitive OCT images of the upper edge of an eye with wide macular staphyloma. (A) Right fundus photograph of a 52-year-old woman with a refractive error of −8.5 D and an axial length of 27.92 mm showing a scarred macular neovascularization (MNV) and a small atrophy (arrowhead) temporal to the MNV. The arrow points to the PS-OCT scan line in images CE. (B) A vertical UWF-OCT image across the fovea showing the staphyloma edge superior to the macula (arrow). An MNV is also seen. A retinal vein (arrowhead) is situated over the staphyloma edge. (C) A vertically scanned PS-OCT intensity image nasal to the fovea shows a steep staphyloma edge superior to the macula (arrow). Above the staphyloma edge, a retinal vein (arrowhead) can be seen. (D) A vertical scan of the optic axis image indicates an aggregation of horizontally oriented blue fibers at the staphyloma edge (arrow). (E) Vertical section of the birefringence image showing a mixture of high (yellow) and low (green) birefringence at the staphyloma edge (arrow). deg, degrees.
Figure 2.
Figure 2.
Polarization-sensitive OCT images of the upper edge of an eye with wide macular staphyloma. (A) Left fundus photograph of a 75-year-old woman with an implanted intraocular lens and an axial length of 30.0 mm showing macular atrophy and a wide-ranging patchy choroidal atrophy inferior to the macula. The arrow indicates the PS-OCT scan line in images CE. (B) A vertical UWF-OCT image across the fovea shows the upper staphyloma edge superior to the macula (arrow). (C) A vertically scanned PS-OCT intensity image shows a staphyloma edge superior to the macula (arrow). (D) In the vertical scan of the optic axis image, horizontally running blue fibers are densely gathered at the staphyloma edge (arrow). (E) Vertical section of the birefringence image showing relatively high birefringence fibers (yellow) at the staphyloma edge (arrow). deg, degrees.
Figure 3.
Figure 3.
Polarization-sensitive OCT images of the upper edge of an eye with narrow macular staphyloma. (A) Left fundus photograph of a 58-year-old woman with a refractive error of −12.3 D and an axial length of 27.56 mm showing diffuse choroidal atrophy. The arrow points to the PS-OCT scan line in images CE. (B) A vertical scan of UWF-OCT image across the fovea showing a mild staphyloma edge superior to the macula (arrow). A retinal vein (arrowhead) is situated above the staphyloma edge. (C) A vertically scanned PS-OCT intensity image across the macula shows a mild staphyloma edge superior to the macula (arrow), with a retinal vein (arrowhead) located over the staphyloma edge. (D) A vertical scan of the optic axis image shows the thickening of fibers in a mixture of oblique (pink) and horizontal (blue) orientations at the staphyloma edge (arrow). (E) Vertical section of the birefringence image showing a mixture of high (yellow) and low (green) birefringence at the staphyloma edge (arrow). (F, G) En face streamlined images of the sclera fibers. (F) A streamlined image rendered by ParaView viewed from inside the eye. (G) An arc-like aggregation of inner horizontal scleral fibers (blue) is observed along the staphyloma edge (white dotted curved line). The orientation of scleral fibers is in the opposite direction above and below the staphyloma edge (curved arrows). deg, degrees.
Figure 4.
Figure 4.
Polarization-sensitive OCT images of the lower edge of an eye with wide macular staphyloma. (A) Left fundus photograph of a 75-year-old woman with an implanted intraocular lens and an axial length of 33.21 mm showing two patchy choroidal atrophies with well-demarcated borders along the lower-temporal vein. The lower edge of the staphyloma is seen along this vein. The arrow indicates the PS-OCT scan line in images CE. (B) A vertical UWF-OCT image across the fovea showing the staphyloma edge inferior to the macula (arrow). (C) A vertically scanned PS-OCT intensity image showing a steep staphyloma edge inferior to the macula (arrow). On the staphyloma edge, a retinal vein can be observed (arrowhead). (D) In the vertical scan of the optic axis image, mainly vertical fibers (yellow) are gathered at the staphyloma edge (arrow). (E) Vertical section of the birefringence image showing relatively high birefringence fibers (yellow) at the staphyloma edge (arrow). deg, degrees.
Figure 5.
Figure 5.
Polarization-sensitive OCT images of the lower edge of an eye with narrow macular staphyloma. (A) Left fundus photograph of a 51-year-old woman with a refractive error of −14.5 D and an axial length of 30.76 mm showing diffuse choroidal atrophy. The arrow points to the PS-OCT scan line in images CE. (B) A vertical UWF-OCT image across the fovea showing the staphyloma edge inferior to the macula (arrow). Retinal vessels (arrowheads) are seen on the top of the staphyloma edge. An inner and outer retinoschisis surrounding the retinal vessel can also be seen. (C) A vertically scanned PS-OCT intensity image shows the lower staphyloma edge located beneath the retinal vessels (arrowheads). It is accompanied by retinoschisis surrounding these vessels. (D) In the vertical scan of the optic axis image, vertical fibers are predominantly thickened at the staphyloma edge (arrow). (E) Vertical section of the birefringence image showing relatively high birefringence fibers (yellow) at the staphyloma edge (arrow). deg, degrees.
Figure 6.
Figure 6.
Polarization-sensitive OCT images of the upper edge of an eye with inferior staphyloma. (A) Right fundus photograph of a 74-year-old woman with an implanted intraocular lens and an axial length of 26.88 mm showing the depigmented margin of the inferior staphyloma across the macula (arrows). (B) The red arrow in the en face OCT intensity projection indicates the PS-OCT scan line in images DF. (C) A vertical scan of a UWF-OCT image across the fovea showing the upper edge of a staphyloma extending across the macula (arrow). (D) A vertically scanned PS-OCT intensity image across the fovea shows the upper edge of the staphyloma (arrow). (E) A vertical scan of the optic axis image shows that the horizontally oriented blue fibers (arrow) are aggregated at the staphyloma edge. (F) The vertical section of the birefringence image shows high birefringence fibers (yellow, indicated by an arrow) at the staphyloma edge. (G, H) En face streamline images of the sclera fibers. (G) Interior view of the streamlined image rendered by ParaView. (H) A linear structure is observed along the staphyloma edge (indicated by the white dotted line). Near the nasal margin of the staphyloma edge, scleral fibers running in opposite directions are seen merging into this upper edge from above and below (curved arrows). deg, degrees.
Figure 7.
Figure 7.
Images of retinal and retinal vascular abnormalities at the edges of macular staphyloma. (A) Fundus photograph of the left eye of a 67-year-old woman with an axial length of 30.03 mm showing mild diffuse choroidal atrophy. The arrow indicates the PS-OCT scan line in image B. (B) Vertically scanned PS-OCT intensity image shows the retinal vein (arrowhead) located over the upper staphyloma edge (arrow). Retina thinning around this vessel is also noted. (C) Fundus photograph of the right eye of a 71-year-old woman with an axial length of 31.65 mm showing macular neovascularization and macular atrophy. The arrow indicates the PS-OCT scan line in image D. (D) A vertically scanned PS-OCT intensity image shows an anterior protrusion of a retinal vessel (arrowhead) over the edge of the staphyloma (arrow), accompanied by thinning of the surrounding retina. (E) Fundus photograph of the left eye of a 55-year-old woman with an axial length of 29.92 mm showing diffuse choroidal atrophy. The arrow indicates the PS-OCT scan line in image F. (F) Vertically scanned PS-OCT intensity image shows an anteriorly protruded retinal vessel (arrowhead) over the staphyloma edge (arrow).

Similar articles

References

    1. Spaide RF, Ohno-Matsui K, Yannuzzi LA.. Pathologic Myopia. New York, NY: Springer; 2013.
    1. Curtin BJ. The posterior staphyloma of pathologic myopia. Trans Am Ophthalmol Soc. 1977; 75: 67–86. - PMC - PubMed
    1. Ohno-Matsui K. Proposed classification of posterior staphylomas based on analyses of eye shape by three-dimensional magnetic resonance imaging and wide-field fundus imaging. Ophthalmology. 2014; 121(9): 1798–1809. - PubMed
    1. Ohno-Matsui K, Lai TY, Lai CC, Cheung CM.. Updates of pathologic myopia. Prog Retin Eye Res. 2016; 52: 156–187. - PubMed
    1. Guo X, Xiao O, Chen Y, et al.. Three-dimensional eye shape, myopic maculopathy, and visual acuity: the Zhongshan Ophthalmic Center-Brien Holden Vision Institute High Myopia Cohort Study. Ophthalmology. 2017; 124(5): 679–687. - PubMed

Publication types

LinkOut - more resources