. 2025 Aug 4;40(30):e94.
doi: 10.3346/jkms.2025.40.e94.

National Wastewater Surveillance of SARS-CoV-2 Across Provinces and Regions in the Republic of Korea From January to August 2023

Affiliations

National Wastewater Surveillance of SARS-CoV-2 Across Provinces and Regions in the Republic of Korea From January to August 2023

You-Jung Choi et al. J Korean Med Sci. .

Abstract

Background: Wastewater surveillance (WS) technology has gained significant attention in many countries due to its role in the monitoring of infectious diseases within communities and complementing clinical testing to prevent coronavirus disease 2019 (COVID-19) outbreaks. In 2023, the Korea Disease Control and Prevention Agency (KDCA) launched the Korea Wastewater Surveillance (KOWAS) project in collaboration with 17 cities and provinces to track COVID-19 outbreaks.

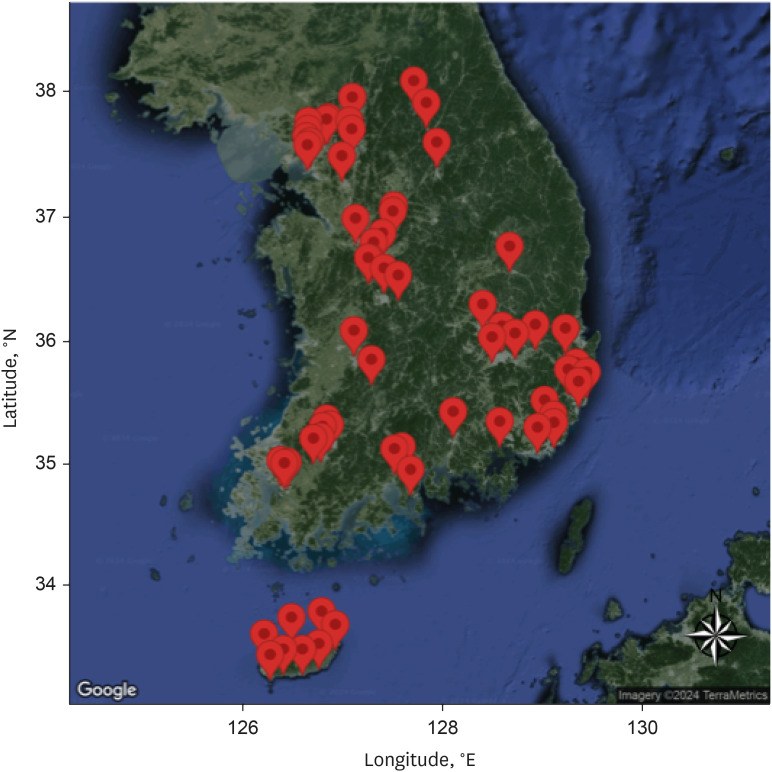
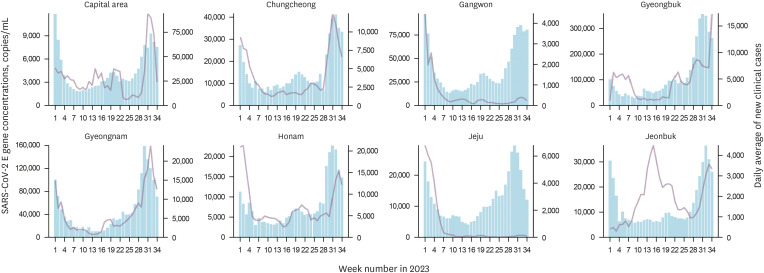
Methods: From January to August 2023, the concentrations of the severe acute respiratory syndrome coronavirus 2 (SARS-CoV-2) E gene in wastewater were monitored in 19 institutes of health and environmental research, all within local governments. Influent samples were collected from 62 wastewater treatment plants (WWTPs) and weekly trends in SARS-CoV-2 E gene concentrations in wastewater were compared to those of new COVID-19 cases.

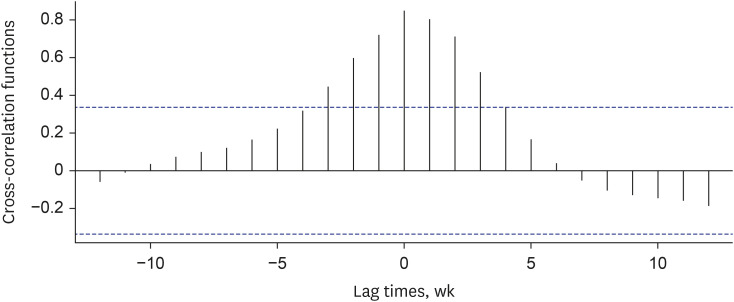
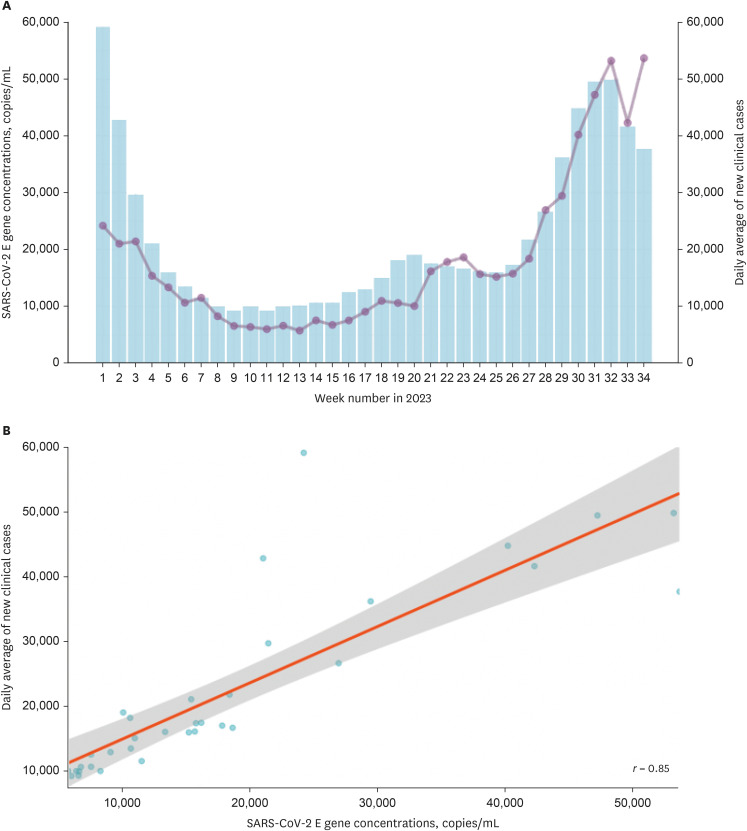
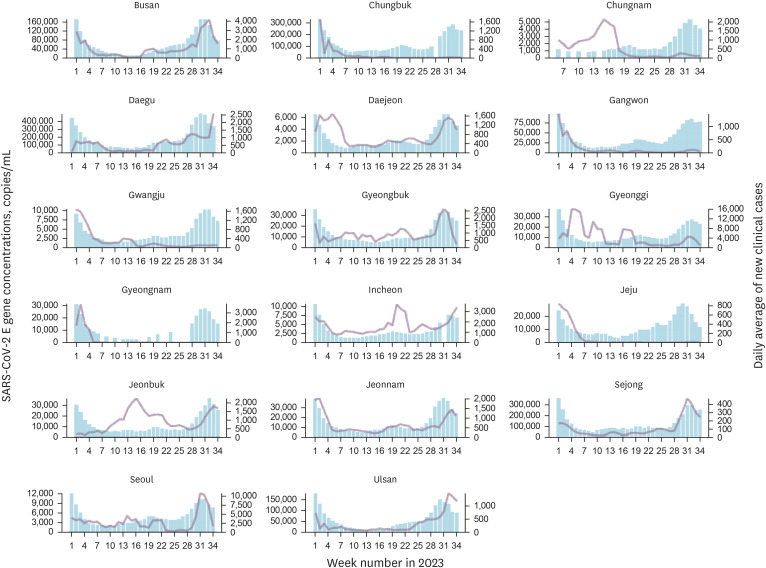
Results: During 34 weeks, the concentration of SARS-CoV-2 in wastewater samples closely mirrored the trends in new COVID-19 cases, showing the effectiveness of WS in detecting the presence of the virus. However, the efficacy of the WS method varied between provinces. Although some provinces showed a significant positive correlation between new COVID-19 cases and SARS-CoV-2 E gene concentrations in wastewater, this correlation was inconsistent between all locations. However, when data were analyzed on a broader regional scale, defined as a grouping of multiple provinces, a higher proportion of regions showed significant correlations. This suggests that analyzing WS data on a broader scale, with larger aggregated populations and higher coverage rates, reduces the influence of local variabilities, such as the proportion of combined sewer types, WWTPs coverage rate, and foot traffic, which may affect alignment at the provincial level.

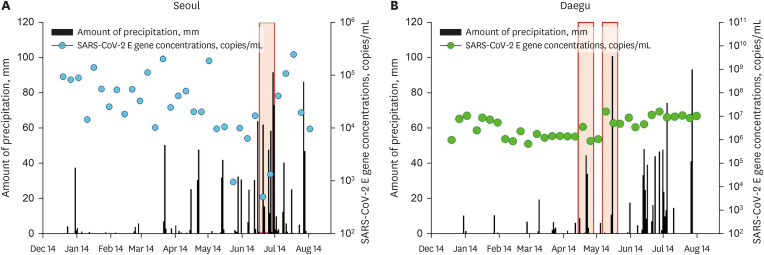
Conclusion: The synchrony between trends in SARS-CoV-2 E gene concentrations in wastewater and new COVID-19 cases highlights the effectiveness of KOWAS in tracking new clinical cases. However, measured SARS-CoV-2 RNA concentrations can be affected by socioenvironmental factors (e.g., WWTP treatment capacity, sewer pipeline distances, and coverage populations). Further refinement will involve expanding the surveillance network to include additional WWTPs and a more comprehensive range of monitoring targets.

Keywords: COVID-19; KOWAS; Republic of Korea; SARS-CoV-2; Wastewater Surveillance.


Conflict of interest statement

The authors have no potential conflicts of interest to disclose.

Figures

Fig. 1
Fig. 1. Sampling locations of the nationwide severe acute respiratory syndrome coronavirus 2 surveillance study in wastewater in the Republic of Korea. A total of 62 wastewater treatment plants were selected from 17 provinces based on treatment capacity and catchment population.
Fig. 2
Fig. 2. Cross-correlation between the right-aligned 3-week moving average of severe acute respiratory syndrome coronavirus 2 E gene concentrations in wastewater and coronavirus disease 2019 cases in lag times (weeks).
Fig. 3
Fig. 3. Nationwide SARS-CoV-2 concentrations in wastewater correlate with new clinical cases. (A) Number of daily averages of new coronavirus disease 2019 patients by week (blue bars) and 3-week moving average of SARS-CoV-2 E gene concentrations in wastewater (purple line); (B) 3-week moving average of viral concentrations correlated with daily new cases. The solid red line is the linear regression fitting. Gray area: 95% confidence interval from the standard error of the fitting. Pearson’s r = 0.85.
SARS-CoV-2 = severe acute respiratory syndrome coronavirus 2.
Fig. 4
Fig. 4. Weekly trends of SARS-CoV-2 E gene concentrations in wastewater and new COVID-19 cases by province in 2023. Number of daily averages of new COVID-19 patients by week (blue bars) and 3-week moving average of SARS-CoV-2 E gene concentrations in wastewater (purple line). Missing bars indicate weeks in which wastewater samples were not collected.
SARS-CoV-2 = severe acute respiratory syndrome coronavirus 2, COVID-19 = coronavirus disease 2019.
Fig. 5
Fig. 5. Weekly trends of SARS-CoV-2 E gene concentrations in wastewater and new COVID-19 cases by region in 2023. Number of daily averages of new COVID-19 patients by week (blue bars) and 3-week moving average of SARS-CoV-2 E gene concentrations in wastewater (purple line).
SARS-CoV-2 = severe acute respiratory syndrome coronavirus 2, COVID-19 = coronavirus disease 2019.
Fig. 6
Fig. 6. Impact of precipitation on the detected SARS-CoV-2 E gene concentrations in wastewater for (A) Seoul and (B) Daegu cities. Precipitation data were obtained from a Korea Meteorological Administration Data Service.
SARS-CoV-2 = severe acute respiratory syndrome coronavirus 2.

Similar articles

References

    1. Choe YJ, Kim YK. Coronavirus disease 2019 cases at universities and colleges in Seoul metropolitan area. J Korean Med Sci. 2021;36(45):e302. - PMC - PubMed
    1. Tiwari A, Lipponen A, Hokajärvi AM, Luomala O, Sarekoski A, Rytkönen A, et al. Detection and quantification of SARS-CoV-2 RNA in wastewater influent in relation to reported COVID-19 incidence in Finland. Water Res. 2022;215:118220. - PMC - PubMed
    1. Wu F, Xiao A, Zhang J, Moniz K, Endo N, Armas F, et al. Wastewater surveillance of SARS-CoV-2 across 40 U.S. states from February to June 2020. Water Res. 2021;202:117400. - PMC - PubMed
    1. Kitajima M, Ahmed W, Bibby K, Carducci A, Gerba CP, Hamilton KA, et al. SARS-CoV-2 in wastewater: state of the knowledge and research needs. Sci Total Environ. 2020;739:139076. - PMC - PubMed
    1. Parasa S, Desai M, Thoguluva Chandrasekar V, Patel HK, Kennedy KF, Roesch T, et al. Prevalence of gastrointestinal symptoms and fecal viral shedding in patients with coronavirus disease 2019: a systematic review and meta-analysis. JAMA Netw Open. 2020;3(6):e2011335. - PMC - PubMed

MeSH terms