. 2025 Jul 22;135(19):e187204.
doi: 10.1172/JCI187204. eCollection 2025 Oct 1.

Inverted chimeric RNAi molecules synergistically cotarget MYC and KRAS in KRAS-driven cancers

Affiliations

Inverted chimeric RNAi molecules synergistically cotarget MYC and KRAS in KRAS-driven cancers

Yogitha S Chareddy et al. J Clin Invest. .

Abstract

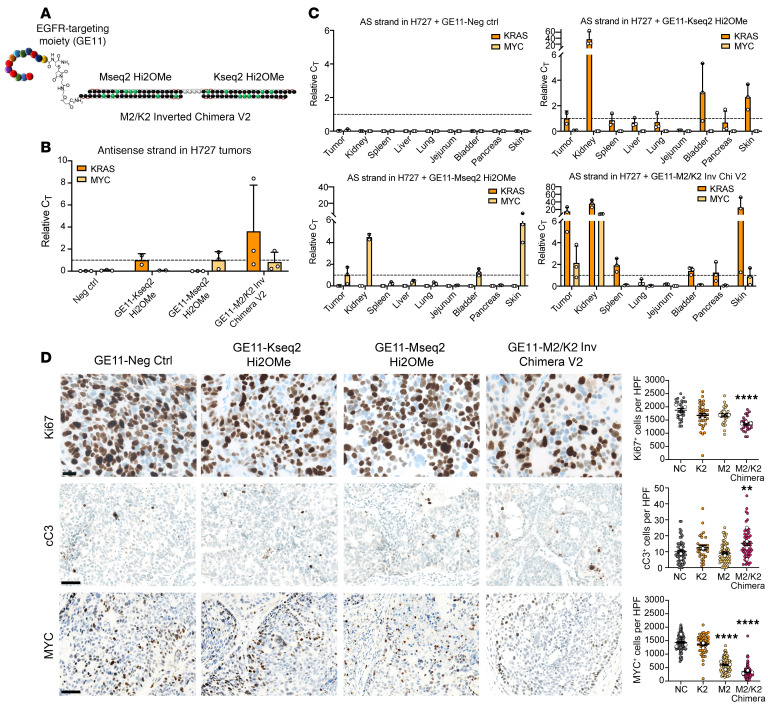
Mutant KRAS has been implicated in driving a quarter of all cancer types. Although inhibition of the KRASG12C mutant protein has shown clinical promise, there is still a need for therapies that overcome resistance and target non-KRASG12C mutations. KRAS activates downstream MYC, which is also a difficult-to-drug oncoprotein. We have developed an "inverted" RNAi molecule with the passenger strand of a MYC-targeting siRNA fused to the guide strand of a KRAS-targeting siRNA. The chimeric molecule simultaneously inhibits KRAS and MYC, showing marked improvements in efficacy beyond the individual siRNA components. This effect is mediated by 5'-dT overhangs following endosomal metabolism. The synergistic RNAi activity led to a more than 10- to 40-fold improvement in inhibition of cancer viability in vitro. When conjugated to an EGFR-targeting ligand, the chimeric siRNA was delivered to and internalized by tumor cells. As compared with individual targeting siRNAs, the chimeric design resulted in considerably improved metabolic stability in tumors, enhanced silencing of both oncogenes, and reduced tumor progression in multiple cancer models. This inverted chimeric design establishes proof of concept for ligand-directed, dual silencing of KRAS and MYC in cancer and constitutes an innovative molecular strategy for cotargeting any two genes of interest, which has broad implications.

Keywords: Drug therapy; Lung cancer; Oncogenes; Oncology; Therapeutics.


Conflict of interest statement

Conflict of interest: CVP, YSC, SHA, MCF, HPH, ME, and AAB hold intellectual property interests based on this work (US patents 10,619,159, 11,180,759, 18/571,985, PCT/US2024/034972, 17/997,398). CVP is founder of EnFuego Therapeutics Inc. and holds equity in the company. HPH and LJS were employees of EnFuego Therapeutics Inc.

Figures

Figure 1
Figure 1. Design and in vitro activity of MYC/KRAS chimeric siRNAs.
(A) Structures of the inverted and serial conformations of a MYC/KRAS cotargeting chimeric siRNA. In the inverted conformation (M2/K2 Inverted Chimera V1), the MYC siRNA passenger (sense, S) strand is linked via a d(T)4 bridge to the KRAS siRNA guide (antisense, AS) strand. In the serial conformation (M2/K2 Serial Chimera V1), the MYC siRNA guide (antisense) strand is linked via a d(T)4 bridge to the KRAS siRNA guide (antisense) strand. (B and C) Relative MYC and KRAS mRNA expression by RT-qPCR after siRNA treatment at 5 and 20 nM for 48–72 hours in A427 and MIA PaCa-2 cells. In conditions with MYC plus KRAS cotransfection, each of the MYC and KRAS siRNAs was transfected at the indicated dose. Data are shown as the mean ± SEM.
Figure 2
Figure 2. Stability of MYC/KRAS chimeric siRNAs in different cellular conditions.
(A) Evaluation of siRNA stability in serum. Ten micromolar of the MYC Hi2F, KRAS Hi2OMe, M2/K2 Inverted Chimera V1 (M2/K2 Inv Chi V1), and M2/K2 Serial Chimera V1 (M2/K2 Ser Chi V1) siRNAs were incubated in 50% FBS for 0, 6, and 24 hours. (B) Evaluation of siRNA stability in tritosomes. Four micromolar of the MYC Hi2F, KRAS Hi2OMe, M2/K2 Inv Chi V1, and M2/K2 Ser Chi V1 siRNAs were incubated in acidified rat liver tritosomes for 0, 6, and 24 hours. (C) Evaluation of siRNA stability in cytosol. Ten micromolar of the MYC Hi2F, KRAS Hi2OMe, M2/K2 Inv Chi V1, and M2/K2 Ser Chi V1 siRNAs were incubated in rat liver cytosol for 0, 6, and 24 hours. (AC) Quantification of relative band intensities is included to the right, which were normalized to the 0 hours time point for each siRNA. Images are representative of experiments conducted 2 times. (D) Schematic of siRNA metabolism following in vivo administration. Created with BioRender.
Figure 3
Figure 3. Characterization of MYC/KRAS chimeric siRNA mechanism of action.
(A) Dose-response curves (left) and relative ED50 values (right, calculated as ED50 of siRNA divided by ED50 of Kseq2 Hi2OMe) of KRAS–firefly luciferase expression in A-431 KRAS-knockout cells treated with the nontargeting negative control (NC) siRNA, MYC Hi2F, KRAS Hi2OMe, M2/K2 Inverted Chimera V1 (M2/K2 Inv Chi V1), and M2/K2 Serial Chimera V1 (M2/K2 Ser Chi V1). All firefly luciferase luminescence values were normalized with Renilla luciferase luminescence and expressed as a percentage. Data are representative of 3 replicates, and error bars represent SEM. (B) Structures of M2/K2 Inverted Chimera V2 with a fully phosphorothioate-modified bridge that renders it uncleavable, and the 4 possible iterations of the metabolized Kseq2 siRNA with 1, 2, 3, or 4 dT overhangs. (C) Dose-response curves (left) and relative ED50 values (right, calculated as ED50 of siRNA divided by ED50 of Kseq2 Hi2OMe) of KRAS–firefly luciferase expression in A-431 KRAS-knockout cells treated with the NC siRNA, M2/K2 Inverted Chimera V2 with a fully phosphorothioate-modified thymidine bridge [M2/K2 Inv Chi V2 (PS bridge)], KRAS Hi2OMe, M2/K2 Inverted Chimera V2 (M2/K2 Inv Chi V2), Kseq2 1dT, Kseq2 2dT, Kseq2 3dT, and Kseq2 4dT. All firefly luciferase luminescence values were normalized with Renilla luciferase luminescence and expressed as a percentage. Data are representative of 2 replicates, and error bars represent SEM.
Figure 4
Figure 4. Model of inverted chimeric siRNA cleavage product within Ago2 complex.
(A) Representation of the active KRAS guide strand with a 2dT 5′-overhang. KRAS guide siRNA carbon atoms are in cyan, dTdT carbon atoms are in light green, carbon atoms of the 5′-terminal U1 of the KRAS guide strand are in yellow, and carbon atoms of amino acids from the Ago2 MID and PIWI domains are in light blue and tan, respectively. (B) Model depicting the KRAS guide strand bound to Ago2 with the protein shown in a surface representation. Ago2 MID and PIWI domain residues are colored in light blue and tan, respectively, the phosphorus atom of the “former” 5′-terminal phosphate lodged at the MID Lys/Arg/Gln/Tyr binding pocket is highlighted in black, and the strand with carbon atoms colored in purple is the targeted KRAS mRNA.
Figure 5
Figure 5. Characterization of MYC/KRAS inverted chimeric siRNA with enhanced 2′OMe chemical modification.
(A) 3D space-filling model of the fully modified M2/K2 Inverted Chimera V2. Carbon atoms of the MYC guide strand are in magenta, and carbon atoms of the passenger strand are in green. Carbon atoms of the KRAS guide strand are in cyan, and carbon atoms of the passenger strand are in gold. The thymidine bridge is shown with carbon atoms in gray, 2′-fluorine atoms are light green, and phosphorothioate sulfur atoms are yellow. (B) Ball-and-stick model showing a portion of the inverted chimeric siRNA, with the KRAS G:P duplex viewed along the helical axis and carbon atoms of the kinked d(T)4 bridge highlighted as gray spheres. The color code is the same as in A. (C) Relative MYC and KRAS expression by RT-qPCR in A427 cells following treatment with the negative control. siRNA, MYC Hi2OMe, KRAS Hi2OMe, and M2/K2 Inverted Chimera V2 at 5 and 10 nM for 72 hours. Error bars represent SEM. (D) KRAS, phospho-ERK1/2, total ERK1/2, phospho-S6, and MYC expression by Western blot in A427 cells following treatment with the negative control siRNA, MYC Hi2OMe, KRAS Hi2OMe, and M2/K2 Inverted Chimera V2 at 5 and 20 nM for 72 hours. Relative expression values are shown below each band for KRAS, phospho-ERK1/2, phospho-S6, and MYC. (E) Representative dose-response curves and ED50 values of KRAS–firefly luciferase expression in A-431 KRAS-knockout cells treated for 4 days with the NC siRNA, MYC Hi2OMe, KRAS Hi2OMe, and M2/K2 Inverted Chimera V2. All firefly luciferase luminescence values were normalized with Renilla luciferase luminescence and expressed as a percentage. Error bars represent SEM. (F) RNA sequencing volcano plots showing all genes upregulated and downregulated in comparison with negative control conditions following treatment of A427 cells with indicated siRNAs at 20 nM for 24 hours.
Figure 6
Figure 6. Effects of M2/K2 inverted chimeric siRNA on cancer cell viability.
(A) Representative dose-response curves and ED50 values for MIA PaCa-2 and A427 cells treated for 6 days with the negative control siRNA, MYC Hi2OMe, KRAS Hi2OMe, and M2/K2 Inverted Chimera V2. ED50 values are shown in nanomolar above the respective bar in the bar graphs on the right. Data are representative of 3 replicates, and error bars represent SEM. (B) Representative images and quantification of spheroids in a tumorigenesis assay in Matrigel with A427 and MIA PaCa-2 cells. Images were taken with a ×5 microscope objective. Scale bars: 498 μm. Error bars represent SEM. One-way ANOVA was used for statistical comparisons. *P < 0.05, **P < 0.01, ***P < 0.001, ****P < 0.0001.
Figure 7
Figure 7. Characterization of receptor-targeting ligand GE11.
(A) Structure of GE11-conjugated M2/K2 Inverted Chimera V2 (at the 3′ end of the guide strand). (B) Relative abundance values of the MYC and KRAS antisense (AS; guide) strands in aggregate tumors of each treatment group. Relative values for the MYC guide strand were normalized to the GE11-MYC siRNA treatment group, and relative values for the KRAS guide strand were normalized to the GE11-KRAS siRNA treatment group. Error bars represent SEM. (C) Relative AS abundance values of the MYC and KRAS guide strands in aggregate tumors, kidneys, spleen, lung, jejunum, bladder, pancreas, and skin of each treatment group. Relative values for the MYC guide strand were normalized to the GE11-MYC siRNA treatment group, and relative values for the KRAS guide strand were normalized to the GE11-KRAS siRNA treatment group. Error bars represent SEM. (D) Left: Representative images of Ki67, cleaved caspase-3 (cC3), and MYC staining in paraffin-embedded sections of H727 tumors treated for 7 days with siRNAs. Ki67 scale bar: 20 μm; cC3 and MYC scale bars: 50 μm. Right: Quantification of the positive cells per high-power field (HPF) in sections of H727. Error bars represent SEM. Unpaired 1-tailed t test corrected for multiple comparisons with the Bonferroni method was used for statistical comparisons. **P < 0.01, ****P < 0.0001.
Figure 8
Figure 8. In vivo activity and efficacy of M2/K2 inverted chimeric siRNA.
(A) Representative dose-response curves for A427 cells treated for 6 days with negative control siRNA, double-control siRNA, Mseq2 Hi2OMe, Kseq2 Hi2OMe, and M2/K2 Inverted Chimera V2. Error bars represent SEM. (B) Tumor growth curves showing average fold change in H727 tumor volume over 15 days (n = 10 for all treatment groups). Error bars represent SEM. Unpaired 1-tailed t test corrected for multiple comparisons using the Bonferroni method was used for statistical comparisons. (C) Tumor growth curves showing average fold change in A427 tumor volume over 21 days (n = 6 for GE11–Neg Ctrl, n = 5 for GE11–Mseq2 Hi2OMe, GE11–Kseq2 Hi2OMe, and GE11–M2/K2 Inverted Chimera V2). Error bars represent SEM. Unpaired 1-tailed t test corrected for multiple comparisons using the Bonferroni method was used for statistical comparisons. (D) Percentage change in A427 tumor volume for each mouse from baseline after 8 days of siRNA treatment. (E) Tumor mass in all treatment groups following cross-sectional necropsy at day 21 (n = 5 for all groups). Error bars represent SEM. Unpaired 1-tailed t test was used for statistical comparisons. (F) Relative abundance values of MYC and KRAS antisense (guide) strands per milligram of tumor of each treatment group. Relative values for MYC guide strand were normalized to the GE11-MYC siRNA treatment group, and relative values for the KRAS guide strand were normalized to the GE11-KRAS siRNA treatment group. Error bars represent SEM. (G) Relative MYC and KRAS mRNA expression in tumors of each treatment group (n = 5 for GE11–Neg Ctrl and GE11–M2/K2 Inverted Chimera V2 groups, n = 4 for GE11-Mseq2 and GE11-Kseq2 groups). Error bars represent SEM. Unpaired 1-tailed t test corrected for multiple comparisons using the Bonferroni method was used for statistical comparisons. *P < 0.05, **P < 0.01, ***P < 0.001, ****P < 0.0001.
Figure 9
Figure 9. Long-term in vivo efficacy of M2/K2 inverted chimeric siRNA.
(A) Tumor growth curves showing average fold change in H358 tumor volume over 42 days (n = 7–10 for all treatment groups). After 28 days, measurements were taken weekly. Error bars represent SEM. (B) Percentage change in H358 tumor volume for each mouse from baseline after 7 days of siRNA treatment. (C) Percentage change in H358 tumor volume for each mouse from baseline after 18 days of siRNA treatment. (B and C) Two-tailed Fisher’s exact test corrected for multiple hypothesis testing using the Bonferroni method was used for statistical comparisons. **P < 0.01, ***P < 0.001. (D) Spider plots of fold changes in H358 tumor volume for every mouse in each treatment group over 28 days. (E) KRAS, MYC, phospho-ERK1/2, total ERK1/2, phospho-YAPS127, and total YAP by Western blot in H358 tumors following treatment with GE11-conjugated negative control siRNA, MYC Hi2OMe, KRAS Hi2OMe, and M2/K2 Inverted Chimera V2. Tumors are ordered by responsiveness to treatment within each group, with strong responders at the beginning and resistant tumors at the end. Band intensities were quantified with Image Lab, (Bio-Rad) and relative band intensities (graph to the right) were calculated in comparison with negative control siRNA–treated tumors after normalization to cyclophilin B. Error bars represent SEM. Two-tailed Mann-Whitney test corrected for multiple comparisons using the Bonferroni method was used for statistical comparisons. *P < 0.05, **P < 0.01.

References

    1. Mustachio LM, et al. Targeting KRAS in cancer: promising therapeutic strategies. Cancers (Basel) 2021;13(6):1204. doi: 10.3390/cancers13061204. - DOI - PMC - PubMed
    1. Friday BB, Adjei AA. K-ras as a target for cancer therapy. Biochim Biophys Acta. 2005;1756(2):127–144. doi: 10.1016/j.bbcan.2005.08.001. - DOI - PubMed
    1. Waters AM, Der CJ. KRAS: the critical driver and therapeutic target for pancreatic cancer. Cold Spring Harb Perspect Med. 2018;8(9):a031435. doi: 10.1101/cshperspect.a031435. - DOI - PMC - PubMed
    1. Dang CV, et al. Drugging the ‘undruggable’ cancer targets. Nat Rev Cancer. 2017;17(8):502–508. doi: 10.1038/nrc.2017.36. - DOI - PMC - PubMed
    1. Verdine GL, Walensky LD. The challenge of drugging undruggable targets in cancer: lessons learned from targeting BCL-2 family members. Clin Cancer Res. 2007;13(24):7264–7270. doi: 10.1158/1078-0432.CCR-07-2184. - DOI - PubMed

MeSH terms