. 2025 Aug 5;135(19):e181975.
doi: 10.1172/JCI181975. eCollection 2025 Oct 1.

BRD4 inhibition leads to MDSC apoptosis and enhances checkpoint blockade therapy

Affiliations

BRD4 inhibition leads to MDSC apoptosis and enhances checkpoint blockade therapy

Himanshu Savardekar et al. J Clin Invest. .

Abstract

BRD4 is an epigenetic reader protein that regulates oncogenes such as myc in cancer. However, its additional role in shaping immune responses via regulation of inflammatory and myeloid cell responses is not yet fully understood. This work further characterized the multifaceted role of BRD4 in antitumor immunity. Nanostring gene expression analysis of EMT6 tumors treated with a BRD4 inhibitor identified a reduction in myeloid gene expression signatures. Additionally, BRD4 inhibition significantly reduced myeloid-derived suppressor cells (MDSCs) in the spleens and tumors of mice in multiple tumor models and also decreased the release of tumor-derived MDSC growth and chemotactic factors. Pharmacologic inhibition of BRD4 in MDSCs induced apoptosis and modulated expression of apoptosis regulatory proteins. A BRD4 myeloid-specific knockout model suggested that the dominant mechanism of MDSC reduction after BRD4 inhibition was primarily through a direct effect on MDSCs. BRD4 inhibition enhanced anti-PD-L1 therapy in the EMT6, 4T1, and Lewis lung carcinoma tumor models, and the efficacy of the combination treatment was dependent on CD8+ T cells and on BRD4 expression in the myeloid compartment. These results identify BRD4 as a regulator of MDSC survival and provide evidence to further investigate BRD4 inhibitors in combination with immune-based therapies.

Keywords: Apoptosis; Cancer; Cancer immunotherapy; Immunology; Oncology.


Figures
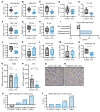
Figure 1
Figure 1. Nanostring pan-cancer immune profiling identifies reduced myeloid cell infiltration of EMT6 tumors treated with PLX51107.
(AH) BALB/c mice were inoculated with 1 × 10⁶ EMT6 cells and treated with vehicle (control) or 20 mg/kg PLX51107 (PLX) daily p.o. once tumors were palpable (50 mm3). After 1 week of treatment, RNA was extracted from whole tumors. Gene expression was then analyzed using the nCounter PanCancer Immune Profiling Panel. Raw cell abundance scores for indicated cell types are displayed on a logarithmic scale. A difference in the mean raw abundance score of 1 between control and PLX51107 treatments indicates a 2-fold difference. ANOVA models and t statistics were used for the comparison of cell type scores (log2) between control and PLX51107. (I) Pan-cancer BRD4 tumor gene expression association with gene signatures of suppressive cell types. Expression signatures were part of the TIDE algorithm. z > 0 represents a positive association. (JN) BALB/c mice were inoculated with 1 × 10⁵ 4T1 cells and treated with vehicle (control) or 20 mg/kg PLX51107 daily p.o. once tumors were palpable (50 mm3). After 8 days of treatment, tumors were processed into single-cell suspensions and stained with fluorescent antibodies. Cell populations were acquired by spectral flow cytometry, unmixed on the Cytek Aurora 5L cytometer, and processed using the OMIQ software platform. (O and P) EMT6 tumors from mice treated as in A were fixed and stained with an antibody against F4/80 (O) or GR1 (P) and visualized using an HRP-conjugated secondary antibody. ImageJ software was used to count HRP+ cells from 5 high-powered fields per slide to obtain an average number of positive cells. The bar graph represents the mean ± SEM of GR1+ cells from 6 slides per treatment group; P < 0.05 (unpaired 2-tailed Student’s t test). (Q and R) Representative images of GR1+ cells labeled with black arrows in tumors of control (P) or PLX51107-treated (O) EMT6 tumor–bearing mice. Scale bar: 20 μm. (S and T) TIMER2 analysis of tumor BRD4 expression (S) or tumor MDSC gene signature expression (T) in The Cancer Genome Atlas breast cancer patients at different stages (n = 1,100). Values on the bar graph are z scores with the Cox proportional hazard model to evaluate significance. z > 0 indicates a positive association. MDSC gene signature expression was quantified using the TIDE algorithm.
Figure 2
Figure 2. PLX51107 reduces MDSCs in vivo.
(AD) The 4T1 tumor–bearing mice were treated with vehicle (control) or 20 mg/kg PLX51107 (PLX) daily once tumors reached 50 mm3 for 9 days. Absolute MDSC count was calculated by multiplying total splenocyte number (counted using a Z-Series Coulter Counter) by MDSC frequency as measured by flow cytometry. (A) Values represent mean ± SEM of absolute MDSC count (n = 5); P < 0.001, unpaired 2-tailed Student’s t test. (B and C) Values represent mean ± SEM of frequency of CD45+/GR1+/CD11b+ MDSCs in (B) tumor and (C) spleen (n = 5); P < 0.01 and P < 0.001 for MDSCs within the tumor and spleen, respectively (unpaired 2-tailed Student’s t test). (D) Representative flow cytometry plots of MDSCs in the spleen. (EH) EMT6 tumor–bearing mice were treated as in A. (E) Values represent mean ± SEM of MDSC counts (n = 5); P < 0.0001, unpaired 2-tailed Student’s t test. (F and G) Values represent mean ± SEM of frequency of MDSCs in (F) tumor and (G) spleen (n = 10); P < 0.05 and P < 0.01 for MDSCs within the tumor and spleen, respectively, unpaired 2-tailed Student’s t test. (H) Representative flow cytometry plots of MDSCs in the spleen. (IK) C26 tumor–bearing mice were treated as in A. (I) Values represent mean ± SEM of splenic MDSC counts (n = 4–5); P < 0.001, unpaired 2-tailed Student’s t test. (J and K) Frequency of MDSCs of C26 in tumor (J) and spleen (K). Values represent mean ± SEM of frequency of MDSCs (n = 4–5); P = 0.057 and P < 0.001 for MDSCs within the tumor and spleen, respectively, unpaired 2-tailed Student’s t test. (L) LLC tumor–bearing mice treated as in A. Values represent mean ± SEM of splenic MDSC counts (n = 8); P < 0.01, unpaired 2-tailed Student’s t test. (M and N) CD34+ HSC-engrafted NSG-SGM3 mice were co-engrafted with the melanoma PDX tumor model and treated as in A for 15 days. Values represent mean ± SEM of splenic MDSCs (CD11b+/CD33+/HLA-DRlo/–) for each donor (n = 3/donor); P < 0.05, unpaired 2-tailed Student’s t test. (O) Representative flow cytometry plots in M and N.
Figure 3
Figure 3. Loss of BRD4 in the myeloid compartment results in decreased MDSC frequency.
(A) Genotyping of Brd4fl/fl LysM-Cre mice. Presence of BRD4fl/fl allele at 1.1 kB and WT allele at 1.0 kB. (B) Presence of mutant Cre expression of BRD4fl/fl mice at 700 bp (Cre+) and WT Cre allele at 350 bp (Cre). (C) Immunoblot of BRD4 expression in splenic MDSCs of Brd4fl/fl LysM-Cre+ (BRD4 cKO) and littermate control (BRD4 WT) mice implanted with LLC tumors. (D) BRD4 cKO and WT mice inoculated with 1 × 10⁶ LCC cells subcutaneously and treated with the vehicle control or 20 mg/kg PLX51107 daily via oral gavage once tumors were palpable (50 mm3) for 8 days. Tumor volumes were measured 3 times weekly with digital calipers. Values are the mean ± SEM of tumor volumes at each time point (n = 8–11); P > 0.05 for all groups, linear mixed model with Tukey-Kramer adjustment. (E) Absolute total MDSC (CD11b+/GR1+) count within the spleen of BRD4 WT and BRD4 cKO LLC tumor–bearing mice treated with the vehicle control or 20 mg/kg PLX51107 (PLX). Absolute MDSC counts were calculated as above. Values represent mean ± SEM from 8–10 mice per treatment group. One-way ANOVA model with Tukey’s correction. (F and G) Absolute counts of MDSC subsets (F; PMN-MDSC) and (G; M-MDSC) within the spleen of BRD4 WT and BRD4 cKO LLC tumor–bearing mice on day 16 after tumor implantation. Absolute MDSC counts were calculated as in Figure 1A. Values represent mean ± SEM from 9–10 mice; P < 0.05, unpaired 2-tailed Student’s t test. (H and I) Frequency of PMN-MDSCs (CD11b+, Ly6G+, Ly6Cmid) and M-MDSCs (CD11b+, Ly6, Ly6Chi) within LLC tumors (day 16) of BRD4 WT or BRD4 cKO mice as measured by flow cytometry. Values represent mean ± SEM from 6–8 mice per group; P < 0.01 for PMN-MDSCs, unpaired 2-tailed Student’s t test.
Figure 4
Figure 4. PLX51107 induces MDSC apoptosis.
(A) Values represent the mean ± SEM of annexin V+ MSC2 cells treated as indicated for 24 h (n = 3); P < 0.01 for DMSO versus 500 nM PLX51107 (PLX), P < 0.01 for 500 nM PLX51107 versus 500 nM PLX51107 + 25 μM Z-VAD-FMK, 2-way ANOVA model with Tukey’s correction. (B) Representative flow cytometry plot of staining from A. Annexin V+ and propidium iodide negative early apoptosis of PLX51107-treated cells is demonstrated. (C) Murine splenic MDSCs isolated from 4T1 tumor–bearing mice treated ex vivo with media supplemented with 10 ng/mL IL-6 and GM-CSF for 48 h. Values represent the mean ± SEM of annexin V+ murine splenic MDSCs treated as indicated (n = 3); P < 0.01 for DMSO versus 500 nM PLX51107, unpaired 2-tailed Student’s t test. (D) Representative flow cytometry plot of staining from C. (E) 4T1 tumor–bearing mice were treated with control or PLX51107 (20 mg/kg) for 7 days. Splenocytes were isolated and stained for MDSCs (GR1+/CD11b+) and annexin V. Values represent fold increase of annexin V+ MDSCs in mice receiving PLX51107 compared with mice receiving control (n = 5); P < 0.01, unpaired 2-tailed Student’s t test. (F and G) CD33+/CD11b+/HLA-DRlo/– MDSCs were isolated from the peripheral blood of patients with melanoma (F) or bladder cancer (G) by FACS. Cells were cultured in human AB serum media supplemented with 10 ng/mL IL-6 and GM-CSF and treated with DMSO or 250 nM PLX51107 for 48 h. Values represent mean ± SEM of annexin V+ cells from experiments; P < 0.0001 for DMSO versus 250 nM PLX51107 in F (n = 7), and P < 0.01 for DMSO versus 250 nM PLX51107 in G (n = 3), paired 2-tailed Student’s t test. (H) Values represent mean ± SEM of cleaved caspase-3+ melanoma patient MDSCs isolated as in F and treated as indicated for 48 h (n = 3); P < 0.0001 for DMSO versus 250 nM PLX51107 and 250 nM PLX51107 versus 250 nM PLX51107 + 25 μM Z-VAD-FMK, 2-way ANOVA model with Tukey’s correction. (I) Representative flow cytometry plot of staining from H.
Figure 5
Figure 5. PLX51107 modulates apoptotic proteins in MDSCs.
(A) MSC2 cells treated for 24 h with DMSO control or indicated dose of PLX51107 (PLX). Protein lysates of treated cells were probed with antibodies for caspase-9, cleaved caspase-9, caspase-8, cleaved caspase-8, and β-actin. (B) Single-cell RNA-Seq dataset of peripheral blood mononuclear cells of 16 patients at baseline. Dot plot of relative gene expression of select apoptosis genes across all cell types. (C) MSC2 cells treated as in A and probed for BCL2A1, MCL1, XIAP, and β-actin. (D) Splenic murine MDSCs were isolated from 4T1 tumor–bearing mice and treated for 48 h with DMSO control or the indicated dose of PLX51107 with media supplemented with 10 ng/mL IL-6 and GM-CSF. Relative gene expression of Bcl2a1a across treatment groups normalized to β-actin; P < 0.05 DMSO versus 250 nM PLX51107, paired 2-tailed Student’s t test. (E) Splenic murine MDSCs from 4T1 tumor–bearing mice treated as in D. Protein lysates from each condition probed with BCL2A1 or β-actin. (F) CD33+/CD11b+/HLA-DRlo/– MDSCs were isolated from the peripheral blood of patients with melanoma by FACS. Cells were cultured in HAB media supplemented with 10 ng/mL IL-6 and GM-CSF and treated with DMSO or the indicated concentration of PLX51107. After 48 h, RNA was isolated from cells, and relative gene expression of BCL2A1 across treatment groups was normalized to 18S; P < 0.05 for DMSO versus 250 nM PLX51107, paired 2-tailed Student’s t test. (G) MSC2 cells treated as in A and probed for BIM. (H) Splenic murine MDSCs for 4T1 tumor–bearing mice treated as in D and probed for BIM. (I) Relative gene expression of BIMEL in human MDSCs treated as in F across treatment groups normalized to 18S; P < 0.05 for DMSO versus 250 nM PLX51107, paired 2-tailed Student’s t test. (J) Gr1+/CD11b+ MDSCs were isolated from spleens of 4T1 tumor–bearing female mice by negative selection and treated with DMSO vehicle control (blue) or 125 nM PLX51107 (red) for 24 h. BRD4 enrichment was assayed by ChIP-Seq using input control. Control and inhibitor groups were normalized by Drosophila chromatin spike-in. Track heights indicate relative enrichment, and each group represents pooled cells from 3–4 mice. H3K27ac (gray) enrichment was determined from a public dataset (38).
Figure 6
Figure 6. PLX51107 enhances the efficacy of anti–PD-L1 immune checkpoint therapy.
(A and B) Frequency of intratumoral CD45+CD3+CD25+ (A) and CD45+CD3+CD69+ cells (B) analyzed by flow cytometry in EMT6 tumor–bearing mice treated for 1 week with control or PLX51107 (PLX). Values represent mean ± SEM; CD25: P < 0.01, n = 8–9 and CD69: P < 0.05, n = 5, unpaired 2-tailed Student’s t test. (C) EMT6 tumor–bearing mice were treated with control (vehicle and IgG), 20 mg/kg PLX51107 daily, 100 μg anti–PD-L1 3 times a week, or PLX51107 + anti–PD-L1. Tumor volumes were measured 3 times a week with digital calipers. Values are the mean ± SEM of tumor volumes at each time point (n = 5); P < 0.01 for combination versus PLX51107 and combination versus anti–PD-L1 (linear mixed model with Tukey-Kramer adjustment). (D) EMT6 tumor–bearing mice were treated as in C. Treatment was administered for 60 days or until institutional removal criteria were met, at which point treatment was stopped. Survival analyzed by 1-way ANOVA with Tukey’s correction; P < 0.05, n = 11. Long-term treatment did not elicit discernible toxicity. (EG) The 4T1 tumor–bearing mice were treated as described in A. Values represent mean ± SEM of tumor volumes at each time point. Combination versus PLX51107 and combination versus anti–PD-L1; P < 0.01, linear mixed model with Tukey-Kramer adjustment. (F) Spider plot of tumor growth curves in E. (G) Images of 4T1 tumors at day 16. (H) 4T1 tumors were processed into single-cell suspensions. Values represent mean ± SEM of GR1+/CD11b+ MDSCs within the CD45+ population; P < 0.001 for control versus PLX51107, and P = 0.012 for anti–PD-L1 versus combination (Combo) treatment (1-way ANOVA with Tukey’s correction). (I) The 4T1 tumor–bearing mice were treated with control (vehicle and IgG), 20 mg/kg PLX51107 daily, 200 μg anti–LAG-3 3 times a week, or PLX51107 + anti–LAG-3. Tumor volumes were measured as in C. Values represent mean ± SEM of tumor volumes at each time point. Combination versus PLX51107: P < 0.05, n = 5; combination versus anti–LAG-3: P < 0.05, n = 5, linear mixed model with Tukey-Kramer adjustment, test results averaged over all days. *P < 0.05 and **P < 0.01.
Figure 7
Figure 7. Immune checkpoint therapy enhancement by PLX51107 is dependent on myeloid BRD4 expression and CD8+ T cells.
(A) LLC tumor–bearing mice were treated as described in Figure 6. Tumor volumes were measured 3 times a week with digital calipers. Values are the mean ± SEM of tumor volumes at each time point (n = 5); P < 0.01 for combination versus PLX51107 (PLX) and combination versus anti–PD-L1, linear mixed model with Tukey-Kramer adjustment, test results averaged over all days. (B) LLC tumor–bearing BRD4 WT or BRD4 cKO mice (100 mm3) received 100 μg of IgG or anti–PD-L1 on days 1, 3, and 6. Values represent mean ± SEM of tumor volumes at each time point, WT + anti-PDL1 versus cKO + anti–PD-L1 (n = 3); P < 0.05, linear mixed model with Tukey-Kramer adjustment). (C) LLC tumor–bearing BRD4 WT or BRD4 cKO mice (100 mm3) received 100 μg of IgG or anti–PD-L1 on days 1, 3, and 6. PLX51107 (20 mg/kg) or control was administered daily for 6 days. Values represent mean ± SEM of tumor volumes at each time point; WT + anti–PD-L1 versus WT + combination (n = 5), P < 0.000, linear mixed model with Tukey-Kramer adjustment. (DF) EMT6 tumor–bearing mice received 200 μg of IgG or CD8 depletion antibody on day 7 and 100 μg of IgG or CD8 depletion antibody on days 10 and 14. On day 10, mice were treated with control (vehicle and IgG), 20 mg/kg PLX51107 daily, 100 μg anti-PDL1 Monday, Wednesday, and Friday, or a combination of PLX51107 and anti–PD-L1. Tumor volumes were measured 3 times weekly with digital calipers. (D) Values represent mean ± SEM of tumor volumes at each time point. Control versus combination (n = 7); P < 0.0001, combination versus combination + CD8+ depletion antibody (n = 6–8), P < 0.000, linear mixed model with Tukey-Kramer adjustment. (E) Tumor images at day 16. (F) CD3+CD8+ T cells were measured in the spleen by flow cytometry from Figure 7D. Values represent mean ± SEM of percent CD3+/CD8+ double-positive splenocytes. Combination versus combination + CD8+ depletion antibody (n = 6–8); P < 0.0001, 1-way ANOVA with Tukey’s correction. *P < 0.05, **P < 0.01, and ****P < 0.0001.

References

    1. Stathis A, Bertoni F. BET proteins as targets for anticancer treatment. Cancer Discov. 2018;8(1):24–36. doi: 10.1158/2159-8290.CD-17-0605. - DOI - PubMed
    1. Zuber J, et al. RNAi screen identifies Brd4 as a therapeutic target in acute myeloid leukaemia. Nature. 2011;478(7370):524–528. doi: 10.1038/nature10334. - DOI - PMC - PubMed
    1. Filippakopoulos P, et al. Selective inhibition of BET bromodomains. Nature. 2010;468(7327):1067–1073. doi: 10.1038/nature09504. - DOI - PMC - PubMed
    1. Zhong L, et al. Bromodomain 4 is a potent prognostic marker associated with immune cell infiltration in breast cancer. Basic Clin Pharmacol Toxicol. 2021;128(1):169–182. doi: 10.1111/bcpt.13481. - DOI - PubMed
    1. Tasdemir N, et al. BRD4 connects enhancer remodeling to senescence immune surveillance. Cancer Discov. 2016;6(6):612–629. doi: 10.1158/2159-8290.CD-16-0217. - DOI - PMC - PubMed

MeSH terms