. 2025 Sep;24(9):e70165.
doi: 10.1111/acel.70165. Epub 2025 Aug 5.

Aging Adipose-Derived Mesenchymal Stem Cells, Cultured on a Native Young Extracellular Matrix, Are Protected From Senescence and Apoptosis Along With Increased Expression of HLA-DR and CD74 Associated With PI3K Signaling

Affiliations

Aging Adipose-Derived Mesenchymal Stem Cells, Cultured on a Native Young Extracellular Matrix, Are Protected From Senescence and Apoptosis Along With Increased Expression of HLA-DR and CD74 Associated With PI3K Signaling

Aaron O Gonzalez et al. Aging Cell. 2025 Sep.

Abstract

Older adults are the primary population for cell-based therapies for age-related diseases, but the efficacy of administering autologous mesenchymal stem cells (MSCs) is impaired due to biological aging. In the present study, we cultured aging adipose (AD)-derived MSCs from > 65-year-old donors on extracellular matrix (ECM) synthesized by human amniotic fluid-derived pluripotent stem cells (ECM Plus) versus tissue culture plastic (TCP) and hypothesized that ECM Plus provided an ideal "young" microenvironment for reactivating and preserving early-stage progenitor cells within aging AD-MSCs. To test our hypothesis, we serially sub-cultured aging AD-MSCs on ECM Plus or TCP and characterized the cells both phenotypically and functionally, and then analyzed the cells at the single-cell transcriptomic level for the mechanisms that control cell fate. The results showed that the maintenance of aging AD-MSCs on ECM Plus significantly restored their quantity and quality. The mechanisms responsible for these effects were associated with a remarkable up-regulation of intracellular CD74 when cells were maintained on ECM Plus compared to TCP, which triggered activation of the phosphoinositide-3-kinase (PI3K) pathway as a key modulator of cell survival (anti-apoptosis) and suppression of cellular senescence. Moreover, AD-MSCs maintained on ECM Plus increased their expression of HLA-DR and stimulated T cell activity. These findings challenge the "immune privilege" of allogeneic MSCs as a universal source for MSC-based therapies. The present study leads to a new paradigm for treating age-related diseases: serial administration of rejuvenated autologous MSCs, which may not only replace aged MSCs but also gradually reverse the aged microenvironment.

Keywords: CD74; MHC class II; aged MSCs; autologous stem cell therapies; immunogenicity; young microenvironment.


Conflict of interest statement

Dr. Chen is a Board member and shareholder in StemBioSys Inc. (San Antonio, TX). All other authors have no financial or competing interests to declare.

Figures
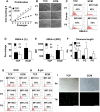
FIGURE 1
FIGURE 1
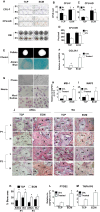
The quantity and quality of aging AD‐MSCs is improved with maintenance on ECM Plus (ECM) as compared to TCP. (A) Cell proliferation, based on the number of cell population doublings with each passage (7 days/passage), was enhanced with culture on ECM; maintenance on ECM for 7 passages resulted in ~1 × 106‐fold greater number of cells than culture on TCP for the same number of passages. *p < 0.05 (n = 3), versus TCP at the same passage. (B) Cells sub‐cultured (7 days/passage) on TCP or ECM were viewed under phase contrast microscopy at the end of each passage (P1, P3, and P5) and photomicrographs prepared. Scale bar: 200 μm. (C) Flow cytometric analysis of SSEA‐4 expression was performed on cells after sub‐culture on TCP or ECM. P1 and P5: Passage 1 and 5, respectively; and MFI: Median fluorescence intensity. (D) Quantification of percent SSEA‐4 positive cells. *p < 0.05 (n = 3), versus TCP at the same passage. (E) Quantification of the mean fluorescence intensity (MFI) of SSEA‐4 positive cells. *p < 0.05 (n = 3), vs. TCP at the same passage. (F) Change in telomere length (Kb) with serial sub‐culture on TCP or ECM (P1, P3, and P5) was measured to assess cell quality. *p < 0.05 (n = 3), versus TCP at the same passage; and Ɨ p < 0.05 (n = 3), versus TCP at P3 and P5. (G) Flow cytometric analysis for production of reactive oxygen species (ROS), shown as a percentage (%) and MFI of positive cells, was performed on cells after sub‐culture (P1, P3, and P5) on TCP or ECM. (H) Flow cytometric analysis for β‐galactosidase (β‐gal) activity, shown as a percentage (%) and MFI of positive cells, was performed on cells after sub‐culture on TCP or ECM (P1, P3, and P5). (I) Apoptosis detected by TUNEL assay. Aging AD‐MSCs (P1) were cultured on TCP or ECM for 7 days and stained with TUNEL. Apoptotic cells (stained green) were more abundant on TCP (27% ± 9%) than ECM (6% ± 2%) and the increase on TCP was statistically significant (p < 0.01, n = 5). Ph: Phase contrast; TN: TUNEL‐fluorescence. Scale bar: 100 μm.
FIGURE 2
FIGURE 2
Differentiation capacity of aging AD‐MSCs is enhanced with maintenance on ECM Plus (ECM) as compared to TCP. (A) Formation of colony‐forming units (CFUs) was enhanced when cells were pre‐cultured on ECM as compared to TCP (P1 and P3). CFU‐fibroblasts (CFU‐F) were stained with crystal violet (blue); CFU‐adipocytes (CFU‐AD) were stained with Oil Red O (red); and CFU‐osteoblasts (CFU‐OB) were stained with von Kossa. (B–D) CFU quantification was performed by counting the number of colonies/well (CFU#/well) or pixels per 10 cm2 well. *p < 0.05 (n = 3), versus TCP at the same passage. (E, F) Generation of cartilage was enhanced when cells were pre‐cultured on ECM as compared to TCP. Transverse sections of cartilage pellets, stained with Alcian Blue, clearly demonstrated the presence of mucins and proteoglycans. In addition, the expression of type II collagen (COL2A1), a major collagenous protein of cartilage, was also significantly increased by pre‐culture on ECM. *p < 0.05 (n = 3), versus TCP group treated with chondrogenic media. (G–I) Neurogenesis was enhanced when the cells were pre‐cultured on ECM as compared to TCP. After overnight incubation in neurogenic induction media, a marked morphological difference between cells pre‐cultured on ECM versus TCP could be seen under phase contrast microscopy. Moreover, neuron‐specific Nissl body staining was observed and transcripts for neurogenic markers, musashi1 (Msi1) and microtubule associated protein 2 (MAP2) were increased. *p < 0.05 (n = 3), versus TCP group treated with neurogenic media. (J) In vivo bone formation capacity of cells pre‐cultured on ECM was enhanced compared to TCP (P1 or P3). Following each passage, aging AD‐MSCs (ASCs) or Wharton Jelly (WJ) cells pre‐cultured on TCP or ECM (1 × 106 cells) were loaded onto HA/TCP particles and implanted subcutaneously into the dorsal surface of 10‐week‐old immunodeficient mice. After 8 weeks in vivo, three implants for each group were harvested for histological analysis. B, bone‐like regions; Ft, fat tissue; and HA, HA/TCP. Low (L) magnification: Scale bar: 200 μm. High (H) magnification: Scale bar: 100 μm. (K) Quantification of new bone formation (“% bone area”) was histomorphometrically determined using Image J analysis software. The data shown in the figure represents the mean and standard deviation that was calculated using 9 H&E sections (3 per implant, repeated 3 times to have 3 implants with cells from 3 different donors). *p < 0.05 (n = 9), versus TCP group. (L, M) Trophic factor expression by the cells was increased with maintenance on ECM as compared to TCP. To simulate an inflammatory environment, cells pre‐cultured on ECM or TCP were treated with TNF‐α (20 ng/mL) for 48 h and the expression of prostaglandin‐endoperoxide synthase 2 (PTGS2), which encodes the cyclooxygenase 2 (COX‐2) enzyme, and TNF‐α induced protein 6 (TNFA1P6) was measured by RT‐PCR. *p < 0.05 (n = 3), versus TCP group treated with TNF‐α.
FIGURE 3
FIGURE 3
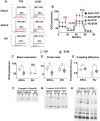
Culture of aging AD‐MSCs on ECM Plus (ECM), but not TCP, produces less ROS by promoting respiratory chain super‐complex assembly and enhanced coupling efficiency. (A) ROS production by aging AD‐MSCs (ASCs, P2, or P3) or WJ cells (< P5) pre‐cultured on ECM or TCP was measured by flow cytometry. ROS production is shown as both the percent positive cells in the population and mean fluorescence intensity (MFI). Two separate donors provided the aging AD‐MSCs (ASCs1 and ASCs2), TCP: 91% ± 9% versus ECM: 58% ± 12% (p < 0.05, n = 6); TCP: 3730 ± 340 MFI versus ECM: 1150 ± 459 MFI (p < 0.05, n = 6); WJ cells were used as youthful (young) control cells, TCP: 75% ± 7% vs. ECM: 80% ± 5% (not significantly different); TCP: 3542 ± 256 MFI vs. ECM:1752 ± 270 MFI (p < 0.05, n = 3). (B–E) Seahorse analysis. Cells pre‐cultured on TCP (ASCs/TCP or WJ/TCP) or ECM (ASCs/ECM or WJ/ECM) were plated at 40,000 cells per well in an XF96 cell culture microplate (Seahorse Bioscience) for the Seahorse Mito Stress Test, as described in the Methods. Oxygen consumption rate (OCR) was measured at baseline and after sequential administration of oligomycin (OG) (2.0 μM), FCCP (1.0 μM) and rotenone (0.6 μM)/antimycin A (R + A) (0.5 μM). Based on the results, indices of mitochondrial function were calculated and included basal respiration (C), proton leak (D), and coupling efficiency (i.e., oxidative phosphorylation [OXPHOS]) (E). *p < 0.05 (n = 3), for ECM vs. TCP pre‐culture. (F–H) Blue Native Gel (BNG) analysis was used to investigate assembly of the respiratory super‐complex. Mitochondrial protein was extracted from ASC and WJ cells pre‐cultured on ECM (E) or TCP (T), separated using gel electrophoresis, and the protein complexes detected by western blot (Wb) using antibodies against representative subunits of complex I, III, and IV.
FIGURE 4
FIGURE 4
Comparative single cell transcriptomic analysis reveals that the culture of aging AD‐MSCs on ECM Plus (ECM) produces a unique gene expression profile, including the downregulation of pro‐senescent signaling. (A) UMAP (uniform manifold approximation and projection) diagram for cells pre‐cultured on ECM Plus (ECM) versus TCP in regular growth media. (B) Six subpopulations or clusters were identified based on similar functionality or pathway enrichment. Cluster 0 (Cell‐ECM) and cluster 5 (Senescence) were highlighted due to the major shift in cell sub‐population composition between ECM and TCP. (C) Heatmap of senescence‐associated genes within DEGs (differentially expressed genes) by comparing cells cultured on TCP to ECM. A list of the genes displayed in the figure can be found in Table S1 in the Supporting Information. (D) Heatmap of apoptosis‐associated genes within DEGs by comparing cells cultured on TCP to ECM; the figure is enlarged in the Supporting Information (Figure S1) to show the individual genes. (E–H) A small number of DEGs, from 4 different categories (i.e., senescence‐associated markers, differentiation, trophic factors, and immune modulation), were selected as biomarkers of MSC quality. Identity 0–5 (along the x‐axis) refers to the cluster numbers in Figure 4B; pink‐colored violin plots represent the subpopulations cultured on ECM, while the dark green colored violin plots represent the subpopulations cultured on TCP.
FIGURE 5
FIGURE 5
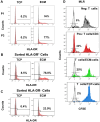
Expression of HLA‐DR on the aging AD‐MSC surface is only observed with culture on ECM Plus (ECM) and stimulates T‐cell proliferation. (A) Flow cytometric analysis of HLA‐DR expression by cells sub‐cultured on TCP or ECM (P1 and P3). (B, C) Aging AD‐MSCs were pre‐cultured on ECM, fractionated (sorted) into HLA‐DR positive (B) and HLA‐DR negative (C) sub‐populations by flow cytometry, and then cultured on TCP or ECM for 7 days. At the end of culture, the percentage of HLA‐DR positive and negative cells was determined by flow cytometric analysis. (D) A mixed lymphocyte reaction (MLR) assay. Aging AD‐MSCs pre‐cultured on TCP (TCP‐cells) or ECM (ECM‐cells) were cocultured with PBMCs pre‐labeled with CFSE. After 5 days of culture, dividing T‐cells were identified by CD4 positive cells with decreased AF488 (CFSE) intensity using flow cytometry.
FIGURE 6
FIGURE 6
Western blot (Wb) analysis confirms the up‐regulation of CD74 and other key differentiation markers and reveals that CD74 is essential for the induction of PI3K signaling and prevention of cell death (i.e., apoptosis). (A) CD74, Runx2, Sox9, and Nestin proteins were produced by cells cultured on ECM Plus (ECM), as compared to TCP, through four serial passages (P1 to P4) in regular growth media. (B) In separate experiments, extracts of cells (from 3 different donors, > 65 years old) that had been pre‐cultured on ECM Plus (ECM), as compared to TCP, were analyzed by Wb analysis for the presence of CD74 and PI3K/AKT proteins. (C) Wb analysis for CD74 and PI3K protein in extracts of cells cultured on ECM Plus (ECM) and treated with siRNA to silence the expression of CD74 or scrambled siRNA (a negative control), as well as cells cultured on TCP (SiCD74/ECM vs. CD74/ECM vs. TCP, respectively). CD74 protein was undetected in CD74 silenced cells cultured on ECM or the naïve cells cultured on TCP, along with less PI3K production, as compared to cells treated with scrambled siRNA and maintained on ECM. Whole blots of panels A–C can be found in the Supporting Information section (Figure S2). (D) TUNEL assay for apoptosis was conducted on the above cells. Calculated percent TUNEL positive for each treatment group: SiCD74/ECM: 34% ± 8%; CD74/ECM: 12% ± 4%; TCP: 31% ± 5%; p < 0.01 (n = 5), CD74/ECM versus SiCD74/ECM or TCP with a one‐way ANOVA. Ph, phase contrast; TN, TUNEL‐fluorescence. Scale bar: 100 μm.

References

    1. Ankrum, J. A. , Ong J. F., and Karp J. M.. 2014. “Mesenchymal Stem Cells: Immune Evasive, Not Immune Privileged.” Nature Biotechnology 32, no. 3: 252–260. 10.1038/nbt.2816. - DOI - PMC - PubMed
    1. Bi, Y. , Stuelten C. H., Kilts T., et al. 2005. “Extracellular Matrix Proteoglycans Control the Fate of Bone Marrow Stromal Cells.” Journal of Biological Chemistry 280, no. 34: 30481–30489. 10.1074/jbc.M500573200. - DOI - PubMed
    1. Block, T. , Creech J., da Rocha A. M., et al. 2020. “Human Perinatal Stem Cell Derived Extracellular Matrix Enables Rapid Maturation of hiPSC‐CM Structural and Functional Phenotypes.” Scientific Reports 10, no. 1: 19071. 10.1038/s41598-020-76052-y. - DOI - PMC - PubMed
    1. Block, T. J. , Marinkovic M., Tran O. N., et al. 2017. “Restoring the Quantity and Quality of Elderly Human Mesenchymal Stem Cells for Autologous Cell‐Based Therapies.” Stem Cell Research & Therapy 8, no. 1: 239. - PMC - PubMed
    1. Bonab, M. M. , Alimoghaddam K., Talebian F., Ghaffari S. H., Ghavamzadeh A., and Nikbin B.. 2006. “Aging of Mesenchymal Stem Cell In Vitro.” BMC Cell Biology 7: 14. 10.1186/1471-2121-7-14. - DOI - PMC - PubMed

MeSH terms

Substances

LinkOut - more resources