. 2025 Aug 18;5(8):101120.
doi: 10.1016/j.crmeth.2025.101120. Epub 2025 Aug 4.

MR1-ligand cross-linking identifies vitamin B6 metabolites as TCR-reactive antigens

Affiliations

MR1-ligand cross-linking identifies vitamin B6 metabolites as TCR-reactive antigens

Thierry Schmidlin et al. Cell Rep Methods. .

Abstract

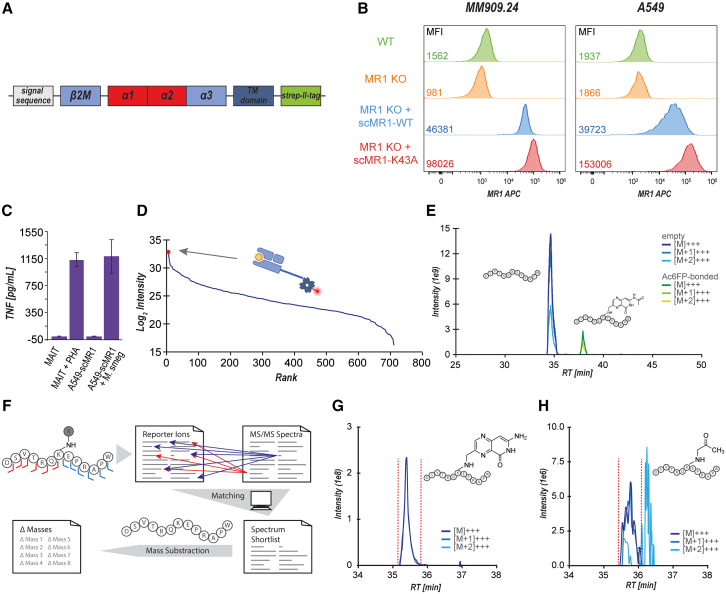
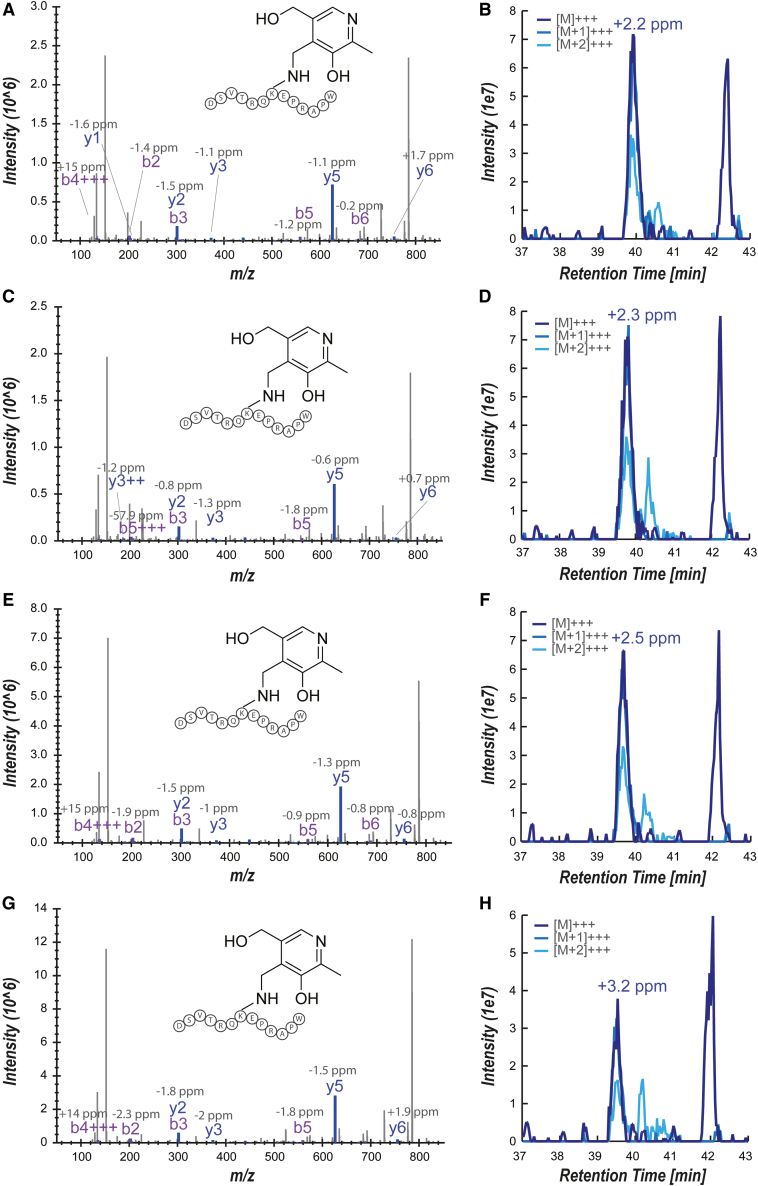
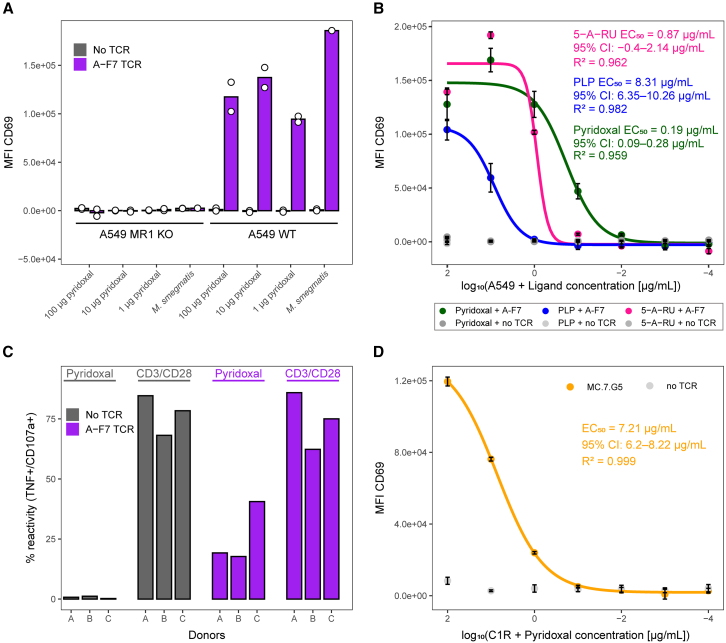
Major histocompatibility complex class I-related protein 1 (MR1) plays a central role in the immune recognition of infected cells and can mediate T cell detection of cancer. Knowledge of the nature of the ligands presented by MR1 is still sparse and has been limited by a lack of efficient approaches for MR1 ligand discovery. Here, we present a cross-linking strategy to investigate Schiff base-bound MR1 ligands. Our methodology employs reductive amination to stabilize the labile Schiff base bond between MR1 and its ligand, allowing for the detection of ligands as covalent MR1 adducts by mass spectrometry-based proteomics. We apply our approach to identifying vitamin B6 vitamers pyridoxal and pyridoxal 5'-phosphate (PLP) as MR1 ligands and show that both compounds are recognized by T cells expressing either A-F7, a mucosal-associated invariant T (MAIT) cell T cell receptor (TCR), or MC.7.G5, an MR1-restricted TCR reported to recognize cancer cells, highlighting them as immunogenic MR1 ligands.

Keywords: CP: Immunology; MAIT; MR1; T cell; TCR; antigen presentation; cross-linking; mass spectrometry; metabolite antigens; pyridoxal; vitamin B6.


Conflict of interest statement

Declaration of interests F.M., M.v.E., R.M.G., H.S., J.D., J.D.S., and N.T. were employees of Enara Bio at the time of this study and were in receipt of salary and stock options in Enara Bio Ltd. For parts of the study, T.S., E.B., and S.H. were academic postdoctoral researchers fully or partly funded by Enara Bio Ltd. A.K.S. and G.D. have patents granted and pending on T cell recognition.

Figures

None
Graphical abstract
Figure 1
Figure 1
Workflow for MR1-dependent antigen discovery by protein-metabolite cross-linking (1) Cells presenting antigens on MR1 were lysed, followed by (2) strep-tag-based enrichment of MR1 from the lysate. (3) The unstable Schiff base that formed between the ligand and the MR1 K43 residue was subsequently stabilized using reductive amination followed by (4) proteolytic digest, giving rise to the K43-specific DSVTRQKEPRAPW peptide (Figure S1). (5) Peptide samples were analyzed by bottom-up LC-MS/MS. (6) Data were scoured for evidence of variable modification on the MR1-specific K43 peptide DSVTRQKEPRAPW using a combination of mass shift analysis and peptide sequence-specific reporter ions. (7) Mass shifts of potential ligands were shortlisted according to their potential chemical composition and (8) validated biochemically by their ability to induce MR1 surface expression in cells, as measured by flow cytometry. See also Figure S1.
Figure 2
Figure 2
Reductive amination of Ac-6-FP with synthetic DSVTRQKEPRAPW peptide and within the MR1-binding pocket (A–D) Proof of concept for cross-linking reaction using synthetic DSVTRQKEPRAPW and the well-established MR1 ligand Ac-6-FP in vitro. (A) Representative spectrum from triplicate analysis for a peptide identification by PEAKS defining Ac-6-FP as a variable modification. Sequence-specific b-ions (purple) and y-ions (blue) are annotated in the spectra and visualized in the peptide sequence. Red lines pointing to the right above the peptide sequence indicate the presence of a position-specific y-ion, and red lines pointing to the left below the peptide sequence indicate presence of a position-specific b-ion. (B) Representative extracted ion chromatograms (XICs) of the Ac-6-FP-bound DSVTRQKEPRAPW precursor, including the three most abundant isotopes (M, M+1, and M+2). The horizontal axis represents chromatographic retention time (RT) in minutes (min). (C) Reaction yields were assessed by calculating ratios of the chromatographic area under the curve (AUC) of Ac-6-FP-bound DSVTRQKEPRAPW and unmodified DSVTRQKEPRAPW at various reaction conditions, suggesting an improved yield at lower concentrations of NaCNBH3. Experiments were performed in triplicate, with error bars indicating standard deviations. (D) Similarly, AUCs for free Ac-6-FP decrease at higher NaCNBH3 concentrations, indicating the possibility of an off-target reduction reaction happening in increased reducing conditions prior to cross-link formation. Experiments were performed in triplicate, with error bars indicating standard deviations. (E and F) Proof of concept for cross-linking reaction within the MR1 binding groove. (E) Diclofenac-loaded recombinant MR1/β2M complexes were incubated with Ac-6-FP to induce ligand exchange and perform reductive amination at 5 different NaCNBH3 concentrations. (F) Representative XICs for the reaction product after chymotryptic digestion in comparison to the non-cross-linked peptide. The product was detected in all five experimental conditions tested. See also Figure S2.
Figure 3
Figure 3
Development of an enrichment strategy for MR1-dependent antigen discovery by protein-metabolite cross-linking and de novo MR1 antigen discovery (A) Schematic of a recombinant platform to express fully functional, C-terminally-tagged single-chain MR1/β2M (scMR1) molecules with either lysine or alanine at position 43, developed for high-specificity MR1 enrichment. The alpha 1, 2, 3, and transmembrane (TM) domains of MR1 are depicted. (B) MR1 staining of A549 (left) and MM909.24 (right) cell lines, either wild type (WT), MR1 knockout (MR1 KO), and MR1 KO cells transduced with scMR1 (MR1 KO + scMR1-WT) and mutant scMR1 (MR1 KO + scMR1-K43A). Numbers in the left-hand corner are the MR1-specific Allophycocyanin (APC) mean fluorescence intensities (staining with anti-MR1 26.5 antibody clone). Gates are set for viable, single cells. (C) Overnight activation assay with MAIT cell TCR-T (primary CD8+ T cells transduced with A-F7 MAIT TCR) versus M. smegmatis-infected and uninfected A549 cells followed by a tumor necrosis factor (TNF) ELISA confirming MAIT cell recognition of scMR1 in the presence of endogenous antigen. Error bars depict the standard deviation of duplicate conditions. (D) Enrichment efficiency obtained from MM909.24 cells stably transduced with scMR1-K43 molecules based on protein abundances obtained by LC-MS/MS (MR1 and β2M are highlighted separately as red dots that overlap). (E) Proof of concept for the detection of MR1/Ac-6-FP cross-link in a cell-based system. scMR1-transfected MM909.24 melanoma cells pulsed with 50 μM Ac-6-FP for 16 h were subjected to the cross-linking workflow. The graph shows extracted ion chromatograms for DSVTRQKEPRAPW and DSVTRQKEPRAPW bound to Ac-6-FP, respectively, including the three most abundant isotopes (M, M+1, and M+2) for each of the two peptide variants. (F) Schematic of the data analysis workflow employed to detect DSVTRQKEPRAPW cross-linked to unknown ligands. Peptide sequence ladder ions unaffected by the ligand (y1–y6 and b1–b6) were used as reporter ions. MS/MS spectra containing these ions were subsequently shortlisted. Subtraction of the theoretical DSVTRQKEPRAPW peptide mass generates Δ-mass values for cross-linked ligands that can be corrected for the mass of the free ligand, which can be queried for candidate compounds using tools such as CEU mass mediator. (G and H) Applied to scMR1-transfected MM909.24 pulsed with 50 μM Ac-6-FP for 16 h, the data analysis pipeline successfully detected spectra indicating the presence of other ligands bound to MR1, such as 6-formylpterin (XIC, G) and methylglyoxal (XIC, H). See also Figure S3 and Tables S2 and S3.
Figure 4
Figure 4
Discovery and validation of pyridoxal as MR1 ligand (A and B) scMR1-transfected A549 cells were subjected to reductive cross-linking, shortlisting pyridoxal as a candidate ligand. Data are shown for (A) the annotated fragment spectrum for K43-bound pyridoxal (sequence-specific b- and y-ions are depicted in purple and blue, respectively, in the spectra, with their respective mass error in ppm depicted above) and (B) the corresponding extracted ion chromatogram. (C–H) Corresponding data for replicates 2–4. See also Figure S4 and Table S4.
Figure 5
Figure 5
Ligand-induced upregulation of MR1 surface expression (A and B) Pyridoxal upregulates overexpressed scMR1 at the cell surface. The A549 MR1 KO cell line with scMR1-WT or scMR1-K43A was treated with two candidate compounds at 100 μg/mL overnight at 37°C and 5% CO2 and stained with MR1-specific pycoerythrin (PE)-conjugated antibody (MR1-PE). (A) Mean fluorescence intensity (MFI) of MR1 staining. rCD2 was used as a co-marker for scMR1 and used for gating during flow cytometry. MFI without MR1 antibody has been subtracted from the MFI with MR1 antibody. Triplicate conditions are shown, with error bars depicting standard deviation (Table S5A). p values displayed are adjusted p values obtained using one-way ANOVA followed by Tukey’s honest significant difference (HSD) post hoc test to correct for multiple comparisons (Table S5B). (B) Flow cytometry for all data displayed in (A), including no-stain condition, showcasing reproducibility across replica. Displayed are all of the triplicate conditions. The vertical line has been set at the no-ligand condition to aid visualization. (C and D) Pyridoxal upregulates naturally expressed MR1 at the cell surface. A549 WT and A549 MR1 KO cell lines were treated with candidate compounds at 100 μg/mL overnight at 37°C and 5% CO2 and stained with MR1-PE antibody. (C) MFI of MR1 staining. MFI without MR1 antibody has been subtracted from the MFI with MR1 antibody. Triplicate conditions are shown, with error bars depicting standard deviation (Table S5C). p values displayed are adjusted p values obtained using one-way ANOVA followed by Tukey’s HSD post hoc test to correct for multiple comparisons (Table S5D). (D) Flow cytometry for all data displayed in (C). Displayed are all of the triplicate conditions with MFI for no stain (gray) and MR1 stain (red). See also Figure S5 and Table S5.
Figure 6
Figure 6
The B6 vitamers pyridoxal and PLP activate Jurkat cells expressing the A-F7 MAIT TCR and the MC.7.G5 TCR, as well as primary CD8+ T cells expressing the A-F7 MAIT TCR (A) Jurkat cells with no TCR or transduced with A-F7 MAIT TCR were co-incubated overnight with A549 WT and A549 MR1 KO cell lines treated with pyridoxal at 100, 10, and 1 μg/mL or loaded with M. smegmatis (MOI: 1:300). Cells were stained for CD69 expression with mean fluorescence intensity (MFI) displayed. Background MFI of Jurkat cells with A549 WT or MR1 KO alone with no pyridoxal or M. smegmatis was subtracted. Jurkat cells with A-F7 were gated on co-marker rCD2+. Data display duplicate conditions (Table S5E). (B) Jurkat cells with no TCR or transduced with A-F7 MAIT TCR were co-incubated overnight with A549 WT and the following compounds: 5-A-RU (converts to MAIT ligand 5-OP-RU in cells and was added in the absence of exogenously applied methylglyoxal, which increases potency), pyridoxal and PLP at 100, 10, 1, 0.1, 1 × 10⁻², 1 × 10⁻³, and 1 × 10⁻⁴ μg/mL. Cells were stained for CD69 expression with MFI displayed. Background MFI of Jurkat cells with A549 cells alone with no pyridoxal was subtracted. Jurkat cells expressing the A-F7 TCR were gated on the rCD2 co-marker. Assay was performed in triplicate (Table S5F), and curves were fitted using a four-parameter logistic model. Points indicate mean values, with error bars depicting standard deviation. EC50 values with a 95% confidence interval (CI) and R2 are indicated, with the results reproducible over two assays (Table S5G). (C) Primary CD8+ T cells from three healthy donors with no TCR transduction or expression of the A-F7 TCR to generate TCR-T cells, were co-incubated for 4 h with A549 WT cells ± pre-treatment with 100 μg/mL of pyridoxal, and then reactivity measured via T107 assay. T cells were also incubated alone or with CD3/CD28 Dynabeads, with the latter acting as a positive control. Cells were gated on lymphocytes, viable CD3+, single cells, rCD2+/CD8+ (or CD8+ for the untransduced), and then TNF+ versus CD107a+ for reactivity. For the pyridoxal conditions, background reactivity toward A549 cell lines with no pyridoxal has been subtracted. For reactivity toward CD3/CD28 Dynabeads, the reactivity for the T cell-alone condition has been subtracted (Table S5H). (D) Jurkat cells with no TCR or transduced with MC.7.G5 TCR were co-incubated overnight with C1R cells ± pyridoxal at 100, 10, 1, 0.1, and 1 × 10⁻² μg/mL. Cells were stained for CD69 expression with MFI displayed. Background MFI of Jurkat cells alone with no pyridoxal was subtracted. Jurkat cells with MC.7.G5 TCR were gated on co-marker rCD2+. Assay was performed in triplicate (Table S5I), and curves were fitted using a four-parameter logistic model. Points indicate mean values, with error bars depicting standard deviation. EC50 values with a 95% CI and R2 are indicated (Table S5J). See also Figure S5 and Table S5.

References

    1. Kjer-Nielsen L., Patel O., Corbett A.J., Le Nours J., Meehan B., Liu L., Bhati M., Chen Z., Kostenko L., Reantragoon R., et al. MR1 presents microbial vitamin B metabolites to MAIT cells. Nature. 2012;491:717–723. doi: 10.1038/nature11605. - DOI - PubMed
    1. Patel O., Kjer-Nielsen L., Le Nours J., Eckle S.B.G., Birkinshaw R., Beddoe T., Corbett A.J., Liu L., Miles J.J., Meehan B., et al. Recognition of vitamin B metabolites by mucosal-associated invariant T cells. Nat. Commun. 2013;4:2142. doi: 10.1038/ncomms3142. - DOI - PubMed
    1. Corbett A.J., Eckle S.B.G., Birkinshaw R.W., Liu L., Patel O., Mahony J., Chen Z., Reantragoon R., Meehan B., Cao H., et al. T-cell activation by transitory neo-antigens derived from distinct microbial pathways. Nature. 2014;509:361–365. doi: 10.1038/nature13160. - DOI - PubMed
    1. Crowther M.D., Dolton G., Legut M., Caillaud M.E., Lloyd A., Attaf M., Galloway S.A.E., Rius C., Farrell C.P., Szomolay B., et al. Genome-wide CRISPR-Cas9 screening reveals ubiquitous T cell cancer targeting via the monomorphic MHC class I-related protein MR1. Nat. Immunol. 2020;21:178–185. doi: 10.1038/s41590-019-0578-8. - DOI - PMC - PubMed
    1. Dolton G., Thomas H., Tan L.R., Rius Rafael C., Doetsch S., Ionescu G.A., Cardo L.F., Crowther M.D., Behiry E., Morin T., et al. MHC-related protein 1-restricted recognition of cancer via a semi-invariant TCR-alpha chain. J. Clin. Investig. 2025;135 doi: 10.1172/JCI181895. - DOI - PMC - PubMed

MeSH terms

LinkOut - more resources