. 2025 Sep;30(5):e70041.
doi: 10.1111/gtc.70041.

Functional Differences Between SIRPα Splice Isoforms

Affiliations

Functional Differences Between SIRPα Splice Isoforms

Mihoko Kajita et al. Genes Cells. 2025 Sep.

Abstract

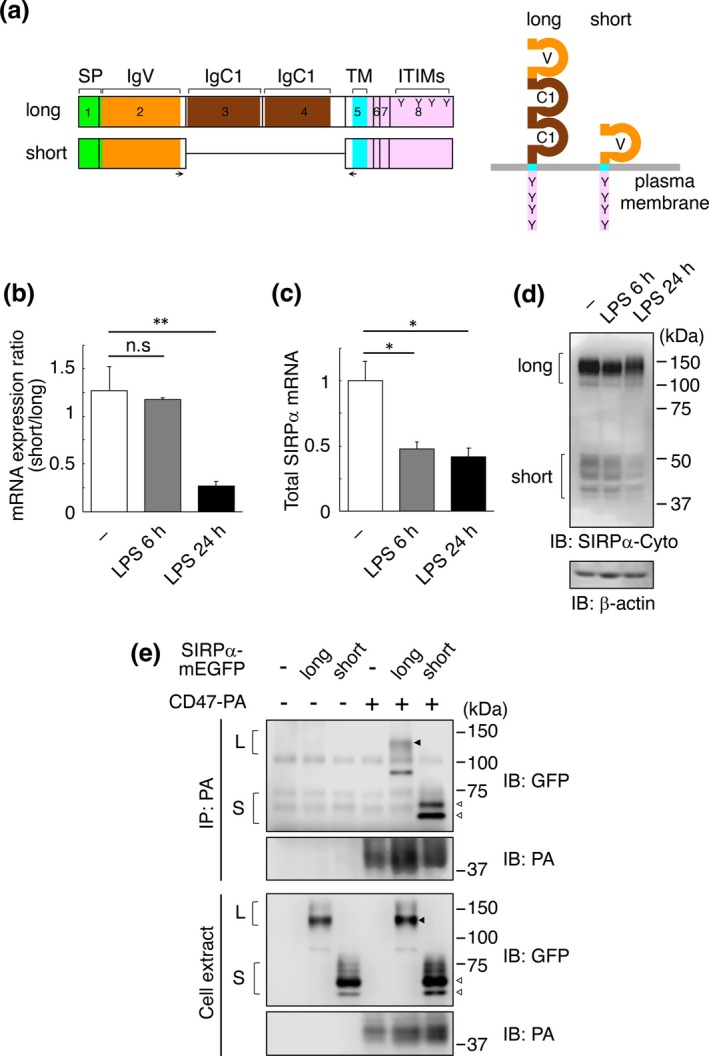
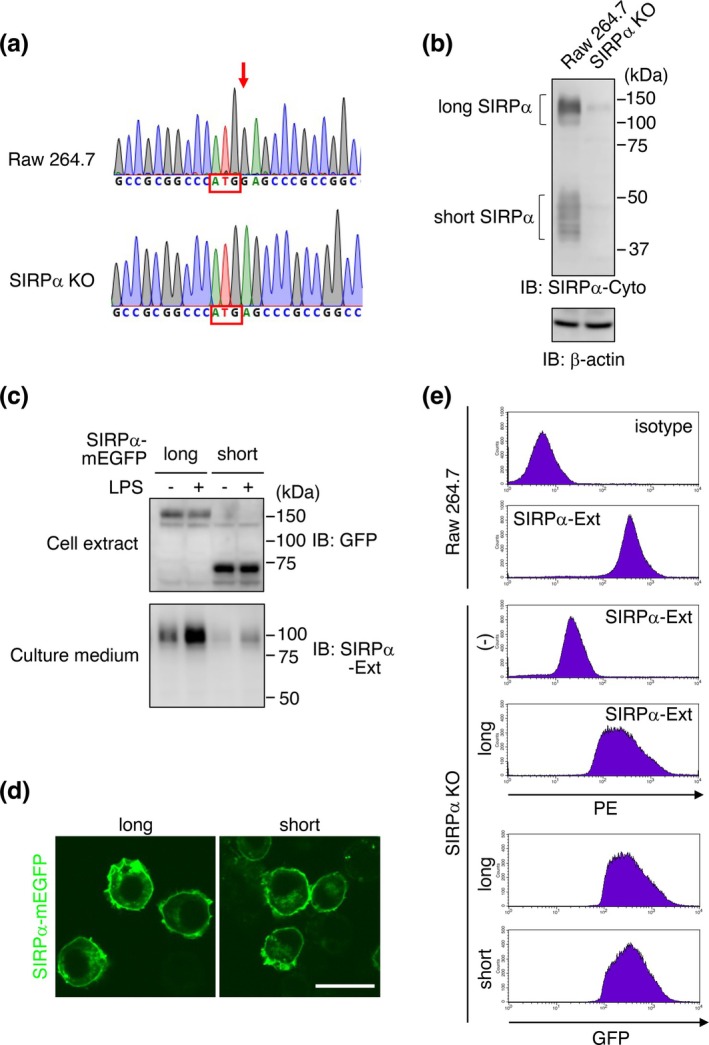
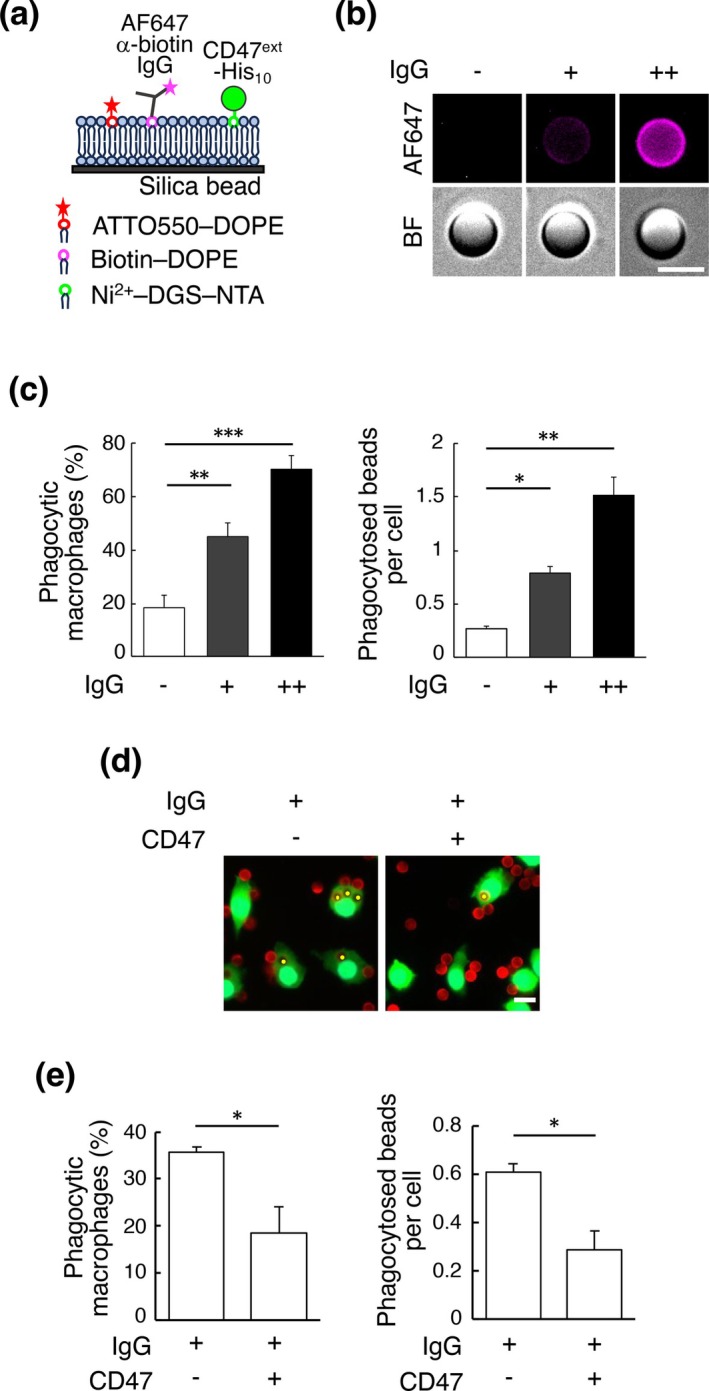
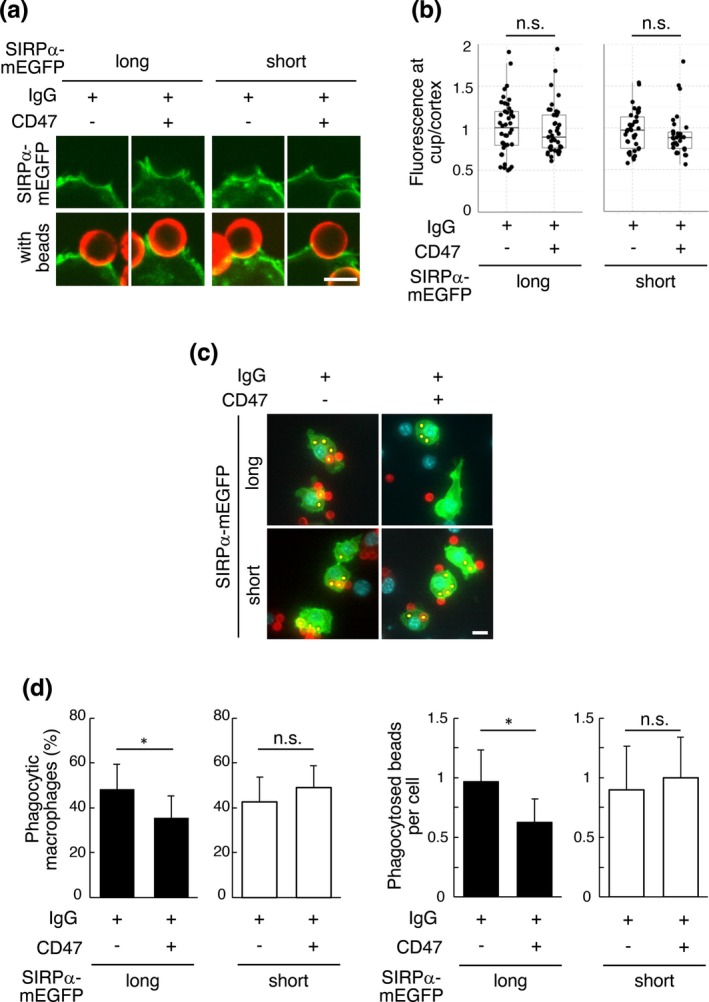
Signal regulatory protein (SIRP) α, an inhibitory receptor belonging to the immunoglobulin (Ig) superfamily is abundantly expressed in phagocytes such as macrophages. CD47, the ligand for SIRPα, is expressed in most healthy cells, and called "don't eat me" signal because it binds to SIRPα on the surface of macrophages and inhibits phagocytosis. SIRPα has multiple splice isoforms, but most functional analyses have been carried out using long SIRPα, the SIRPα isoform with three extracellular Ig domains. In this study, we analyzed the expression and function of short SIRPα, an SIRPα isoform with only one extracellular Ig domain. In resting mouse macrophage Raw 264.7 cells, the short and long SIRPα mRNA expression levels were similar, and the proportion of short SIRPα mRNA decreased substantially after endotoxin stimulation. Short SIRPα bound to CD47 as same as long SIRPα, however, did not suppress the phagocytosis of recombinant CD47-coated beads, unlike long SIRPα. These results suggest that short SIRPα may be a "don't eat me" signal regulator with different expression and function from long SIRPα.

Keywords: CD47; SIRPα; macrophage; phagocytosis; splice isoform; “don't eat me” signal.


Conflict of interest statement

The authors declare no conflicts of interest.

Figures

FIGURE 1
FIGURE 1
mRNA expression ratio and CD47 binding ability of signal regulatory protein (SIRP) α isoforms. (a) Schematic diagrams of splice isoforms of SIRPα. Exons are indicated by black rectangles with numbers (left). IgC1, Ig‐like constant 1‐type domain (brown); IgV, immunoglobulin (Ig)‐like variable‐type domain (orange); ITIMs, immunoreceptor tyrosine‐based inhibitory motifs; SP, signal peptide (green); TM, transmembrane domain (light blue). Y characters indicate tyrosine residues in ITIMs. Cytoplasmic domains are colored in pink. Arrows indicate the approximate positions of the primers used in RT‐PCR. Topology of SIRPα isoforms is shown on the right. (b) mRNA expression ratio of SIRPα isoforms in LPS‐treated Raw 264.7 cells. Raw 264.7 cells were treated with 100 ng/mL LPS for the indicated time, and RT‐PCR was performed using the collected RNA to calculate the mRNA expression ratio of SIRPα isoforms. Mean values from three independent experiments are shown with SE. Asterisks indicate the statistical significance (p < 0.01) as determined by one‐way ANOVA followed by Dunnett's test. n.s. indicates not significant. (c) Total amount of SIRPα mRNA in LPS‐treated Raw 264.7 cells. Raw 264.7 cells were treated with LPS for the indicated time, and quantitative RT‐PCR was performed using primers common to both SIRPα isoforms. Mean values from three independent experiments are shown with SEM. Asterisks indicate the statistical significance (p < 0.05) by one‐way ANOVA with Dunnett's test. (d) Levels of SIRPα isoform proteins in LPS‐treated Raw 264.7 cells. Cell extracts were subjected to western blotting using an anti‐SIRPα antibody that recognizes the cytoplasmic domain of SIRPα (SIRPα‐Cyto). Loading control: β‐actin. (e) CD47 binding ability of SIRPα isoforms. Chinese hamster ovary (CHO) cells were co‐transfected with expression vectors for C‐terminally monomeric EGFP (mEGFP)‐fused long or short SIRPα—and CD47–PA as indicated. Interaction was detected by immunoprecipitation (IP) with anti‐PA antibody, followed by western blotting (IB) with anti‐GFP or anti‐PA antibody. Total cell extracts were also immunoblotted with indicated antibodies. Black and white triangles indicate the bands corresponding to long SIRPα (L) and short SIRPα (S), respectively.
FIGURE 2
FIGURE 2
Generation of macrophage cells expressing C‐terminally monomeric EGFP (mEGFP) fused signal regulatory protein (SIRP) α isoforms instead of endogenous SIRPα. (a) Genomic sequence of Raw 264.7 and SIRPα KO cells. Red arrow indicates the base deleted in SIRPα KO cells. Start codon is marked with red rectangles. (b) Western blotting of cell extracts from Raw 264.7 and SIRPα KO cells using an anti‐SIRPα antibody that recognizes the cytoplasmic domain of SIRPα (SIRPα‐Cyto). Loading control: β‐actin. (c) SIRPα KO cells expressing long or short SIRPα–mEGFP were treated with (+) or without (−) 1 μg/mL of LPS for 60 min. Both cell extracts (cell extract) and culture supernatants (culture medium) were subjected to western blotting using indicated antibodies. SIRPα‐Ext indicates the antibody that recognizes the extracellular domain of SIRPα. (d) Cell surface localization of long and short SIRPα–mEGFP. SIRPα KO cells were infected with a lentiviral vector expressing long or short SIRPα–mEGFP and observed using a confocal microscope. Scale bar: 20 μm. (e) Flow cytometry analysis of Raw 264.7 and SIRPα KO cells expressing long or short SIRPα–mEGFP using a PE‐labeled antibody that recognizes the extracellular domain of SIRPα (SIRPα‐Ext) or fluorescence signal of mEGFP (bottom two panels).
FIGURE 3
FIGURE 3
Phagocytic target bead conjugated with IgG and CD47 via a supported lipid bilayer. (a) Schematic diagram of a phagocytic target bead surface used in this study. The beads are covered with a supported lipid bilayer, and IgG and CD47 were bound to the constituent lipid heads. Alexa Fluor 647–anti‐biotin IgG is bound to biotin–DOPE, and His10‐tagged extracellular domain of CD47 is bound to Ni2+–DGS–NTA. (b) Fluorescence images of target beads conjugated with IgG. 300 (+) or 3000 (++) Alexa Fluor 647–anti‐biotin IgG molecules/μm2 were conjugated to the beads. AF647 indicates the signal of Alexa Fluor 647, and BF indicates bright field images. Scale bar: 5 μm. (c) The percentage of Raw 264.7 cells that phagocytosed IgG‐coated beads (left) and the number of phagocytosed beads divided by the number of counted cells (right). Beads conjugated with IgG at the indicated density (300 (+) or 3000 (++) molecules/μm2) and beads without conjugation (−) were added to EGFP‐expressing Raw 264.7 cells; the cells were fixed after 30 min and observed under a fluorescence microscope to count the phagocytic cells and phagocytosed beads. Mean values from three independent experiments are shown with SEM. Asterisks indicate the statistical significance (*p < 0.05, **p < 0.01, ***p < 0.001) as determined by one‐way ANOVA with Dunnett's test. (d) Phagocytosis of IgG‐ or IgG/CD47‐coated beads by Raw 264.7 cells. IgG (300 molecules/μm2) and/or CD47 (6000 molecules/μm2)‐conjugated beads were added to EGFP‐expressing Raw 264.7 cells, which were fixed after 30 min and observed under a fluorescence microscope. The supported lipid bilayers contain ATTO550–DOPE (red), Raw 264.7 cells express EGFP (green), and the nuclei are stained with Hoechst 33342 (cyan). Internalized beads are indicated with a yellow dot. Scale bar: 10 μm. (e) The percentage of Raw 264.7 cells that phagocytosed IgG‐ or IgG/CD47‐coated beads (left) and the number of phagocytosed beads divided by the number of counted cells (right). Mean values from three independent experiments are shown with SEM. Asterisks indicate the statistical significance (p < 0.05) as calculated by Student's t‐test.
FIGURE 4
FIGURE 4
Short signal regulatory protein (SIRP) α does not inhibit phagocytosis, unlike long SIRPα. (a) SIRPα isoform localization in phagocytic cups. IgG (300 molecules/μm2) and/or CD47 (6000 molecules/μm2)‐conjugated beads were added to long or short SIRPα–C‐terminally monomeric EGFP (mEGFP)‐expressing cells, and cells were fixed after 15 min and observed under a confocal microscope. The supported lipid bilayers contain ATTO550–DOPE (red), and the macrophages express long or short SIRPα–mEGFP (green). Scale bar: 5 μm. (b) The ratio of mEGFP fluorescence at the phagocytic cup compared to that at the cortex for long and short SIRPα–mEGFP. Each dot represents an individual phagocytic cup. The data was collected from three independent experiments. n.s. indicates not significant. (c) Phagocytosis of IgG‐ or IgG/CD47‐coated beads by long or short SIRPα–mEGFP‐expressing cells. IgG‐ or IgG/CD47‐coated beads were added to long or short SIRPα–mEGFP‐expressing cells, and cells were fixed after 30 min and observed under a fluorescence microscope. The supported lipid bilayers contain ATTO550–DOPE (red), the macrophages express long or short SIRPα–mEGFP (green), and the nuclei are stained with Hoechst 33342 (cyan). Internalized beads are indicated with a yellow dot. Scale bar: 10 μm. (d) The percentage of macrophages that phagocytosed IgG‐ or IgG/CD47‐coated beads (left) and the number of phagocytosed beads divided by the number of counted cells (right). Mean values from three independent experiments are shown with SEM. Asterisks indicate the statistical significance (p < 0.05) as calculated by Student's t‐test. n.s. indicates not significant.

Similar articles

References

    1. Alvey, C. , and Discher D. E.. 2017. “Engineering Macrophages to Eat Cancer: From “Marker of Self” CD47 and Phagocytosis to Differentiation.” Journal of Leukocyte Biology 102: 31–40. - PMC - PubMed
    1. Arandjelovic, S. , and Ravichandran K. S.. 2015. “Phagocytosis of Apoptotic Cells in Homeostasis.” Nature Immunology 16: 907–917. - PMC - PubMed
    1. Bakalar, M. H. , Joffe A. M., Schmid E. M., Son S., Podolski M., and Fletcher D. A.. 2018. “Size‐Dependent Segregation Controls Macrophage Phagocytosis of Antibody‐Opsonized Targets.” Cell 174: 131–142.e113. - PMC - PubMed
    1. Baralle, F. E. , and Giudice J.. 2017. “Alternative Splicing as a Regulator of Development and Tissue Identity.” Nature Reviews. Molecular Cell Biology 18: 437–451. - PMC - PubMed
    1. Barclay, A. N. , and Brown M. H.. 2006. “The SIRP Family of Receptors and Immune Regulation.” Nature Reviews. Immunology 6: 457–464. - PubMed

LinkOut - more resources