. 2025 Aug 5;8(10):e202503417.
doi: 10.26508/lsa.202503417. Print 2025 Oct.

Epigenetic liquid biopsies reveal endothelial turnover and erythropoiesis in asymptomatic COVID-19

Affiliations

Epigenetic liquid biopsies reveal endothelial turnover and erythropoiesis in asymptomatic COVID-19

Roni Ben-Ami et al. Life Sci Alliance. .

Abstract

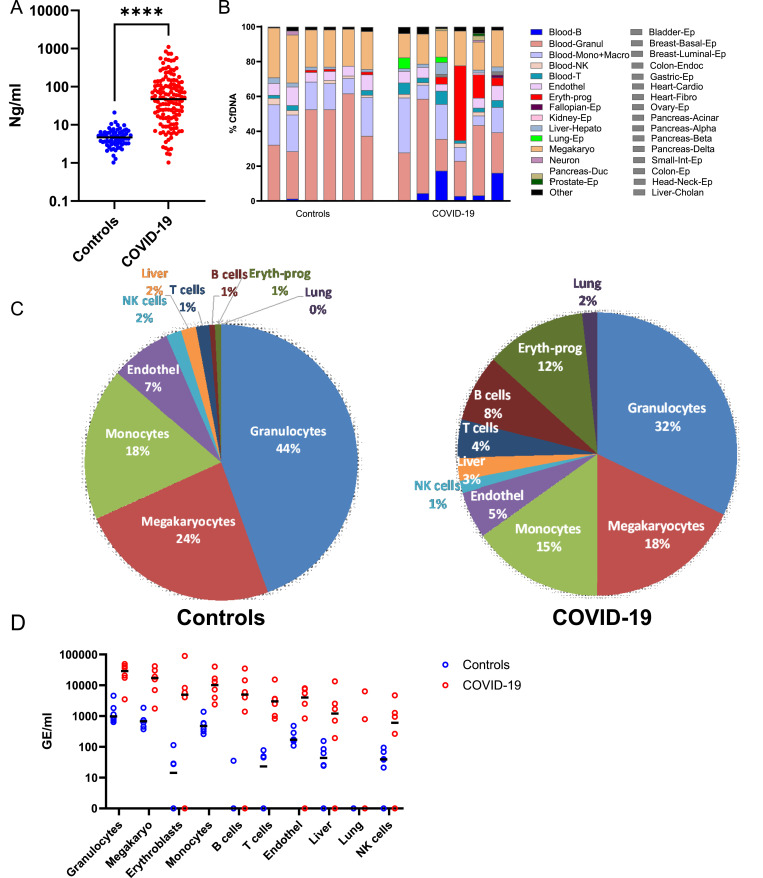
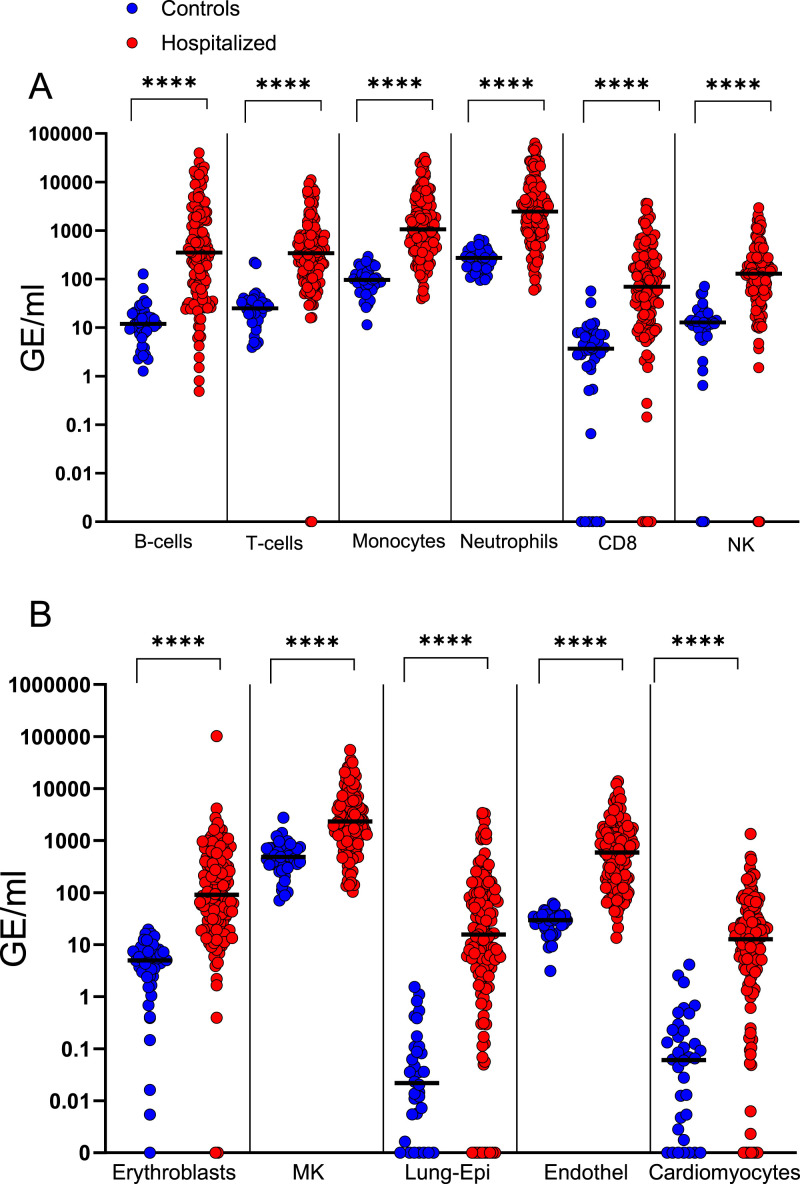
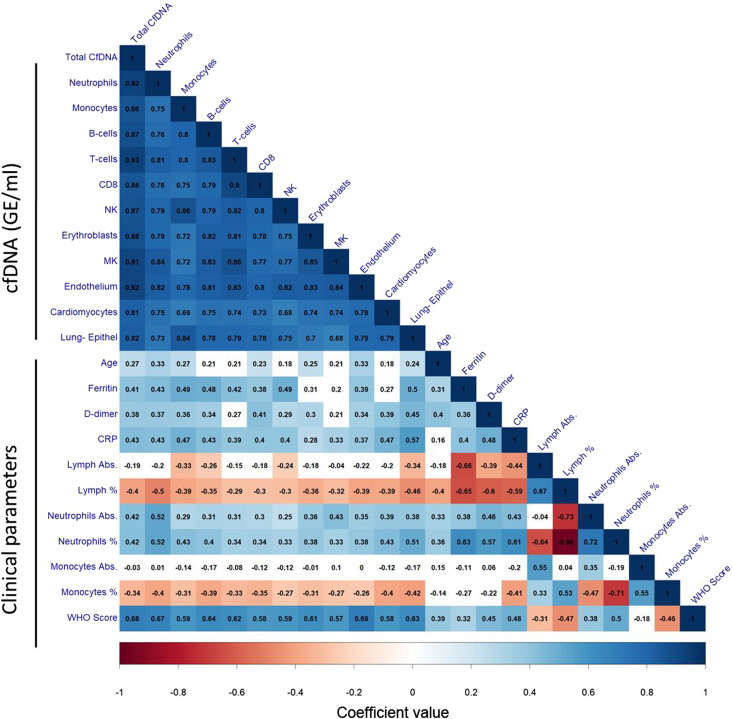
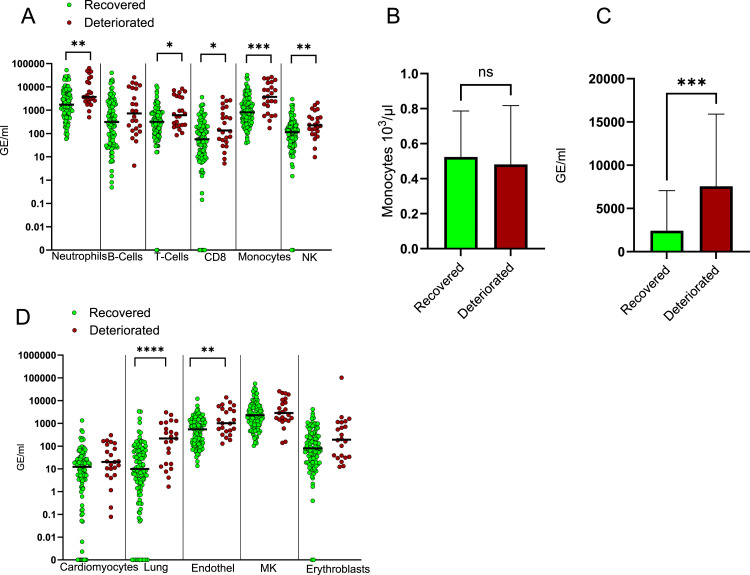
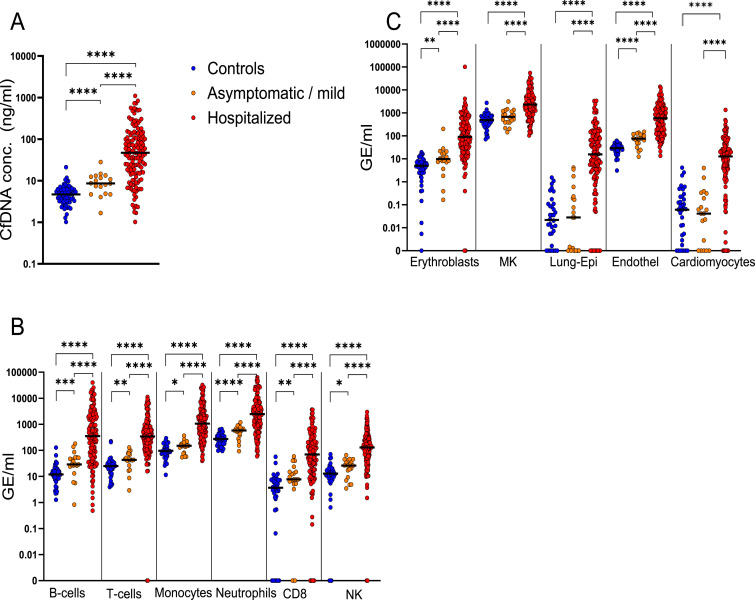
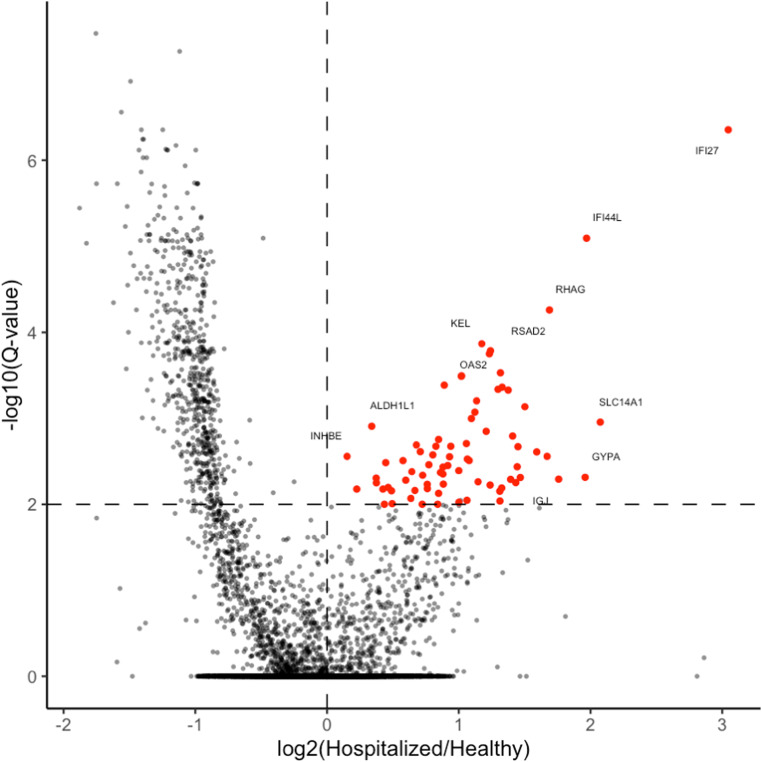
Understanding the full spectrum of tissues affected by SARS-CoV-2 is crucial for deciphering the heterogeneous clinical course of COVID-19. We analyzed DNA methylation and histone modifications in circulating chromatin to assess cell type-specific turnover in patients ranging from asymptomatic to severe cases, in relation to clinical outcomes. Severe COVID-19 was marked by a massive elevation of circulating cell-free DNA (cfDNA) from lung epithelium, cardiomyocytes, vascular endothelium, and erythroblasts, indicating increased cell death or turnover. The immune response was reflected by elevated B-cell and monocyte/macrophage cfDNA and an interferon response before cfDNA release. Strikingly, monocyte/macrophage cfDNA (but not monocyte counts), as well as lung epithelial and endothelial cfDNA, predicted clinical deterioration and duration of hospitalization. Asymptomatic patients had elevated immune cfDNA but no evidence of pulmonary or cardiac damage. Surprisingly, these patients showed elevated endothelial and erythroblast cfDNA, suggesting subclinical vascular and erythrocyte turnover are universal features of COVID-19, independent of disease severity. Epigenetic liquid biopsies provide a noninvasive means of monitoring COVID-19 patients and reveal subclinical vascular damage and red blood cell turnover.


Conflict of interest statement

Supported in part by GRAIL, Inc., G Cann is an employee and shareholder at GRAIL, Inc. I Sharkia and N Friedman are shareholders and/or founders at Senseera, Inc. N Loyfer, T Kaplan, B Glaser, R Shemer, and Y Dor have filed patents on cfDNA analysis technology. The remaining authors have declared no conflict of interest.

Figures

Figure 1.
Figure 1.. Whole-genome bisulfite sequencing analysis of severe COVID-19 patients and sex- and age-matched controls.
(A) CfDNA concentration of hospitalized patients (n = 120) and controls (N = 68). (B) Deconvolution of plasma samples from severe patients (N = 6) and matched controls (N = 6). Each column is a single sample. These samples are used for further analysis in the next panels. (C) Average relative contribution of indicated cell types in patients and controls. (D) Absolute values of cfDNA from indicated cell types in patients and controls, derived by multiplying the fraction of cell type–specific cfDNA by the total concentration of cfDNA in the sample. Values are expressed as genome equivalents per ml plasma. Each dot represents one sample. *P < 0.05, **P < 0.01, ***P < 0.001, and ****P < 0.0001. Band indicates the median value.
Figure S1.
Figure S1.. Identification of DNA methylation markers of immune cells and selected cell types from solid tissue.
(A, B) Identification of DNA methylation markers of immune cells (A) and selected cell types from solid tissue (B). Heat map was derived from WGBS methylation atlas that was previously published (Loyfer et al, 2023). Each row represents the methylation status (beta value) of an individual CpG, from unmethylated to fully methylated.
Figure S2.
Figure S2.. Comparative analysis of WGBS and targeted cfDNA results in five hospitalized patients.
Values shown are fractions of a given cell type from total cfDNA.
Figure 2.
Figure 2.. Targeted analyses of cfDNA origins in hospitalized patients.
Each dot represents a sample. In total, the analysis includes 120 hospitalized patients and 30–45 healthy controls. (A) Immune-derived cfDNA markers. (B) cfDNA methylation markers of erythroblasts, megakaryocytes (MK), lung epithelial cells, vascular endothelial cells, and cardiomyocytes. Note that the median level of cardiomyocyte cfDNA is 12 GE/ml, potentially explaining why this was not detected by the less-sensitive deconvolution analysis. *P < 0.05, **P < 0.01, ***P < 0.001, and ****P < 0.0001. Horizontal lines indicate the median value. Because of the nonzero limit of log graphs, we consider 0.001 GE/ml as undetected.
Figure 3.
Figure 3.. Correlations between cell type–specific cfDNA, clinical and laboratory parameters, and WHO clinical score.
Correlation coefficients are presented in black inside each square. Only statistically significant correlations (q < 0.05) are colored, and the blue–white–red color scale reflects the coefficient value.
Figure 4.
Figure 4.. Correlation between cell type–specific cfDNA and future clinical course.
WHO score on the day of sampling was subtracted from the maximal WHO score during the hospitalization, following the sampling day. Nonpositive values were scored as clinical recovery, whereas positive values were scored as deterioration. (A) Immune-derived cfDNA levels in patients that recovered or deteriorated clinically after sampling. (B) Monocyte cell counts in patients that deteriorated or recovered. (C) Monocyte/macrophage-derived cfDNA in patients that deteriorated or recovered. (D) cfDNA from cardiomyocytes, lung epithelial cells, vascular endothelial cells, megakaryocytes (MK), and erythroblasts in patients that recovered or deteriorated clinically after sampling. *P < 0.05, **P < 0.01, ***P < 0.001, and ****P < 0.0001. The band indicates the median value. Because of the nonzero limit of log graphs, we consider 0.001 GE/ml as undetected.
Figure 5.
Figure 5.. Cell type–specific cfDNA in patients with asymptomatic or mild COVID-19 (n = 19) compared with hospitalized patients (n = 120) and healthy controls (n = 45).
(A) Total cfDNA concentration. (B) Immune-derived cfDNA. (C) cfDNA from erythroblasts, megakaryocytes, lung epithelial cells, vascular endothelial cells, and cardiomyocytes. *P < 0.05, **P < 0.01, ***P < 0.001, and ****P < 0.0001. The band indicates the median value. Because of the nonzero limit of log graphs, we consider 0.001 GE/ml as undetected.
Figure S3.
Figure S3.. Chromatin analysis of hospitalized patients compared with healthy controls.
In red are genes with differential coverage between the hospitalized and healthy samples that were used for heat map in Fig 6A.
Figure 6.
Figure 6.. Chromatin immunoprecipitation of cell-free nucleosomes analysis of COVID-19 patients, asymptomatic patients, and controls.
(A) Unsupervised clustered heat map of the genes that are significantly elevated in the hospitalized COVID-19 patients, compared with controls. Color represents log2 (1+ normalized promoter coverage). (B) Reads of genes from a predefined interferon response gene set in the three groups.

Similar articles

References

    1. Ahmadian E, Hosseiniyan Khatibi SM, Razi Soofiyani S, Abediazar S, Shoja MM, Ardalan M, Zununi Vahed S (2021) Covid-19 and kidney injury: Pathophysiology and molecular mechanisms. Rev Med Virol 31: e2176. 10.1002/rmv.2176 - DOI - PMC - PubMed
    1. Aid M, Busman-Sahay K, Vidal SJ, Maliga Z, Bondoc S, Starke C, Terry M, Jacobson CA, Wrijil L, Ducat S, et al. (2020) Vascular disease and thrombosis in SARS-CoV-2-infected Rhesus macaques. Cell 183: 1354–1366.e13. 10.1016/j.cell.2020.10.005 - DOI - PMC - PubMed
    1. Amin M (2021) COVID-19 and the liver: Overview. Eur J Gastroenterol Hepatol 33: 309–311. 10.1097/MEG.0000000000001808 - DOI - PMC - PubMed
    1. Andargie TE, Tsuji N, Seifuddin F, Jang MK, Yuen PS, Kong H, Tunc I, Singh K, Charya A, Wilkins K, et al. (2021) Cell-free DNA maps COVID-19 tissue injury and risk of death and can cause tissue injury. JCI Insight 6: e147610. 10.1172/jci.insight.147610 - DOI - PMC - PubMed
    1. Barski A, Cuddapah S, Cui K, Roh T-Y, Schones DE, Wang Z, Wei G, Chepelev I, Zhao K (2007) High-resolution profiling of histone methylations in the human genome. Cell 129: 823–837. 10.1016/j.cell.2007.05.009 - DOI - PubMed

Substances

LinkOut - more resources