. 2025 Sep 2;35(9):2064-2075.
doi: 10.1101/gr.280164.124.

3'-end ligation sequencing is a sensitive method to detect DNA nicks at potential sites of off-target activity induced by prime editors

Affiliations

3'-end ligation sequencing is a sensitive method to detect DNA nicks at potential sites of off-target activity induced by prime editors

Jacob Stewart-Ornstein et al. Genome Res. .

Abstract

Gene editing makes precise changes in DNA to restore normal function or expression of genes; however, the advancement of gene editing to the clinic is limited by the potential genotoxicity of off-target editing. To comprehensively identify potential sites in the genome that may be recognized by gene editing agents, in vitro approaches, in which the editor is combined with human genomic DNA and sites where editing may occur are identified biochemically, are important tools. Existing biochemical approaches for off-target discovery recognize double-stranded breaks generated by nuclease-based gene editors such as SpCas9, but novel approaches are needed for new editing modalities, such as prime editing, that nick one strand of DNA. To fill this gap, we have developed 3'-end ligation sequencing (PEG-seq), which can identify prime editor-induced nicks throughout the genome on in vitro digested human genomic DNA to identify potential off-target sites. Here we show that PEG-seq is an important addition to the off-target detection toolkit, enabling off-target discovery for DNA nicking gene editors such as prime editors.


Figures

Figure 1.
Figure 1.
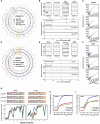
Development and validation of PEG-seq as a genome-wide nick detection method. (A) Diagram of PEG-seq protocol for capture of single-strand breaks (SSBs) in DNA induced by an enzyme. (B) PEG-seq detection of nicks from Nb.BsrDI-treated DNA visualized using IGV (Robinson et al. 2011) with a ∼280 kb region view and zoom-in (52 bp) to one peak showing a pileup of reads next to the Nb.BsrDI enzyme recognition site. (C) Overlap (dark brown) between Nb.BsrD1 PEG-seq replicates and sites identified by in silico analysis across the genome. (D) The motif identified from PEG-seq sites is identical to that of the Nb.BsrD1 recognition site (GCAATG). (E,F) Identification of peaks in PEG-seq data at the on-target site for the prime editor, SpCas9H840A, SpCas9D10A, and SpCas9 complexed with sgRNA targeting FANCF (E) or RNF2 (F) sequences. (Top) Genomic region around the target site in IGV indicating one significant peak in all treated conditions. (Bottom) Zoomed-in view of signal around the spacer sequence of the on-target site; reads from two replicates are shown with base pair resolution (indicated by dark and light shading). As expected, reads from the SpCas9D10A data set are on the target strand, and prime editor or SpCas9H840A shows accumulation of reads on the nontarget strand; SpCas9 shows reads on both strands as it maintains both enzymatic activities. The expected site of canonical nicking is indicated with a dashed line and aligns with the target strand (SpCas9D10A) signal, whereas the nontarget strand signal (prime editor, SpCas9H840A, SpCas9) is offset by 4–6 nucleotides.
Figure 2.
Figure 2.
PEG-seq protocol detects off-target SSBs generated by SpCas9, prime editor, and SpCas9D10A genome-wide. (A,D) Circle plot of genome-wide PEG-seq signal for each indicated enzyme for the FANCF (A) or RNF2 (D) guide RNA. (B,E) Zoom-in on 100 Mb of Chromosome 11 showing the on-target site for FANCF guide (B) or 100 Mb on Chromosome 1 for the RNF2 guide (E) and the off-target signal that is apparent in enzymes with only the RuvC (prime editor) or only HNH activity (SpCas9D10A) or both (SpCas9). (C,F) Analysis of SpCas9 signal plotted against either prime editor, SpCas9D10A counts, or the sum of the PE and SpCas9D10A counts for FANCF (C) or RNF2 (F) guides. As expected the SpCas9 signal is strongly predicted by the sum of the signals of the two individual enzymatic activities. (G, top) Position-weight matrices for all sites identified with PEG-seq using the FANCF or RNF2 sgRNA and prime editor, SpCas9D10A, or SpCas9H840A proteins. (Bottom) Line plots of the most frequent bases at each position in the spacer and PAM for the top 100 sites as identified by PEG-seq for FANCF and RNF2. (H,I) Plots of fraction of sites identified by PEG-seq at each score threshold that are within six mismatches or gaps of the indicated spacer sequence.
Figure 3.
Figure 3.
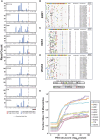
PEG-seq can detect in vitro off-target nicking by the prime editor. (A,B, left) Sorted list of top 25 highest signal peaks in PEG-seq data for FANCF (A) or RNF2 (B) sgRNA spacer sequences. For each site, the alignment to the spacer sequence is indicated with any mismatches (colored boxes) or gaps (black boxes), average read number, genomic location, and overlap with SpCas9 off-target data sets for CIRCLE-seq or GUIDE-seq shown for each potential off-target site. (Right) Plots of the top five sites for each spacer are shown for two replicates (indicated by shading) displaying the accumulation of DNA breaks across the spacer sequence with strand and base pair resolution. It is notable that the precise position of the reads relative to the expected canonical nick site (gapped line) varies across sites and is notably left-shifted at the on-target site. (C,D) Venn diagrams of genome-wide sites identified by PEG-seq, CIRCLE-seq, and in silico analysis (sites six or fewer mismatches or gaps in the human genome) for the FANCF (C) and RNF2 (D) spacers.
Figure 4.
Figure 4.
PEG-seq detects off-target sites for a variety of spacer sequences. (A) Distribution of reads at the on-target for each of the indicated spacer sequences. Note that although the majority of signal comes from the nontarget strand (blue), a small amount of signal is observed on the target strand (red) for some spacers (e.g., HEK4). Data from replicate experiments are plotted for each site indicated by bar shading. (BD) Sorted list of top 25 highest signal peaks in PEG-seq data for EMX1 (B), HEK3 (C), and VEGFA (D). For each site, the alignment to the spacer sequence is indicated with any mismatches (colored boxes) or gaps (black boxes), average read number, genomic location, and overlap with SpCas9 off-target data sets for CIRCLE- or GUIDE-seq shown for each potential off-target site. (E) Plot of the fraction of sites identified by PEG-seq at each score threshold that are within six mismatches or gaps of the indicated spacer sequence.
Figure 5.
Figure 5.
Analysis of PEG-seq identified off-targets in edited cells for SpCas9, and prime editor validates the ability of PEG-seq to identify editing sites in cells and shows RT extension at the on-target and infrequently at the identified off-target sites. (A) Hybrid capture analysis of SpCas9 and PE edited cells for the HEK4 (left) and VEGFA (right) pegRNAs. The top 250 sites identified by PEG-seq were analyzed, and the indel rate minus mock edited sample is shown averaged across two replicates. Each on-target is identified, and the prime editor off-target is shown in the inset plot (N = 2). (B) Overview of the targeted PEG-seq method used to analyze in cellulo generated DNA nicks and flaps at each corresponding on- and off-target site. (C,D) For each on- and off-target site, a representative IGV plot displays the mapped sequencing reads (purple blocks) and the read coverage at each position (gray bars) for prime editor and SpCas9 samples. (C,D) A PEG-seq signal plot is included with each IGV plot to display the count of reads that start at a given position. In all samples, the SpCas9 signal is apparent with a strong accumulation at the predicted nick site or 1–5 bp 5′ to that site (nick site is indicated by a broken line). A “scaffold” region is included to depict reads demonstrating RTT extension (seen as an accumulation of read start sites 3′ to the predicted nick location) that would not align to the reference sequence. The PE signal, including RTT extension, is apparent as the dominant signal at each on-target site (left) and is measurable, albeit at low frequency, in the off-target sites (right).

References

    1. Amemiya HM, Kundaje A, Boyle AP. 2019. The ENCODE blacklist: identification of problematic regions of the genome. Sci Rep 9: 9354. 10.1038/s41598-019-45839-z - DOI - PMC - PubMed
    1. Anzalone AV, Randolph PB, Davis JR, Sousa AA, Koblan LW, Levy JM, Chen PJ, Wilson C, Newby GA, Raguram A, et al. 2019. Search-and-replace genome editing without double-strand breaks or donor DNA. Nature 576: 149–157. 10.1038/s41586-019-1711-4 - DOI - PMC - PubMed
    1. Cameron P, Fuller C, Donohoue PD, Jones BN, Thompson MS, Carter MM, Gradia S, Vidal B, Garner E, Slorach EM, et al. 2017. Mapping the genomic landscape of CRISPR–Cas9 cleavage. Nat Methods 14: 600–606. 10.1038/nmeth.4284 - DOI - PubMed
    1. Cao B, Wu X, Zhou J, Wu H, Liu L, Zhang Q, DeMott MS, Gu C, Wang L, You D, et al. 2020. Nick-seq for single-nucleotide resolution genomic maps of DNA modifications and damage. Nucleic Acids Res 48: 6715–6725. 10.1093/nar/gkaa473 - DOI - PMC - PubMed
    1. Chaudhari HG, Penterman J, Whitton HJ, Spencer SJ, Flanagan N, Lei Zhang MC, Huang E, Khedkar AS, Toomey JM, Shearer CA, et al. 2020. Evaluation of homology-independent CRISPR-Cas9 off-target assessment methods. CRISPR J 3: 440–453. 10.1089/crispr.2020.0053 - DOI - PMC - PubMed

LinkOut - more resources