. 2025 Aug 5;16(1):7201.
doi: 10.1038/s41467-025-62277-w.

Observation of a bilayer superfluid with interlayer coherence

Affiliations

Observation of a bilayer superfluid with interlayer coherence

Erik Rydow et al. Nat Commun. .

Abstract

Controlling the coupling between different degrees of freedom in many-body systems is a powerful technique for engineering novel phases of matter. We create a bilayer system of two-dimensional (2D) ultracold Bose gases and demonstrate the controlled generation of bulk coherence through tunable interlayer Josephson coupling. We probe the resulting correlation properties of both phase modes of the bilayer system: the symmetric phase mode is studied via a noise-correlation method, while the antisymmetric phase fluctuations are directly captured by matter-wave interferometry. The measured correlation functions for both of these modes exhibit a crossover from short-range to quasi-long-range order above a coupling-dependent critical point, thus providing direct evidence of bilayer superfluidity mediated by interlayer coupling. We map out the phase diagram and interpret it with renormalization-group theory and Monte Carlo simulations. Additionally, we elucidate the underlying mechanism through the observation of suppressed vortex excitations in the antisymmetric mode.


Conflict of interest statement

Competing interests: The authors declare no competing interests.

Figures

Fig. 1
Fig. 1. Formation of a bilayer quasi-2D Bose gas and its characterization by matter-wave interferometry.
a We trap two near-homogeneous clouds of 87Rb atoms (represented by wave functions Ψ1 and Ψ2, with complex phases ϕ) in a double-well potential, where the inter-well distance d is controlled using a multiple-RF dressing technique; see text. This results in a bilayer system with a tunable interlayer coupling J. The top panel shows the radially averaged density profile, obtained from a single in-situ image taken along the z direction. The green-shaded region indicates the box potential shape, which is created by a ring-shaped, blue-detuned laser beam. b Theoretical phase diagram of our coupled bilayer system based on RG analysis and Monte Carlo simulation (see Supplemental Material). Increasing the interlayer coupling J increases the transition temperature T, towards T/T0 ~ 2,, where T0 denotes the transition temperature for J = 0. Illustrations show unbound vortex pairs in the normal phase and bound vortex pairs in the double-layer superfluid (DLSF) phase. In the anti-symmetric superfluid (ASF) phase, vortices are bound in the relative-mode but unbound in the common-mode. c Clouds released from the trap undergo a time-of-flight (TOF) expansion for a duration of tTOFrel=17 ms, so that they overlap producing interference fringes (blue wavy planes) encoding the local relative phase fluctuations. We capture the interference pattern by selectively imaging atoms within a thin slice of thickness Ly = 5 μm (shown as a red sheet; see text). The column interference profiles at different x allow us to extract the local relative phase θ(x). d After a short TOF of tTOFcom=5.3 ms, we image the in-plane density distribution n(r) from below using a selective imaging technique (thin repumping sheet with thickness Lz = 5 μm). Image on the right displays n(r)/nm, where nm is the maximum density.
Fig. 2
Fig. 2. Phase coherence of the relative mode in the coupled bilayer.
a Two-point relative-phase correlation function C(x,x) is shown for phase-space densities D=6.5 and 3.4, with an inter-well distance of d = 1.7 μm. b Correlation function C(x¯) plotted as a function of the distance x¯=xx, measured at d = 1.7 μm for five different values of D=7.6,5.9,5.0,4.2 and 3.4 (from top to bottom). c C(x,x) is shown for D=7.5, with inter-well distances of d = 1.7 μm and 4.5 μm. d, C(x¯) is measured at D=7.5 for four inter-well distances d = 1.7, 2.3, 3.0 and 4.5 μm (from top to bottom). In (b, d), solid lines represent fits using an algebraic model, while dashed lines represent exponential model fits. Insets show χr2 values for the algebraic (filled symbols) and exponential (open symbols) fit models.
Fig. 3
Fig. 3. Phase coherence of the common mode.
a, b Noise correlation functions g~2(r)/g~2(0) are shown for D=6.9 and 3.8, with an inter-well distance d = 1.7 μm. c Radially averaged noise correlation functions g~2(r) are presented for values in the range from D=3.5 to 7.1, at d = 1.7 μm, where the lines connecting the points are the guide to the eye. Inset shows the χr2 values for the two fit models at different D values (see text). Fitting is performed for r > 2 μm to exclude the effect of finite imaging resolution. d, e Measurements of the algebraic exponent η for both the common and relative modes, along with simulation results, are shown for d = 5.9 μm and 3 μm. The black (red) shaded region represents the critical points and their uncertainty in the relative (common) phase, obtained from experimental data, determined by the range over which the χr2 values for the models cross (see Supplemental Material).
Fig. 4
Fig. 4. Phase diagram of the coupled bilayer 2D Bose gas.
Measurements of the critical phase-space density Dc for both the relative (circles) and common (squares) modes are compared with the results from Monte Carlo simulations (filled curves). The solid lines are the predictions from the RG theory for two coupled 2D Bose gases (see Supplemental Material). The coupling strength J (horizontal axis at the top) varies exponentially with the interlayer separation d shown on the bottom axis (see Supplemental Material).
Fig. 5
Fig. 5. Vortex suppression.
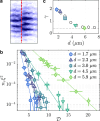
a Phase jumps, corresponding to vortices (as indicated by the red dashed line), emerge in the interference patterns as the system approaches the transition point. b Dimensionless vortex density nvξ2 plotted on a log scale as a function of the phase-space density D for various values of d. nv is obtained by averaging over multiple experimental repetitions, with over 20 possible vortex locations sampled on each image giving a total of nearly 1000 possible locations for each datapoint, ensuring sufficient statistics for the parameter range shown. The solid lines denote exponential fits to the function f(D)=Aexp(γD), where A and γ are fitting parameters. c The best-fit values of the exponent γ are shown, with the horizontal dashed line marking the value for an uncoupled system (d = 7 μm), as reported in ref. . The empty circles are the results obtained from Monte Carlo simulations.

References

    1. Makhlin, Y., Schön, G. & Shnirman, A. Quantum-state engineering with Josephson-junction devices. Rev. Mod. Phys.73, 357 (2001).
    1. Degen, C. L., Reinhard, F. & Cappellaro, P. Quantum sensing. Rev. Mod. Phys.89, 035002 (2017).
    1. Langen, T. et al. Experimental observation of a generalized Gibbs ensemble. Science348, 207 (2015). - PubMed
    1. Schweigler, T. et al. Experimental characterization of a quantum many-body system via higher-order correlations. Nature545, 323 (2017). - PubMed
    1. Berezinskii, V. Destruction of long-range order in one-dimensional and two-dimensional systems possessing a continuous symmetry group. II. Quantum systems. Sov. Phys. JETP34, 610 (1972).

LinkOut - more resources