. 2025 Aug 5;16(1):7187.
doi: 10.1038/s41467-025-62115-z.

Inhibition mediated by group III metabotropic glutamate receptors regulates habenula activity and defensive behaviors

Affiliations

Inhibition mediated by group III metabotropic glutamate receptors regulates habenula activity and defensive behaviors

Anna Maria Ostenrath et al. Nat Commun. .

Abstract

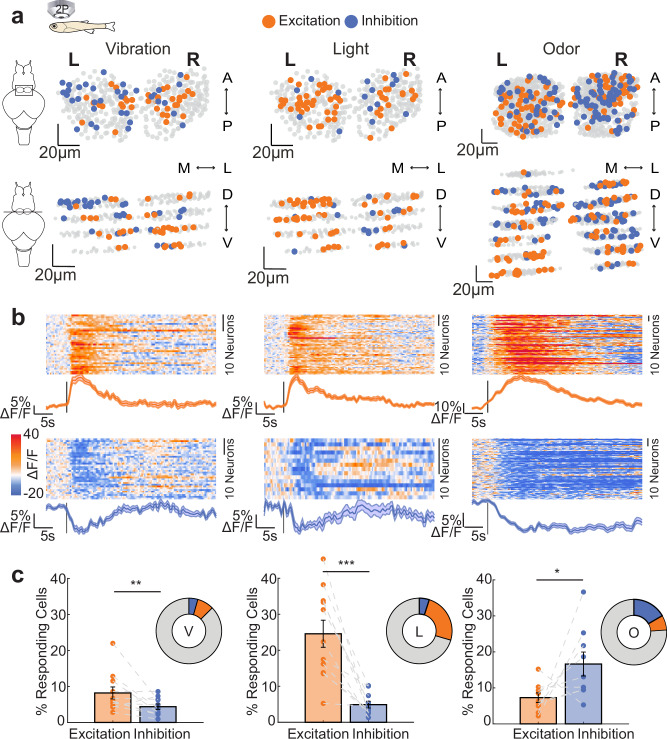
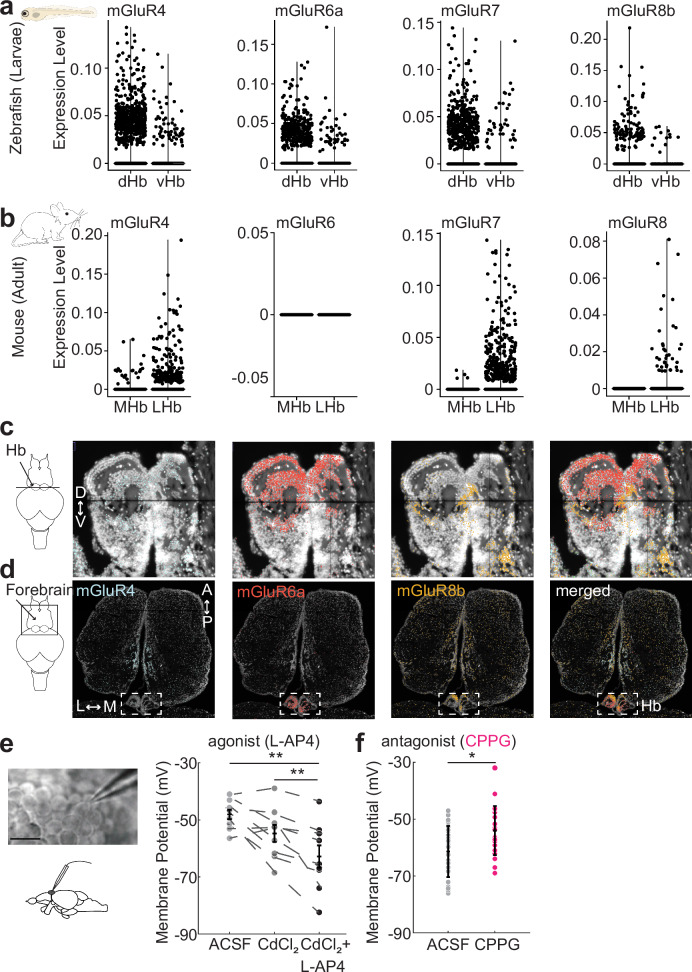
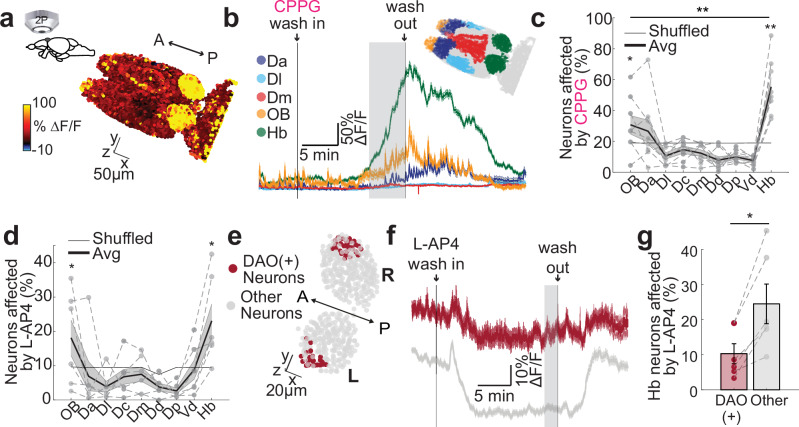
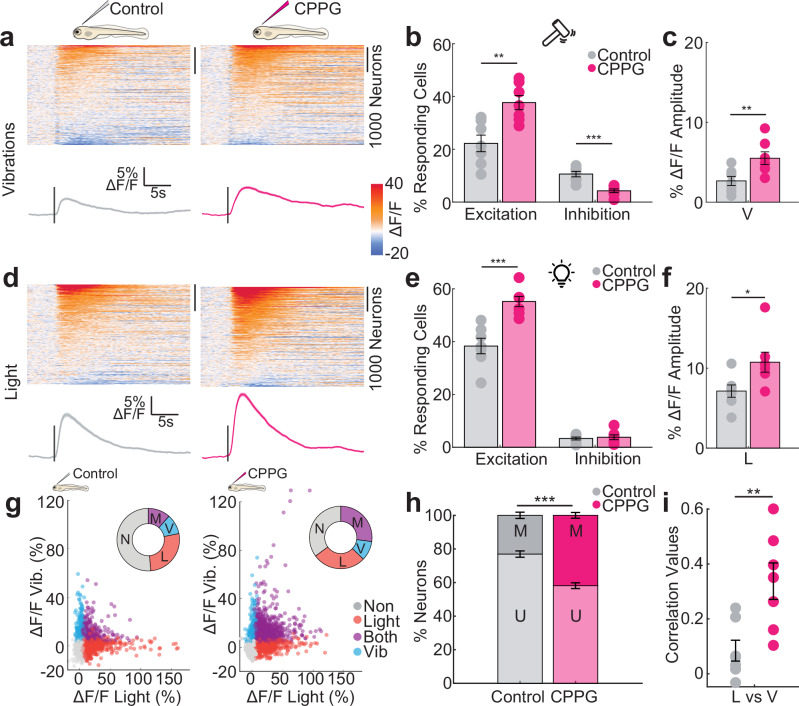
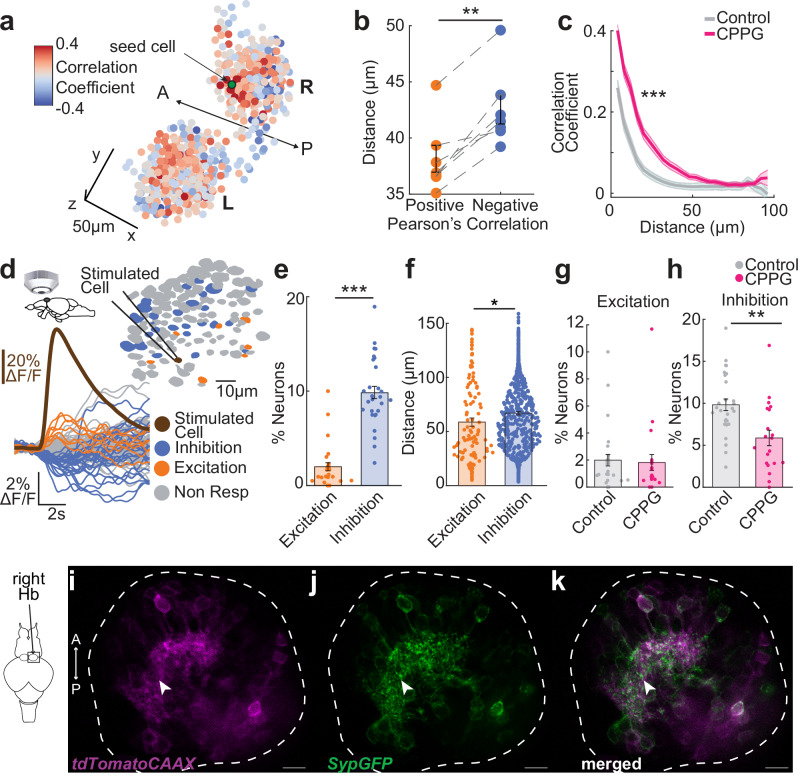
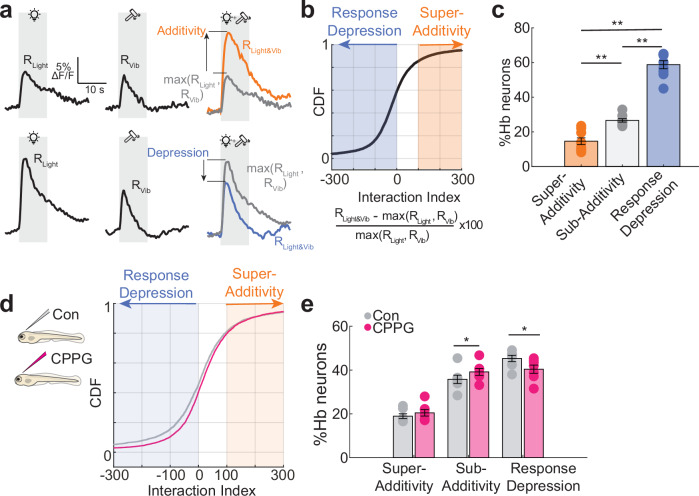
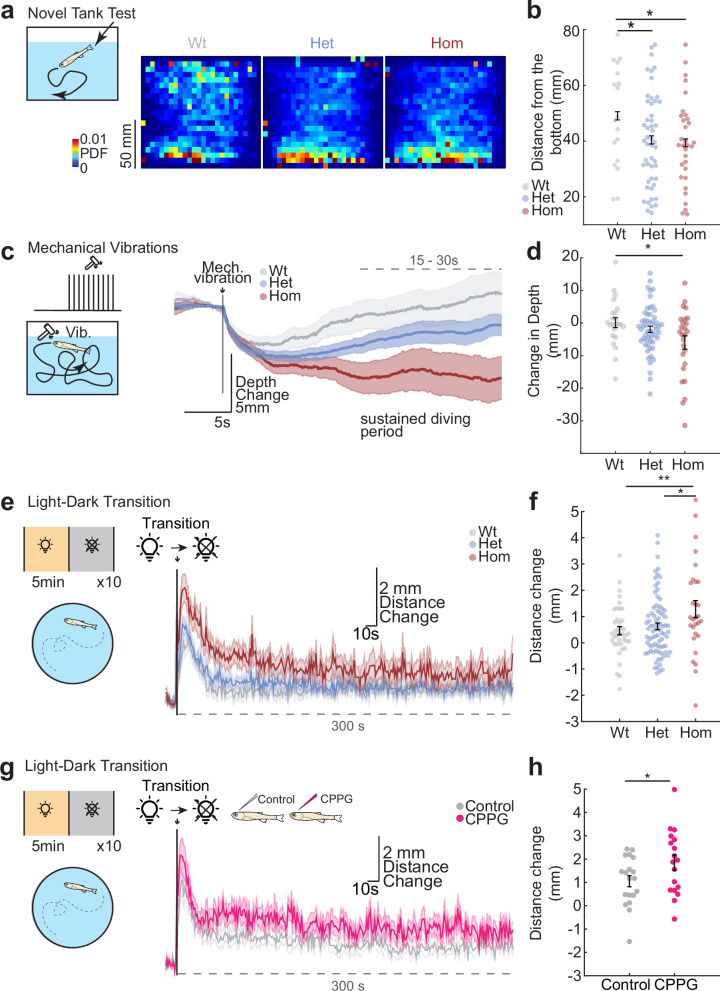
Inhibition plays a key role in brain functions. While typically linked to GABA, inhibition can be induced by glutamate via metabotropic glutamate receptors (mGluRs). Here, we investigated the role of mGluR-mediated inhibition in the habenula, a conserved, glutamatergic brain hub involved in adaptive and defensive behaviors. We found that zebrafish and mice habenula express group III mGluRs. We showed that group III mGluRs regulate membrane potential and calcium activity of zebrafish habenula. Perturbing group III mGluRs increased sensory-evoked excitation and reduced selectivity. We identified inhibition as the primary communication mode among habenula neurons. Blocking group III mGluRs reduces this inhibition and increases neural synchrony. Consistently, we demonstrated that multisensory integration in the habenula relies on competitive suppression, that partly depends on group III mGluRs. Genetic and pharmacological perturbation of group III mGluRs amplified neural responses and defensive behaviors. Our findings highlight an essential role for mGluR-driven inhibition in encoding information and regulating defensive behaviors.


Conflict of interest statement

Competing interests: The authors declare no competing interests.

Figures

Fig. 1
Fig. 1. Habenular neurons respond to vibration, light and odors with both excitation and inhibition.
a Representative examples showing the location of responding neurons in three-dimensional Hb reconstruction in Tg(elavl3:GCaMP6s) juvenile zebrafish in the dorsal-ventral view (top) and the coronial view (bottom). Neurons are color-coded by their response to vibration (left), light (middle) and odor (amino acid mixture, right). Neurons with activity 2 STD higher than baseline are orange (excitation), 1 STD smaller than baseline are blue (inhibition), non-responding neurons are grey. Scale bar represents 20 μm in x, y and z direction. L left, R right, A anterior, P posterior; D dorsal, V ventral, M-L medial to lateral. b Time-courses of habenular calcium signals (ΔF/F) of the excited (top) and inhibited (bottom) neurons from panel (a) to the vibration (left), light (middle) and odor (right) stimulations. In the heatmap warm colors indicate excitation, cold colors represent inhibition. Orange and blue colored lines represent average excitation and inhibition, respectively. Stimulus onset is indicated by the black line. Shadow represents +/- SEM. c Percentage of excited and inhibited habenular neurons upon vibration (left, n = 11 fish, **p = 0.0098), light (middle, n = 11 fish, ***p = 0.0005) and odor (right, n = 9 fish, *p = 0.0273) stimulations. (one-sided Wilcoxon signed-rank test). Error bar represents mean +/- SEM. Also, see Supplementary Fig. 1. Source data are provided as a Source Data file.
Fig. 2
Fig. 2. Group III mGluRs are expressed in vertebrate habenula and directly regulate neuronal membrane potential.
a, b Scatter plots show the mRNA expression of group III mGluRs in zebrafish dorsal (dHb) and ventral (vHb) habenula (a) and mouse medial (MHb) and lateral (LHb) habenula (b). c, d High-resolution spatial transcriptomics (n = 2 fish) for mGluR4 (blue), mGluR6a (red), and mGluR8b (orange) in adult zebrafish habenula (c, coronal section), and dorsal forebrain (d, horizontal section), along the dorsal-ventral (D dorsal, V ventral), anterior-posterior (A anterior, P posterior) and medial-lateral (M medial, L lateral) axes. Arrow in c points to the habenula (Hb) and arrow in (d) points to the forebrain. Box in (d) with dashed lines indicates habenula. e Left: Example image of whole-cell patch clamp recording of a zebrafish habenula neuron. Scale bar represents 10 μm., Membrane potential measured by whole-cell patch clamp recordings in dHb neurons of juvenile (21dpf) zebrafish brain explants, during control conditions (ACSF, light grey), with cadmium chloride (CdCl2, 100 μM, dark-grey) and with CdCl2 (100 μM) + L-AP4 (10 μM) (black). Note that group III mGluR agonist L-AP4 decreases the membrane potential of habenula neurons significantly compared to control and CdCl2, conditions. (n = 9 fish/neurons, ACSF vs CdCl2 p is n.s., ACSF vs CdCl2 + L-AP4 **p = 0.0039, CdCl2 vs CdCl2 + L-AP4 **p = 0.0039, two-sided Wilcoxon signed-rank test.). f Membrane potential of habenula neurons during control condition (ACSF, grey) and with group III mGluR antagonist CPPG (300μM, pink). Note that CPPG significantly increases the membrane potential of habenula neurons compared to control conditions. (ACSF n = 37 neurons, CPPG n = 22 neurons, *p = 0.0109, two-sided Wilcoxon rank sum test.). Error bars represent mean +/- SEM. Scattered dots represent individual fish. See also Supplementary Fig. 2. Source data are provided as a Source Data file.
Fig. 3
Fig. 3. Pharmacological targeting of group III mGluRs can specifically activate and inhibit zebrafish dorsal habenula and the olfactory bulbs.
a 3D reconstructions of calcium signals (ΔF/F) from representative juvenile Tg(elavl3:GCaMP6s-nuclear) zebrafish forebrain in response to bath application of group III mGluR antagonist CPPG (300 μM). Warm colors represent stronger activation. b Average time courses of calcium signals from anatomically identified forebrain regions (Dorso-anterior (Da): blue, Dorso-lateral (Dl): cyan, Dorso-medial (Dm): red, olfactory bulb (OB): yellow, habenula (Hb): green) in response to CPPG application. Lines indicate the wash in and out, grey area shows the period used to calculate affected neurons in c. Shadow represents +/-SEM. Delineated forebrain regions are color-coded. c, d Percentage of neurons in anatomically identified forebrain regions that are affected by CPPG (c) or L-AP4 (0.1 μM) (d). Affected means that neuronal calcium signals were 2STD above or below the baseline during 5 min drug period (shaded grey in B or F). Scatters corresponding to individual fish are connected with dashed lines. The thick black line is the mean; shadow presents SEM. Grey line represents the shuffle distribution. Neurons in the olfactory bulb and the habenula are significantly more affected above chance levels (CPPG n = 8 fish, OB *p = 0.0391, Hb **p = 0.0039; L-AP4 n = 6 fish, OB *p = 0.0469, Hb *p = 0.0156, rest is n.s., one-sided Wilcoxon signed-rank test). Habenula neurons show significantly stronger CPPG responses than olfactory bulb (**p = 0.0039, one-sided Wilcoxon signed-rank test). Dc:dorso-central, Dp:dorso-posterior, Vd:ventral-dorsal. e Zebrafish habenula expressing Tg(dao:GAL4VP16; UAS-E1b:NTR-mCherry) and Tg(eval3:GCaMP6-nuclear). Dao-positive ventral habenula neurons are indicated in dark red. f Average time courses of calcium signals of dao-positive neurons from example habenula in “e” (dark red) and the other habenula neurons (grey). Wash in and out of L-AP4 is indicated by grey lines. The grey area indicated the period for affected cell calculation. Shadow represents SEM. g Significantly smaller fraction of dao-positive (DAO(+)) ventral habenula neurons are inhibited by the application of group III mGluR agonist L-AP4, when compared to the rest of habenular neurons (n = 6 fish, *p = 0.0156, one-sided Wilcoxon signed-rank test). Scatters corresponding to individual fish are connected with dashed lines. L left, R right, A anterior, P posterior. Scale bar represents 50 (a) and 20 μm (e). Error bars: mean +/- SEM. See also Supplementary Fig. 3. Source data are provided as a Source Data file.
Fig. 4
Fig. 4. Pharmacological blocking of group III mGluRs amplifies the magnitude and reduces the selectivity of sensory responses of habenular neurons.
Heatmaps represent the time courses of habenular calcium signals (ΔF/F) in responses to vibrations (a) or light (d) recorded by two-photon calcium imaging in Tg(elavl3:GCaMP6s) larval zebrafish. Left: control-injected (n = 3732 neurons, 7 fish) or right: 5 mM CPPG-injected (n = 4024 neurons, 7 fish). Warm colors indicate excitation, cold colors represent inhibition. Average traces of all habenula neurons are below each heatmap. Stimulus onset is indicated by a line. Shadow represents +/-SEM. Percentage of excited (2 STD above baseline) or inhibited (1 STD below baseline) habenula neurons for control (grey) or CPPG-injected (pink) fish in response to mechanical vibrations (b) or light (e) stimulation. (Control n = 7 fish, CPPG n = 7 fish, vibration: excitation **p = 0.0020, inhibition ***p = 0.0003; light: excitation: ***p = 0.0003, inhibition: p is n.s., one-sided Wilcoxon rank sum test). c,f Average ΔF/F Amplitude (%) during the response period of all habenula neurons in each fish. (Control n = 7 fish, CPPG n = 7 fish, vibration: **p = 0.0087; light: *p = 0.0189, one-sided Wilcoxon rank sum test). g Responses of individual habenula neurons to mechanical vibration (blue), light (red) or both (magenta) for control and CPPG injected fish. The donut chart represents the ratio of habenula neurons and their response type (2 STD above baseline levels). N: non-responding, V: only vibrations, L: only light, M: both vibrations and light. h Percentage of unimodal (U) habenula neurons that respond exclusively to either light (L) or vibrations (V) versus multimodal (M) neurons responding to both light and vibrations. (Control n = 7 fish, CPPG n = 7 fish, ***p = 0.0003, one-sided Wilcoxon rank sum test). i Pearson’s correlation of multi-neuronal response vectors in the habenula for mechanical vibrations (V) and light (L) (Control n = 7 fish, CPPG n = 7 fish, **p = 0.0035, one-sided Wilcoxon rank sum test). Error bars represent mean +/- SEM. Scattered dots represent individual fish. See also Supplementary Figs. 4, 5, 6 and 7. Source data are provided as a Source Data file.
Fig. 5
Fig. 5. Group III mGluRs play an important role in coordinating spontaneous habenular activity and mediating inhibitory interactions between habenular neurons.
a Pearson’s correlations of spontaneous activity between Hb neurons and a seed neuron (green) in Tg(elavl3:GCaMP6s) larval zebrafish. Red means high and blue low correlations. Scale bar represents 20 μm. L left, R right, A anterior, P posterior. b Average distance between Hb neuron pairs that are significantly positively or negatively correlated. Positive correlated neurons are significantly closer than negative ones. (n = 7 fish, **p = 0.0035, one sided Wilcoxon signed-rank test). c Pairwise Pearson’s spontaneous activity correlation of habenula neurons as a function of distance (μm) in control (grey) versus 5 mM CPPG-injected fish (pink). CPPG-injected animals exhibit stronger correlations over longer distances. Shadow represents +/-SEM. (Control: n = 14 hemispheres from 7 fish, CPPG-injected: n = 14 Hb hemispheres from 7 fish, ANOVA-n displayed significance over distances ***p = 1.8 × 10-11 and over treatment groups ***p = 0.0004). d Calcium imaging of Tg(eval3:GCaMP6-nuclear) juvenile zebrafish brain explant while simultaneously stimulating a single cell via whole-cell recording, brown: stimulated neuron, orange: excited, blue: inhibited, grey: non-responding. Example calcium traces are shown on the left (ΔF/F). e Percentage of habenula neurons excited or inhibited upon single habenular neuron micro-stimulation. Significantly more cells are inhibited than excited (n = 28 stimulated individual neurons, ***p = 0.00007, two-sided Wilcoxon signed-rank test. f Distance (μm) of the responding neuron (excited, orange or inhibited: blue) to the micro-stimulated neuron. Inhibited neurons are significantly more distant to the stimulated neurons than the excited ones (n = 104 excited neurons and n = 558 inhibited neurons after 28 stimulated neurons, *p = 0.0291, two-sided Wilcoxon signed-rank test)(g, h) Percentage of habenula neurons increasing (Excitation, g) or decreasing (Inhibition, h) their fluorescence upon single cell stimulation during control conditions or during bath application of 300 μM CPPG. Significantly less cells are inhibited when 300 μM CPPG is applied, but no difference for the fraction of excited neurons. (ACSF n = 28 stimulated neurons; CPPG n = 19 stimulated neurons, Excitation p is n.s; Inhibition **p = 0.007 two-sided Wilcoxon rank sum test). Note that the control data is same as in (e). ik Confocal microscopy images of tissue-cleared Tg(narp:GAL4VP16;UAS:Synaptophysin–GFP-T2A-tdTomato-CAAX) juvenile zebrafish (n = 5 fish). Colors represent tdTomatoCAAX (magenta) and Synaptophysin–GFP (Syp-GFP, green). Dorsal habenula neurons expressing tdTomatoCAAX (i), Synaptophysin–GFP (j) and merged (k). White line delineate the habenula. Scale bar represents 10 μm. White arrow points at Synaptophysin–GFP on the dendritic processes of narp labelled dorsal habenula neurons. A anterior, P posterior. See also Supplementary Fig. 8. Error bars represent mean +/- SEM. Scattered dots represent individual fish (b) or neurons (eh). Source data are provided as a Source Data file.
Fig. 6
Fig. 6. The role of group III mGluRs in multi-sensory stimulus competition in zebrafish habenula.
a Example traces of habenula neurons responding to light, vibration and light and mechanical vibrations simultaneously. Upper traces show an example of additivity (orange), where combined light+vibration response (RLight&Vib) is larger than the largest individual light and vibration responses (RLight and RVib black). Bottom traces show an example of depression (blue) where combined light+vibration response is smaller than the largest of individual light or vibration responses (black). In grey, the maximum response (either light or vibration, max(RLight,RVib)) is shown. Grey traces near colored traces show the comparison of combined response to the largest of either light or vibration responses. b Cumulative distribution function of the interaction index for all habenula neuron in each fish (n = 5242 neurons in 9 fish). Values below 0 (blue shadow) are classified as response depression, values above 100 (orange shadow) are classified as super-additivity. Values between 0 and 100 are classified as sub-additivity. Data points above 300 and below −300 are not shown. c Percentage of neurons in categories of super-additivity, sub-additivity and response depression after calculation of the interactive index. There are significantly more neurons showing response depression than super-additivity or sub-additivity (n = 9 fish, Super-Additivity vs Sub-Additivity **p = 0.0039, Sub-Additivity vs Response Depression **p = 0.0020, Super-Additivity vs Response Depression p = 0.0020, one-sided Wilcoxon signed-rank test). d Interactive index of habenula neurons from control-injected (grey, n = 3732 neurons in 7 fish) and 5 mM CPPG-injected fish (pink, n = 4024 neurons in n = 7 fish). Data points above 300 and below −300 are not shown. e Percentage of neurons falling into the categories after calculation of the interaction index. Significantly less neurons show response depression in CPPG-injected fish as well as more cells falling into the sub-additivity category. (Control n = 7 fish, CPPG n = 7 fish, Super-Additivity p is n.s., Sub-Additivity *p = 0.0487, Response Depression *p = 0.0189, one-sided Wilcoxon rank sum test). Error bars represent mean +/- SEM. Scattered dots represent individual fish. Source data are provided as a Source Data file.
Fig. 7
Fig. 7. Genetic perturbation of mGluR6a enhances sustained defensive behaviors in juvenile zebrafish.
a Novel vertical tank diving test of free-swimming in wildtype (Wt, grey), heterozygous (Het, blue), homozygous (Hom, red) mGluR6a mutant zebrafish. Average probability density (PDF) of the fish position, during the first 2 minute in the novel tank. Warmer colors mean higher probability. b Distance from the bottom (mm) during the first 2 min. Note that Het and Hom are significantly closer to the bottom when compared to Wt fish (Wt n = 18 fish, Het n = 50 fish, Hom n = 32 fish, Wt vs Het *p = 0.0405, Wt vs Hom *p = 0.0337, Het vs Hom is n.s., one-sided Wilcoxon rank sum test). c Mechanical vibrations are delivered to free-swimming juvenile zebrafish (vertical tank). Average diving depths evoked by mechanical vibrations. Dashed line indicates the sustained period used for statistical comparisons in (d). d Sustained diving depth following mechanical vibrations is shown for the three groups. Homozygous mGluR6a mutants dive significantly deeper (Wt n = 23 fish, Het n = 54 fish, Hom n = 26 fish. Wt vs Het p is n.s., Wt vs Hom *p = 0.0231, Het vs Hom is n.s., one-sided Wilcoxon rank sum test). e, g Sustained increase in free swimming speed evoked by Light-Dark transition (horizontal tank). Average swimming distances (mm) are plotted for mGluR6a mutant Hom: red, Het: blue, Wt: grey in (e) and for 5 mM CPPG- (pink) and control-(grey) injected juvenile fish. Arrow indicate the light to dark transition. Dashed lines indicate the sustained increase in swimming rate evoked by light-dark transition used for statistics in (f) and (h). f Homozygous mGluR6a mutants swim significantly more (mm) upon light and dark transition (Wt n = 39 fish, Het n = 80 fish, Hom n = 29 fish Wt vs Het p is n.s., Wt vs Hom **p = 0.0068, Het vs Hom *p = 0.0178., one-sided Wilcoxon rank sum test). h CPPG-injected fish swim significantly more (mm) upon light and dark transition (Control n = 19 fish, CPPG n = 18 fish, *p = 0.0288, one-sided Wilcoxon rank sum test). Shadow indicates +/-SEM. Error bars represent mean +/-SEM. Scattered dots represent individual fish. See also Supplementary Fig. 9 for imaging data of the mGluR6a mutant and Supplementary Fig. 10 for more behavior of the CPPG-injected fish. Source data are provided as a Source Data file.

Similar articles

References

    1. Roux, L. & Buzsaki, G. Tasks for inhibitory interneurons in intact brain circuits. Neuropharmacology88, 10–23 (2015). - PMC - PubMed
    1. Cossart, R. et al. Dendritic but not somatic GABAergic inhibition is decreased in experimental epilepsy. Nat. Neurosci.4, 52–62 (2001). - PubMed
    1. B. Ferguson, C. Glick, J. R. Huguenard, Prefrontal PV interneurons facilitate attention and are linked to attentional dysfunction in a mouse model of absence epilepsy. Elife12, e78349 (2023). - PMC - PubMed
    1. Pavlov, I., Kaila, K., Kullmann, D. M. & Miles, R. Cortical inhibition, pH and cell excitability in epilepsy: what are optimal targets for antiepileptic interventions?. J. Physiol.591, 765–774 (2013). - PMC - PubMed
    1. Semyanov, A., Walker, M. C. & Kullmann, D. M. GABA uptake regulates cortical excitability via cell type–specific tonic inhibition. Nat. Neurosci.6, 484–490 (2003). - PubMed

MeSH terms

LinkOut - more resources