Randomized Controlled Trial
. 2025 Aug 5;16(1):7192.
doi: 10.1038/s41467-025-62357-x.

Microhaplotype deep sequencing assays to capture Plasmodium vivax infection lineages

Affiliations
Randomized Controlled Trial

Microhaplotype deep sequencing assays to capture Plasmodium vivax infection lineages

Mariana Kleinecke et al. Nat Commun. .

Abstract

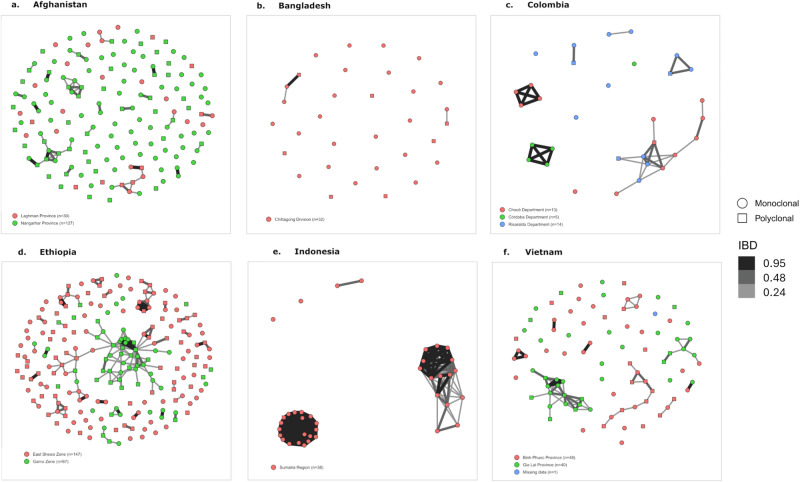
Plasmodium vivax elimination is challenged by dormant liver stages (hypnozoites) that can reactivate months after initial infection resulting in relapses. Relapsing infections confound antimalarial clinical efficacy trials due to the inability to distinguish between recurrences arising from blood-stage treatment failure (recrudescence), reinfection or relapse. Genetic relatedness of paired parasite isolates, measured by identity-by-descent (IBD), can provide important information on whether individuals have had single or multiple mosquito inoculations, thus informing on recurrence origin. We developed a high-throughput amplicon sequencing assay comprising 93 multi-SNP (microhaplotype) markers to determine IBD between P. vivax clinical isolates. The assay was evaluated in 745 global infections, including 128 infection pairs from a randomized controlled trial (RCT) (ClinicalTrials.gov NCT01680406). Simulations demonstrate low error in pairwise IBD estimation at the panel (RMSE < 0.12) and IBD-based networks illustrate strong clustering by geography. IBD analysis in the RCT demonstrates a lower frequency of suspected relapses or recrudescence in patients treated with primaquine compared to those without primaquine; the impact is greater when paired with chloroquine than with artemether-lumefantrine. Our results demonstrate the potential to derive new information on P. vivax treatment and transmission using IBD generated by amplicon sequencing data that can be further improved with time-to-event models.


Conflict of interest statement

Competing interests: The authors declare no competing interests.

Figures

Fig. 1
Fig. 1. P. vivax proportion of samples with more than 25 reads or more than 10 read pairs by country.
Heat maps illustrate the proportion of samples with more than 25 reads (a) and proportion of samples with more than 10 read pairs derived from DADA2 (b) for each marker by country. Markers (x-axis) were ordered by chromosome and coordinate. All samples with genotype failures ( < 25 reads or <10 read pairs) are presented in black. Microhaplotype markers 64721, 354590, 419038 and 466426 displayed consistently low read-pair counts. Data are presented on a total of 564 independent (not including replicates or recurrences) infections that passed genotyping. The data from Ethiopia are split into dried blood spots (DBS) from a clinical trial conducted in East Shewa Zone and whole blood (WB) extracts from a therapeutic efficacy survey conducted in Gamo Zone for comparative assessment. The DBS versus WB comparisons reveal similar read and read pair counts at all loci.
Fig. 2
Fig. 2. Microhaplotype-based within-host diversity trends.
a, b illustrate the level of concordance between genomic (as measured by the Fws) and microhaplotype (as measured by eMOI) data in estimation of within-host P. vivax diversity in 104 independent cases. The boxplots present the median, interquartile range and minimum and maximum value. Overall, high concordance is observed between the two datasets. c presents the eMOI distributions at the country using data on 562 independent cases. The boxplots present the median, interquartile range and minimum and maximum value. Each country is presented in a different colour.
Fig. 3
Fig. 3. Simulations of IBD estimation in different geographic areas using the microhaplotype panel.
Root mean square error (RMSE) of relatedness estimates based on data simulated using nine different data-generating relatedness estimates, r (specifically IBD of 0.01 [essentially unrelated], 0.05 [very low related], 0.1 [low related], 0.15 [low related], 0.2 [low related], 0.25 [half-sibling], 0.5 [sibling], 0.75 [highly related], and 0.99 [essentially clonally identical]) with switch rate parameter k set to 5. Data were generated using paneljudge software on 91 high performance microhaplotypes in independent infections from each population (see sample sizes within the figure). In all populations, half-siblings and siblings had the highest RMSE, but this remained below 0.12 in all cases. Each country is presented in a different colour.
Fig. 4
Fig. 4. IBD distributions by treatment and time to recurrence in a randomized controlled trial conducted in Ethiopia.
a presents the IBD distributions in initial and recurrent infection pairs across all pairs and grouped by treatment arm; AL (Artemether-Lumefantrine), CQ (Chloroquine), AL + PQ (AL + Primaquine) and CQ + PQ. Each treatment is presented with a different colour. b presents the same IBD data grouped by recurrences occurring less versus more than 120 days after the initial infection. Each boxplot presents the median, interquartile range and minimum and maximum value. Data are presented on recurrence pairs from 128 independent patients, with only one infection pair presented per patient to avoid potential bias (n = 128 patients, 256 samples). Majority (90%, 115/128) of pairs reflect day 0 and recurrence 1 time points. Where the day 0 or recurrence 1 infections failed genotyping or had inconclusive clinical metadata, consecutive pairs of recurrence 2 to 4 pairs were used instead as the patients received the same treatment up to recurrence 4.
Fig. 5
Fig. 5. Identity-by-state-based spatial patterns using AmpSeq and WGS data.
The plot presents an unrooted neighbour-joining tree derived from a distance matrix on the microhaplotype calls using genotypes derived from microhaplotype and WGS data at the microhaplotype marker positions only. The neighbour-joining tree illustrates largely distinct clustering by country, except for neighboring Cambodia and Vietnam, and Bangladesh and Thailand. In countries with both WGS (triangles) and AmpSeq data (circles), no evidence of clustering by sequencing method is observed; although separation is observed in Indonesia, the WGS data from this region derives from Papua Province, whilst the AmpSeq data derives from Sumatra Province, located on different islands nearly 2500 Km apart. The plots were generated using data on 728 independent, monoclonal infections.
Fig. 6
Fig. 6. IBD-based spatial patterns using microhaplotype data.
af present networks illustrating IBD-based connectivity between infections in Afghanistan (a), Bangladesh (b), Colombia (c), Ethiopia (d), Indonesia (e) and Vietnam (f). Each shape reflects an infection, colour-coded by site, and with shapes reflecting monoclonal (circle) versus polyclonal (square) infections. For each country, connectivity (illustrated by connecting lines on a grey scale between shapes) is presented at IBD thresholds ranging from ≥0.24 (thin, light grey lines) to ≥0.95 (thick, black lines). The baseline sample positions are based on the ~25% (0.24) IBD output. IBD measures were calculated on the microhaplotype calls using DCifer software. At the ~25% IBD threshold, large networks (10 or more connected infections) are largely confined to cases from the same site, with one or two cases connecting cases or other networks from different sites; these networks shrink with increasing IBD in all sites except for Sumatra, Indonesia, where the networks appear to reflect clonal clusters (retained at IBD ≥ 95%). All plots were generated using data on independent infections with sample sizes shown within the plots.
Fig. 7
Fig. 7. Amino acid frequencies at P. vivax drug resistance candidates.
The plots present frequency and corresponding upper and lower 95% confidence intervals (CIs) for the given amino acid changes in baseline population samples from each country. All frequencies reflect the suspected drug resistance-conferring amino acid. All plots were generated using independent, monoclonal samples (n = 372). Each country is presented in a different colour.

References

    1. WHO. World Malaria Report 2022. World Health Organization; Geneva 2022. (WHO, 2022).
    1. Auburn, S., Cheng, Q., Marfurt, J. & Price, R. N. The changing epidemiology of Plasmodium vivax: Insights from conventional and novel surveillance tools. PLoS Med.18, e1003560 (2021). - PMC - PubMed
    1. Douglas, N. M. et al. Mortality attributable to Plasmodium vivax malaria: a clinical audit from Papua, Indonesia. BMC Med.12, 217 (2014). - PMC - PubMed
    1. Commons, R. J. et al. Primaquine for uncomplicated Plasmodium vivax malaria in children younger than 15 years: a systematic review and individual patient data meta-analysis. Lancet Child Adolesc. Health8, 798–808 (2024). - PMC - PubMed
    1. Verma, R. et al. Safety and efficacy of primaquine in patients with Plasmodium vivax malaria from South Asia: a systematic review and individual patient data meta-analysis. BMJ Glob. Health8, 10.1136/bmjgh-2023-012675 (2023). - PMC - PubMed

Publication types

MeSH terms

Associated data

LinkOut - more resources