

Biotransformation by beta glucosidase enhances anti inflammatory metabolites in licorice using untargeted metabolomics
- PMID: 40764312
- PMCID: PMC12325765
- DOI: 10.1038/s41538-025-00533-5
Biotransformation by beta glucosidase enhances anti inflammatory metabolites in licorice using untargeted metabolomics
Abstract
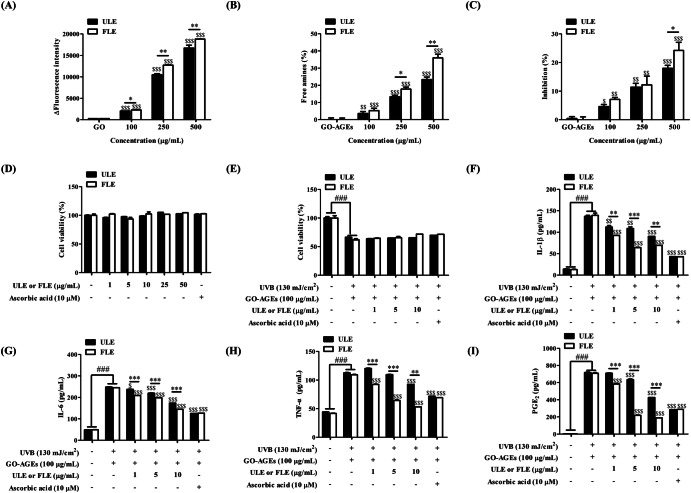
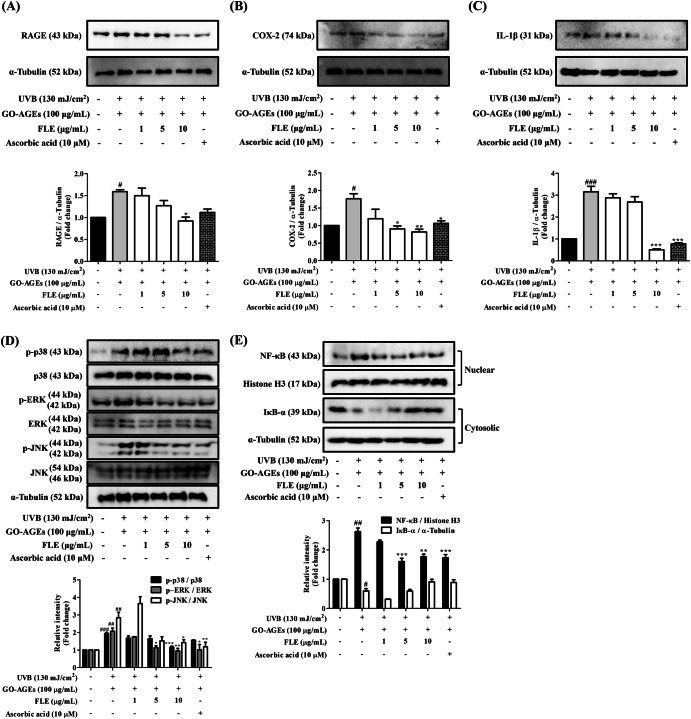
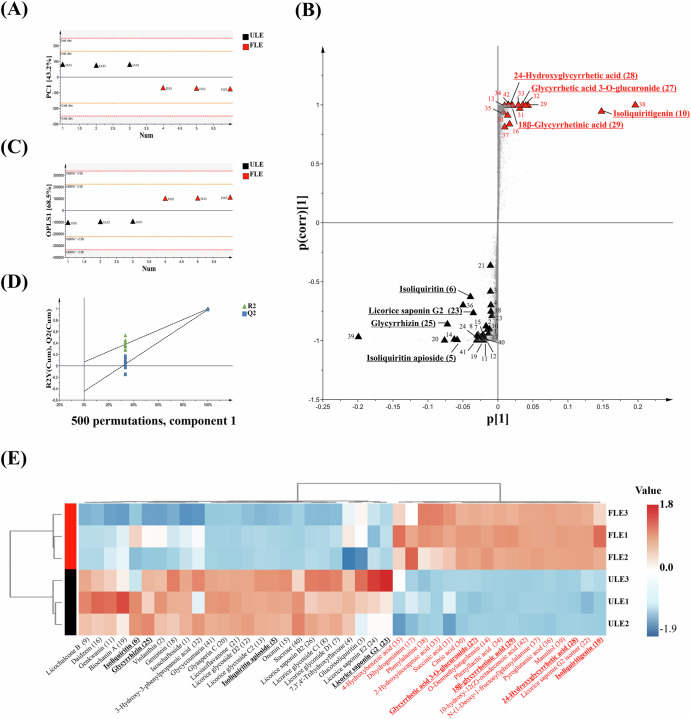
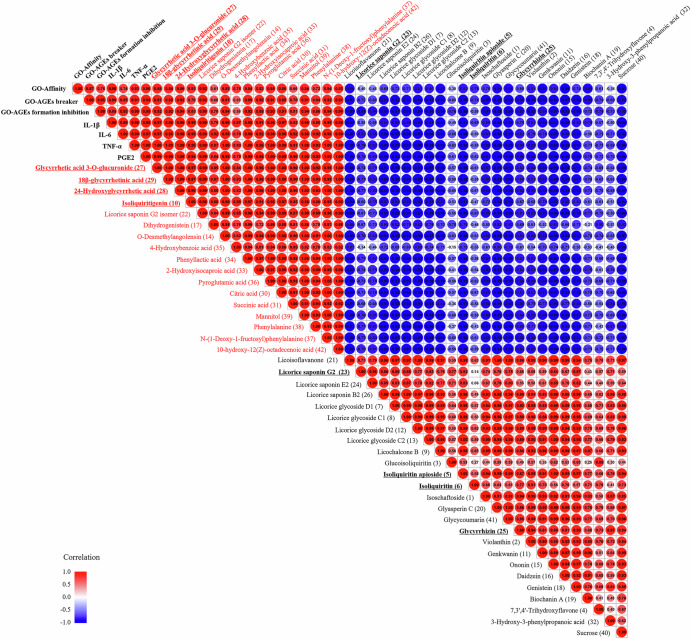
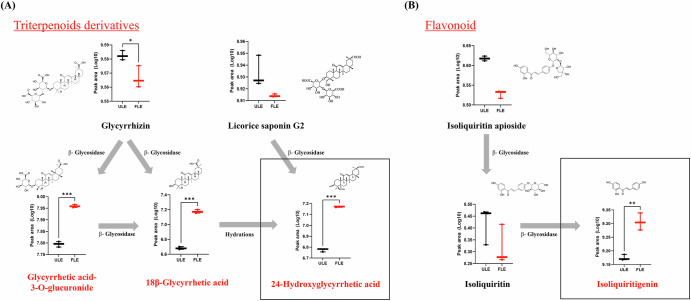
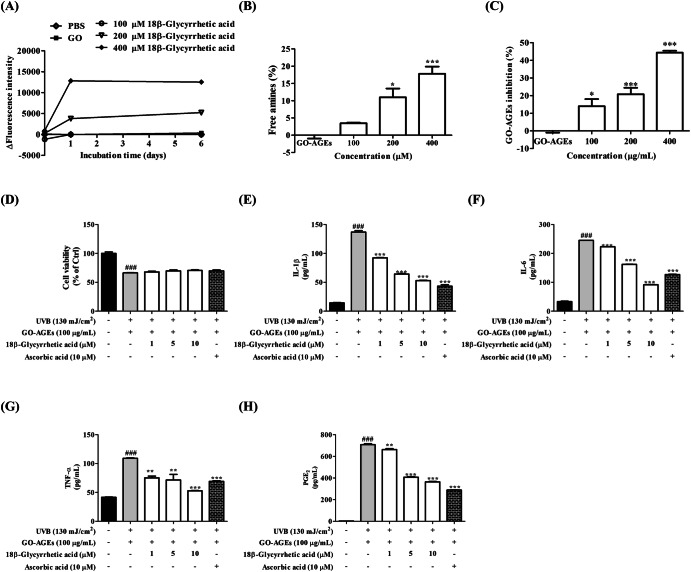
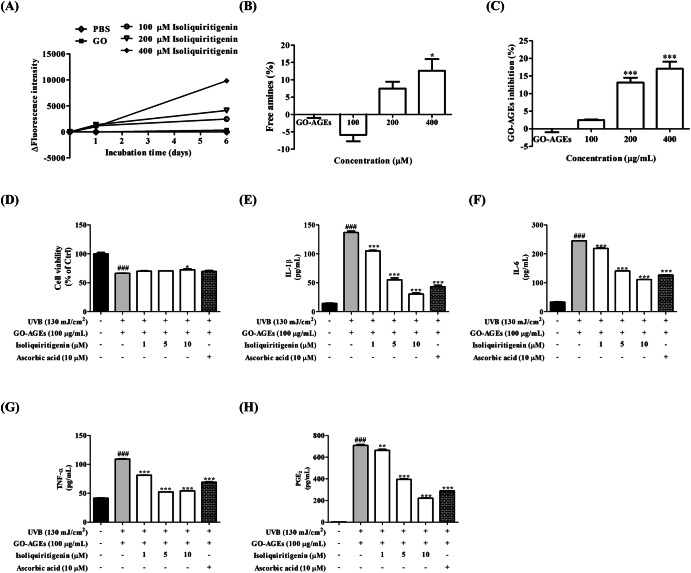
Licorice (Glycyrrhiza uralensis) has traditionally been used as a food-derived herbal remedy for inflammation; however, the anti-inflammatory potential of its fermented extract in skin health is still unclear. This study investigated fermented licorice extract (FLE) for its effects against glyoxal-derived advanced glycation end products (GO-AGEs) and ultraviolet B (UVB)-induced skin inflammation in HaCaT keratinocytes. At 10 µg/mL, FLE reduced IL-6 levels by 46% and TNF-α levels by 52%, and significantly lowered PGE2 levels. Mechanistic evaluation showed that FLE suppressed inflammatory signaling pathways, particularly nuclear factor-κB (NF-κB) and mitogen-activated protein kinases (MAPKs). Untargeted metabolomics identified fermentation-enhanced bioactive metabolites, including glycyrrhetic acid-3-O-glucuronide, 18β-glycyrrhetic acid, 24-hydroxyglycyrrhetic acid, and isoliquiritigenin, which correlated with anti-inflammatory activity. Notably, 18β-glycyrrhetic acid and isoliquiritigenin exhibited potent antiglycation effects and cytokine suppression. These results suggest that fermentation enhances the bioactive profile of licorice, supporting its potential as a functional ingredient for managing skin inflammation from GO-AGEs and UVB exposure.
© 2025. The Author(s).
Conflict of interest statement
Competing interests: The authors declare no competing interests.
Figures
Similar articles
-
Daphnes Cortex and its licorice-processed products suppress inflammation via the TLR4/NF-κB/NLRP3 signaling pathway and regulation of the metabolic profile in the treatment of rheumatoid arthritis.J Ethnopharmacol. 2022 Jan 30;283:114657. doi: 10.1016/j.jep.2021.114657. Epub 2021 Sep 30. J Ethnopharmacol. 2022. PMID: 34600080
-
Mahonia bealei (Fort.) Carr. Leaf extract modulates the TLR2/MyD88/NF-κB signaling pathway to inhibit PGN-induced inflammation in RAW264.7 cells.J Ethnopharmacol. 2025 Mar 26;344:119510. doi: 10.1016/j.jep.2025.119510. Epub 2025 Feb 17. J Ethnopharmacol. 2025. PMID: 39971016
-
Alleviation of lipopolysaccharide-induced heart inflammation in poultry treated with carnosic acid via the NF-κB and MAPK pathways.J Anim Sci. 2025 Jan 4;103:skae373. doi: 10.1093/jas/skae373. J Anim Sci. 2025. PMID: 39657120
-
Systemic pharmacological treatments for chronic plaque psoriasis: a network meta-analysis.Cochrane Database Syst Rev. 2021 Apr 19;4(4):CD011535. doi: 10.1002/14651858.CD011535.pub4. Cochrane Database Syst Rev. 2021. Update in: Cochrane Database Syst Rev. 2022 May 23;5:CD011535. doi: 10.1002/14651858.CD011535.pub5. PMID: 33871055 Free PMC article. Updated.
-
Systemic pharmacological treatments for chronic plaque psoriasis: a network meta-analysis.Cochrane Database Syst Rev. 2020 Jan 9;1(1):CD011535. doi: 10.1002/14651858.CD011535.pub3. Cochrane Database Syst Rev. 2020. Update in: Cochrane Database Syst Rev. 2021 Apr 19;4:CD011535. doi: 10.1002/14651858.CD011535.pub4. PMID: 31917873 Free PMC article. Updated.
References
-
- Wang, L., Jiang, Y. & Zhao, C. The effects of advanced glycation end-products on skin and potential anti-glycation strategies. Exp. Dermatol.33, e15065 (2024). - PubMed
Grants and funding
LinkOut - more resources
Full Text Sources
