. 2025 Aug 5;16(1):7186.
doi: 10.1038/s41467-025-62562-8.

PAM-flexible adenine base editing rescues hearing loss in a humanized MPZL2 mouse model harboring an East Asian founder mutation

Affiliations

PAM-flexible adenine base editing rescues hearing loss in a humanized MPZL2 mouse model harboring an East Asian founder mutation

Shao Wei Hu et al. Nat Commun. .

Abstract

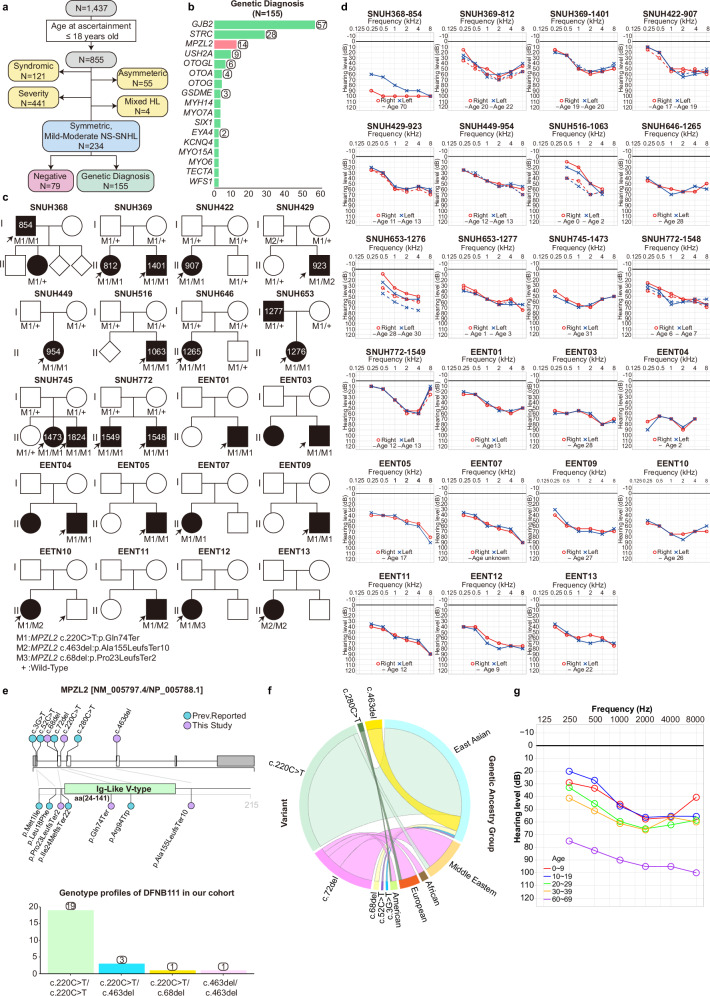
Hearing loss is one of the most prevalent sensory disorders, but no commercial biological treatments are currently available. Here, we identify an East Asia-specific founder mutation, the homozygous c.220 C > T mutation in MPZL2, that contributes to a significant proportion of hereditary deafness cases in our cohort study. We find that the disease-causing mutation can be targetable by adenine base editors (ABEs) that enable A·T-to-G·C base corrections without DNA double-strand breaks. To demonstrate this, we develop a humanized mouse model (hMPZL2Q74X/Q74X) that recapitulates human MPZL2 deafness and leads to progressive hearing loss. A PAM-flexible ABE variant with reduced bystander and off-target effects (ABE8eWQ-SpRY:sgRNA3) is packaged in dual adeno-associated viruses (AAVs) and injected into the inner ear of hMPZL2Q74X/Q74X mice and effectively corrects the mutation. This treatment significantly restores hearing function, improves inner ear structural integrity, and reverses altered gene expression. Base editing may hold therapeutic potential for hereditary deafness, including most cases of MPZL2 deafness.


Conflict of interest statement

Competing interests: The authors declare no competing interests.

Figures

Fig. 1
Fig. 1. Clinical significance of the MPZL2 c.220 C > T mutation.
a Schematic flow diagram illustrating the genetic diagnosis study of symmetric, mild-to-moderate, non-syndromic sensorineural hearing loss (ns-SNHL) in children from two tertiary centers. b Gene signatures of symmetric, mild-to-moderate, ns-SNHL in children. The bar plot shows the frequencies of 17 deafness genes that were seen in 2 or more probands from 155 genetically diagnosed families. c Pedigrees and genotypes of 24 affected patients from 20 unrelated DFNB111 families. Arrows, probands; Black filled circles or rectangles, affected patients. d Serial audiograms of 23 affected DFNB111 patients. Red, right ear; Blue, left ear. e MPZL2 mutational landscape on a Lollipop plot (upper), and the prevalence of MPZL2 in trans mutation combinations in our cohort (lower). f The mutational burden of different MPZL2 mutations depending on the genetic ancestry groups in the Chord diagram. g The natural course of hearing loss in DFNB111 patients over decades across different hearing frequencies. Source data for all relevant panels are provided within the Source Data file.
Fig. 2
Fig. 2. Generation and characterization of humanized mouse models.
a Targeting strategy for the humanized MPZL2 mouse model (hMPZL2Q74X) using the CRISPR/Cas9 system. b Sequence verification of hMPZL2Q74X mice and Mpzl2 WT mice using Sanger sequencing. c RT-PCR analysis to detect MPZL2 and Mpzl2 expression in P4 hMPZL2Q74X/Q74X and Mpzl2 WT mice. d, e Comparison of ABR and DPOAE thresholds among Mpzl2 WT (red, n = 10), hMPZL2Q74X/WT (green, n = 10), and hMPZL2Q74X/Q74X (blue, n = 10) mice at 4, 8, and 12 weeks of age. Data are presented as the mean ± SEM. Statistical significance was determined using one-way ANOVA with Bonferroni’s multiple comparisons test. Significance levels are indicated as *P < 0.05, **P < 0.01, ***P < 0.001, and ****P < 0.0001. f Representative section images (10 μm) from 12-week-old Mpzl2 WT mice (n = 1), hMPZL2Q74X/WT mice (n = 1), and hMPZL2Q74X/Q74X mice (n = 2), immunolabeled with Myosin VIIa (HCs, red) and anti-Sox2 (SCs, green) of the organ of Corti in 12 weeks of age. Arrowheads indicate IHCs and DCs, white arrows point to OHCs, and the white line marks SCs. Asterisks indicate loss of OHCs and DCs. Scale bar, 25 μm. Data are shown as the mean ± SEM. Statistical significance was determined using one-way ANOVA with Bonferroni’s multiple comparisons tests, and significance levels are indicated as ****P < 0.0001. g Schematic diagram of the RNA-sequencing analysis (n = 3). h Heatmap analysis of DEGs (upregulation, red; downregulation, blue). i Volcano plot of DEGs (upregulation, red; downregulation, blue), (n = 3, statistical significance was evaluated using a two-sided test (P < 0.05)). j Gene ontology (GO) enrichment analysis in biological processes (BP). k Top 20 GO BP terms associated with cell adhesion, basement membrane organization, and ECM organization. l Quantitative RT-PCR assay in triplicate to validate the DEGs of interest (n = 3, biological replicates): COL9A1/2/3, EMILIN1, IBSP, POSTN, TNXB, LAMA1/2. Statistical significance was determined using one way ANOVA with Kruskal–Wallis test. Data are presented as the mean ± SEM. Source data for all relevant panels are provided within the Source Data file.
Fig. 3
Fig. 3. In vitro selection of the optimal ABE system for correcting the MPZL2 c.220 C > T mutation.
a Schematic representation of a correction strategy using PAM-flexible ABEs in HEK293T monoclonal cells harboring the homozygous C > T nonsense mutation (c.220 C > T: p.Q74X) at the MPZL2 locus. b Design of sgRNAs targeting the MPZL2 c.220 C > T mutation. For more effective editing, the target adenine A needs to be within ABE’s preferred targeting window. In the table below, 6 sgRNA candidates featuring different PAMs are listed, each placing the target A (red) at different positions on the protospacer: A2, A4, A5, A6, and A7. c Comparison of the A-to-G editing efficiencies in vitro at the target adenine and bystander adenines for all ABEs used in this study (n = 3 for all conditions, except for ABE8eWQ:sgRNA3, for which n = 4). d C-to-other editing efficiencies at either AC*N and TC*N motifs within the targetable window of the selected SpRY-based ABEs. The data is from c (Mean values, same as in c, n = 3, except for ABE8eWQ:sgRNA3, for which n = 4). e Potential off-target sites identified by Cas-OFFinder and GUIDE-seq. The venn diagram shows the degree of off-target site overlap between the two methods (f) Heatmap showing A-to-G conversion rates at off-target sites predicted using Cas-OFFinder following ABE (sgRNA3 + ) treatment. g Validation of A-to-G conversion rates at GUIDE-seq-detected off-target sites after ABE (sgRNA3 + ) treatment. Sites that showed differences between control (untreated) and ABE (sg3 + ) samples are marked with an asterisk (*) and labeled by genomic locus, and coding region is shown in purple text. A purple asterisk (*) indicates overlapping site detected by both methods. h Targeted RNA off-target effects in  HEK293T cells mimicking the MPZL2 c.220 C > T variant with three SpRY ABEs that were expressed using NAN PAM sgRNA. The average frequency of A-to-I transitions in three mRNA transcripts (CCNB1IP1, AARS1, and TOPORS) with each of the SpRY-mediated ABE variants. Source data for all relevant panels are provided within the Source Data file.
Fig. 4
Fig. 4. In vivo correction of the MPZL2 c.220 C > T mutation by dual AAV-ie-ABE8eWQ-SpRY:sgRNA3.
a Schematic representation of the dual AAV constructs utilizing split-intein for ABE delivery in vivo, resulting in intein-mediated assembly of complete ABE:sgRNA complexes. The dual plasmids were packaged into the AAV serotype AAV-ie. b Assessment of the editing efficiencies of the MPZL2 target adenine and other bystander adenines or cytosines using dual AAV vectors that encoded split-intein ABE8eWQ-SpRY and sgRNA3 (n = 2). c Experimental overview of the in vivo base editing. Dual AAV-ie was used to induce split intein assembly, with the N-terminal and C-terminal components each prepared at 5.0 × 1013 vg/mL. These were mixed at a 1:1 ratio, and 2000 nl was injected into the RWM of P2 hMPZL2Q74X/Q74X mice. BioRender was used to make the Figure. “Created in BioRender. 남, 배. (2025) https://BioRender.com/kz4zbsm”. The images of the syringe, cochlea, and postnatal pup used in the figure were created using BioRender. d In vivo efficiency of A ∙ T to G ∙ C editing at on-target sites (P = 0.001) and bystander effects in DNA extracted from the organ of Corti (n = 8, P < 0.0001). Statistical analyses were performed using a two-tailed unpaired Student’s t-test. In the box-and-whisker plot, the whiskers mark the minimum and maximum, the box includes the 25th to 75th percentiles, and the line within the box indicates the median of the data set. Significance levels are indicated as *P < 0.05, **P < 0.01, ***P < 0.001, and ****P < 0.0001. e In vivo potential off-target sites relative to the target site. The potential off-target sites were identified using Cas–OFFinder, including those with up to two mismatches and/or up to one DNA/RNA bulge. f RNA off-target test in vivo at 8 weeks after dual AAV-ie-ABE8eWQ-SpRY:sgRNA3 injection. RNA off-target test in the injected mice was performed, and no RNA off-target editing was detected in vivo. n = 2 (Treated) and n = 2 (Control) per group. Source data for all relevant panels are provided within the Source Data file.
Fig. 5
Fig. 5. In vivo base editing of MPZL2 c.220 C > T mutation restored hearing in hMPZL2Q74X/Q74X mice.
a Representative ABR waveforms from three groups of mice (Mpzl2 WT, hMPZL2Q74X/Q74X, and treated hMPZL2Q74X/Q74X) in response to click stimuli recorded at 12 weeks post-injection. The bold line in each group represents the threshold. bf Comparison of ABR thresholds among Mpzl2 WT (red line), hMPZL2Q74X/Q74X (blue line), and treated hMPZL2Q74X/Q74X (green line) mice at 4 weeks (b), 8 weeks (c),12 weeks (d), 16 weeks (e), and 20 weeks (f). Comparison of DPOAE thresholds among Mpzl2 WT (red line), hMPZL2Q74X/Q74X (blue line), and treated hMPZL2Q74X/Q74X (green line) mice at 4 weeks (g), 8 weeks (h),12 weeks (i), 16 weeks (j), and 20 weeks (k). At 16 weeks, 8 kHz (P = 0.023) and 16 kHz (P = 0.003); at 20 weeks, 8 kHz (P = 0.048) showed significant differences between hMPZL2Q74X/Q74X and treated hMPZL2Q74X/Q74X mice. Statistical significance was calculated using one-way ANOVA with Bonferroni’s correction for multiple comparisons. Significance levels are indicated as *P < 0.05, **P < 0.01, ***P < 0.001, and ****P < 0.0001. Data are presented as the mean ± SEM. Source Data file. Source data for all relevant panels are provided within the Source Data file.
Fig. 6
Fig. 6. In vivo base editing of MPZL2 c.220 C > T mutation rescued MPZL2 expression, cochlear structure, and molecular functions in hMPZL2Q74X/Q74X mice.
a RT-PCR showed enhanced MPZL2 expression in cochlear membranous tissues at P28 following injection at P2. b Representative section images of MPZL2 expression in organ of Corti at P28 following injection at P2, immunolabeled with an anti-MPZL2 antibody (green). Scale bar: 25 μm. c Representative whole-mount images of the HC and SC layer from Mpzl2 WT, untreated hMPZL2Q74X/Q74X, and treated hMPZL2Q74X/Q74X mice at 12 weeks of age, along with the quantification of surviving OHCs (n = 4) and DCs (n = 4) immunolabeled with anti-Myosin VIIa (HCs, green) and anti-Sox2 (SCs, red). Scale bar: 20 μm. Data are presented as the mean ± SEM. In the bar graphs, Mpzl2 WT is shown in red, untreated hMPZL2Q74X/Q74X in blue, and treated hMPZL2Q74X/Q74X in green. Statistical significance was determined using one-way ANOVA with Bonferroni’s correction for multiple comparisons. Significance levels are indicated as *P < 0.05, **P < 0.01, and ***P < 0.001. d Representative section images of the organ of Corti at 12 weeks of age in Mpzl2 WT (n = 1), untreated hMPZL2Q74X/Q74X (n = 1), treated hMPZL2Q74X/Q74X mice (n = 2) after injection at P2, immunolabeled with anti-Myosin VIIa (HCs, red) and anti-Sox2 (SCs, green) antibodies. Scale bar: 25 μm. e Scanning electron microscope images from Mpzl2 WT, hMPZL2Q74X/Q74X, and treated hMPZL2Q74X/Q74X mice in the middle and basal turns of the cochlea. Scale bar: 10 μm. f Heatmap analysis of DEGs between untreated hMPZL2Q74X/Q74X mice (n = 3) and treated hMPZL2Q74X/Q74X mice (n = 3) (upregulation, red; downregulation, blue). g Biological processes (BP) terms associated with cell adhesion, ECM organization, and immune system processes. h Schematic diagram of RNA-sequencing analysis (n = 3). i Quantitative RT-PCR assay of the 14 genes of interest related to cell adhesion and ECM organization across the three groups (n = 3). Statistical significance was determined using one-way ANOVA with Kruskal–Wallis test for multiple comparisons. Data are presented as the mean ± SEM. Source data for all relevant panels are provided within the Source Data file.

References

    1. Wang, H. et al. Bilateral gene therapy in children with autosomal recessive deafness 9: single-arm trial results. Nat. Med.30, 1898–1904 (2024). - PMC - PubMed
    1. Lv, J. et al. AAV1-hOTOF gene therapy for autosomal recessive deafness 9: a single-arm trial. Lancet403, 2317–2325 (2024). - PubMed
    1. Jean, P. et al. Single-cell transcriptomic profiling of the mouse cochlea: An atlas for targeted therapies. Proc. Natl. Acad. Sci. USA120, e2221744120 (2023). - PMC - PubMed
    1. Petit, C., Bonnet, C. & Safieddine, S. Deafness: from genetic architecture to gene therapy. Nat. Rev. Genet24, 665–686 (2023). - PubMed
    1. Sharma, G., Sharma, A. R., Bhattacharya, M., Lee, S. S. & Chakraborty, C. CRISPR-Cas9: a preclinical and clinical perspective for the treatment of human diseases. Mol. Ther.29, 571–586 (2021). - PMC - PubMed

LinkOut - more resources