. 2025 Aug 5;10(1):185.
doi: 10.1038/s41541-025-01235-5.

Priming VRC01-precursor B cells with non-envelope immunogens disfavors boosting with HIV-1 envelope

Affiliations

Priming VRC01-precursor B cells with non-envelope immunogens disfavors boosting with HIV-1 envelope

Andrew Wilcox-King et al. NPJ Vaccines. .

Abstract

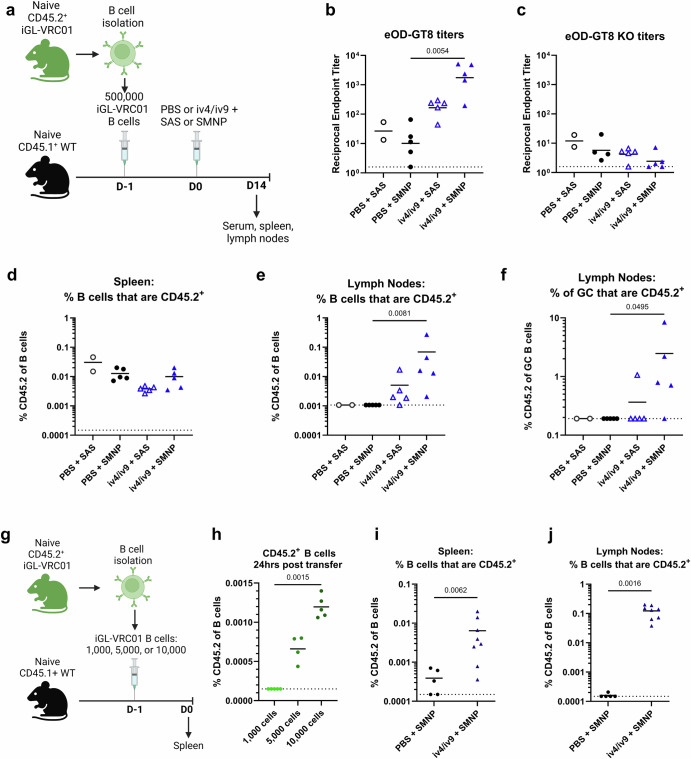
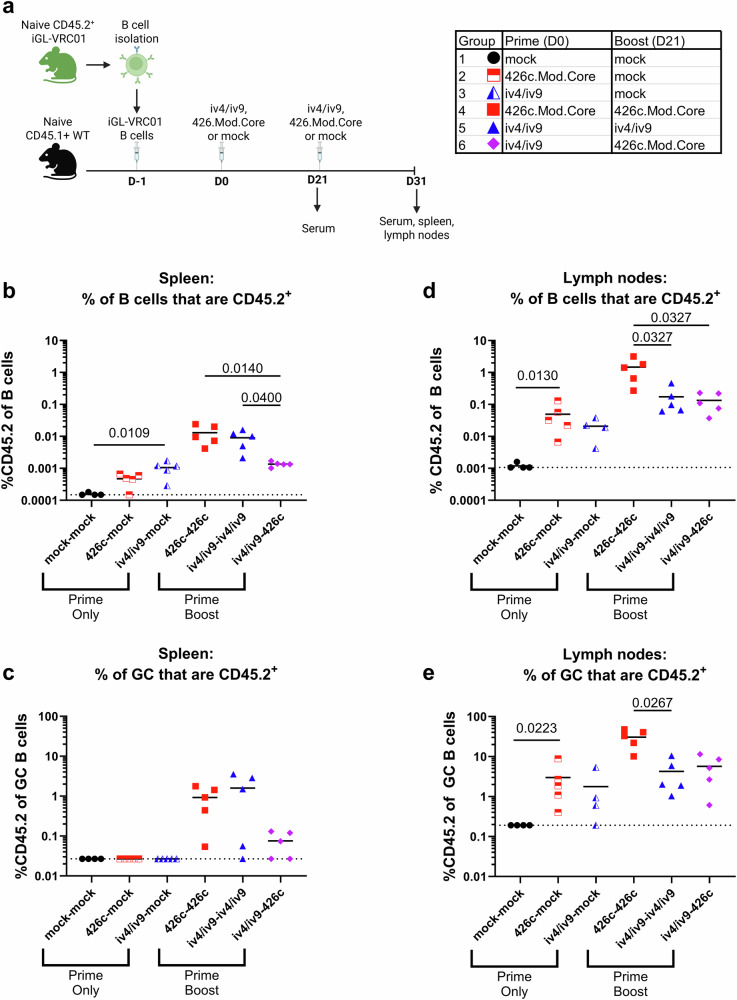
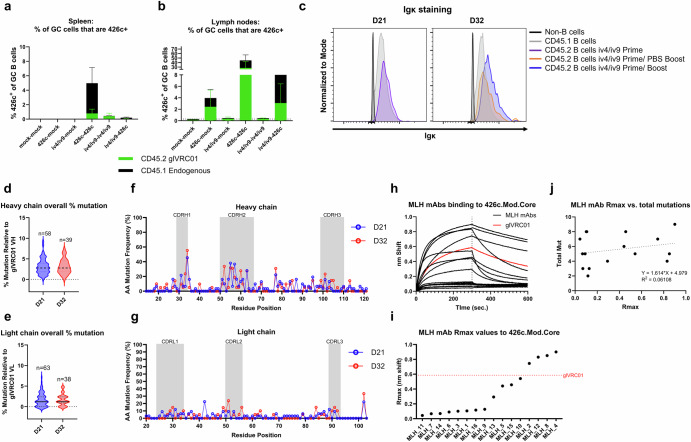
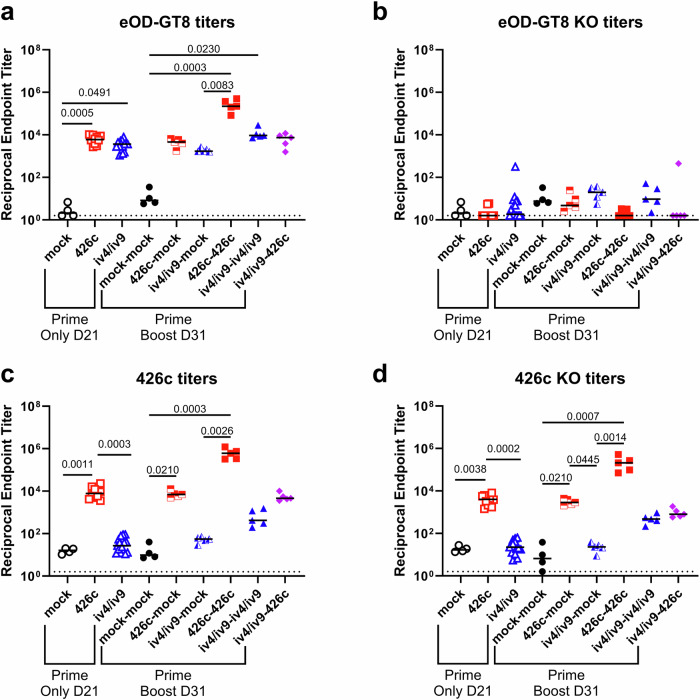
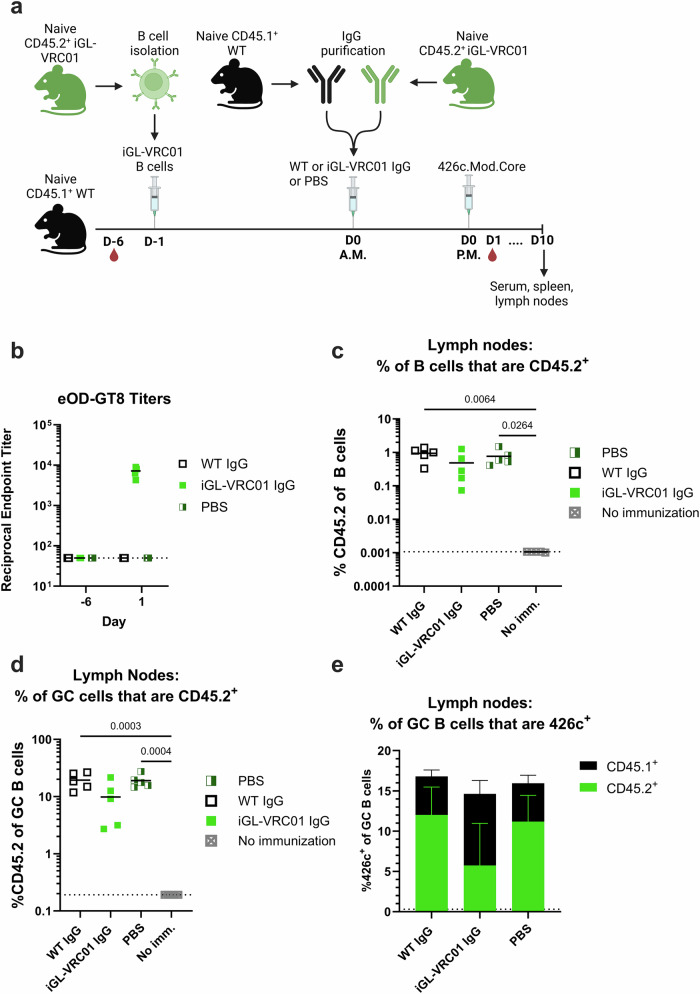
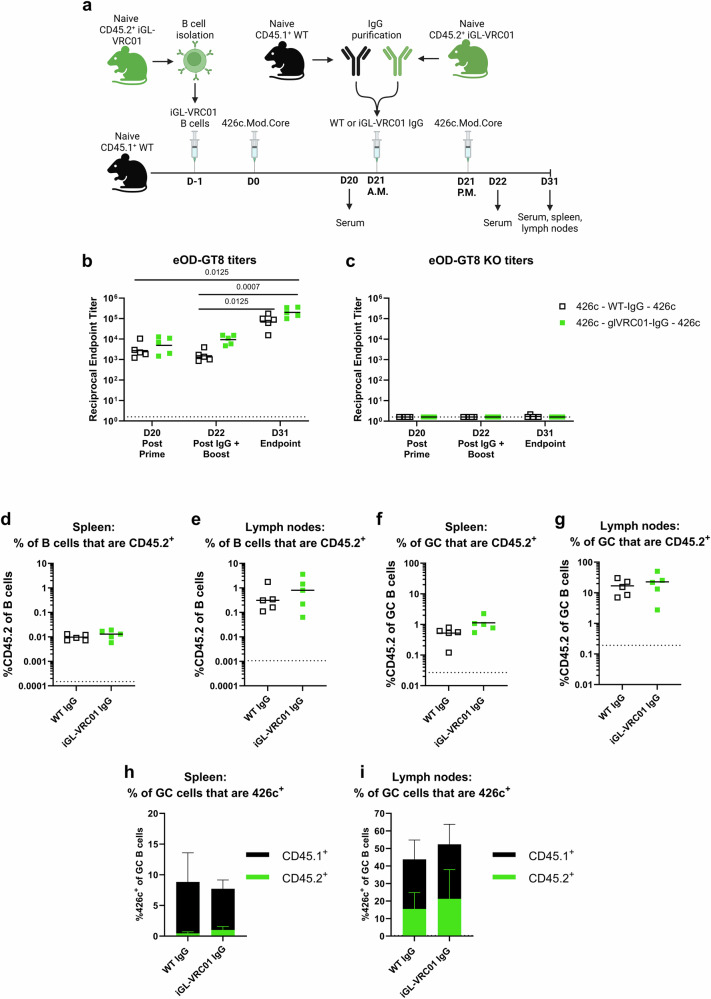
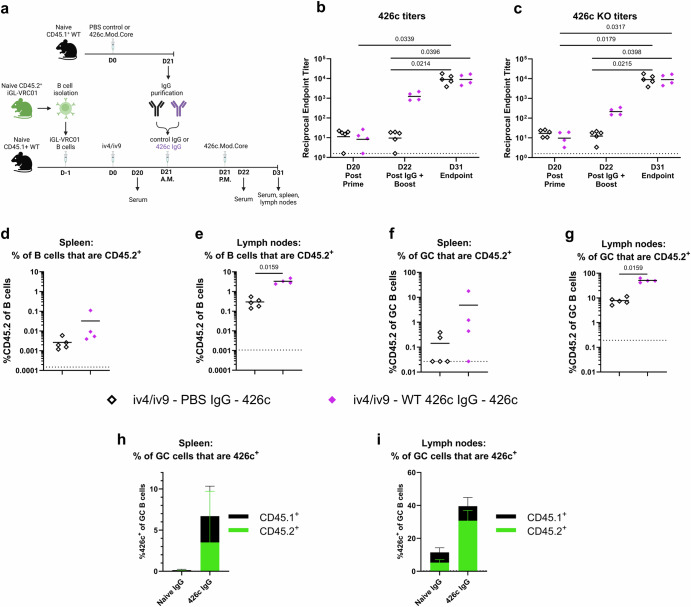
VRC01-class antibodies are a genetically restricted class of antibodies capable of potently neutralizing diverse strains of HIV-1. Unmutated VRC01 precursors fail to recognize recombinant HIV-1 Envelope (Env) proteins, which necessitated the development of germline targeting vaccine immunogens capable of initiating VRC01-class B cell response. Among these, we developed an anti-idiotypic monoclonal antibody (ai-mAb)-derived VRC01 class targeting immunogen. Because it is distinct from Env, we speculated that the ai-mAb will selectively engage naive VRC01 class B cells while limiting B cell responses directed at off-target epitopes on Env during prime-boost regimens. Here, we evaluated the serum and B cell responses to ai-mAb prime/Env boost, and Env-prime/Env boost regimens in a murine adoptive transfer model where VRC01 precursor B cells are present at physiological levels. We found that the Env-Env regimen led to the greatest expansion of on-target VRC01 B cells, drove larger VRC01-class GC responses, and elicited higher titers of circulating antibodies despite also eliciting substantial off-target Env-specific responses. Single-cell sorting experiments revealed that the ai-mAb was driving off-track somatic mutations. IgG transfer experiments demonstrated that circulating off-target antibodies provide a positive feedback mechanism that potentiates on-target B cell responses. Collectively, the results suggest that non-Env immunogens are not ideal for priming VRC01-class B cells, where sequential boosting with Env will be required to drive maturation of neutralizing breadth.


Conflict of interest statement

Competing interests: L.S. and A.T.M. are inventors on the following patents and applications related to the 426c.Mod.Core protein used herein: US patent #10,342,863—Engineered and multimerized human immunodeficiency virus envelope glycoproteins and uses thereof, US patent #10,987,417—Engineered and multimerized human immunodeficiency virus envelope glycoproteins and uses thereof, US patent #11,883,485—Methods of eliciting antibodies that bind to full-length glycosylated HIV-1 ENV using multimerized ENV cores, and US patent #18/402,480 (pending)—Sequential immunization strategies to guide the maturation of antibodies against human immunodeficiency virus. DJI is named as an inventor on a patent for SMNP: US patent #11,547,672—Nanoparticle vaccine adjuvant and methods of use thereof. All other authors declare no competing interests.

Figures

Fig. 1
Fig. 1. Optimizing immunization with iv4/iv9 in an adoptive transfer model.
af CD45.1+ wild-type mice (WT) received 500,000 CD45.2+ iGL-VRC01 cells, followed by immunization with iv4/iv9 or PBS formulated with either sigma adjuvant system (SAS) or Saponin/Monophosphoryl Lipid A nanoparticle (SMNP) the next day as indicated. Blood, spleens, and lymph nodes were collected 14 days later (a). ELISA was used to measure total serum IgG titers against eOD-GT8 (b) and eOD-GT8 KO (c). Frequency of CD45.2+ cells as proportion of total B cells in the spleen (d) or lymph nodes (e). Frequency of CD45.2+ cells as a proportion of germinal center (GC) cells in the lymph nodes (f). g CD45.1+ mice received indicated number of CD45.2+ iGL-VRC01 cells. h 24 h later, the frequency of CD45.2+ cells present in the spleens was analyzed by flow cytometry. P values are reported as determined by the Kruskal–Wallis test with Dunn’s multiple comparisons, and the dashed line indicates half the lowest dilution tested. i and j CD45.1+ WT mice received 5000 CD45.2+ iGL-VRC01 cells and were immunized 24 h later with iv4/iv9 + SMNP or PBS + SMNP. The frequency of CD45.2+ cells was measured in the spleen (i) or lymph nodes (j) 14 days later. Each data point represents one mouse. P values determined by Mann-Whitney tests. a and g were created using BioRender.
Fig. 2
Fig. 2. B cell responses to prime—boosting with iv4/iv9 and 426c.
a Schematic of the experiment. CD45.1+ mice received 5000 CD45.2+ iGL-VRC01 cells. The next day (D0), they were immunized with either iv4/iv9-2W1S or 426c.Mod.Core-2W1S formulated with SMNP (n = 5 per group) or mock immunized (PBS + SMNP, n = 4 per group). 21 days later, the mice were bled and immunized a second time with the indicated immunogen. The mice were then euthanized 10 days later (D31). Created with BioRender. b Frequency of CD45.2+ cells as a proportion of total B cells in the spleen. c Frequency of CD45.2+ cells as a proportion of germinal center (GC) B cells in the spleen. d Frequency of CD45.2+ cells as a proportion of total B cells in the lymph nodes. e Frequency of CD45.2+ cells as a proportion of germinal center (GC) B cells in the lymph nodes. Each data point represents one mouse, bars represent the mean, and dashed lines indicate the limit of detection (LoD) in (b–e). P values are reported as determined by the Kruskal–Wallis test with Dunn’s multiple comparisons within each group. Statistical tests were performed separately on the Prime Only and Prime Boost groups, indicated by brackets in (be).
Fig. 3
Fig. 3. BCR binding to 426c.Mod.Core following ai-mAb immunization and sequence analysis of CD45.2 LN GC + B cells following ai-mAb immunization.
a and b Proportion of GC B cells from mice in Fig. 2 that stain 426c.Mod.Core+ in spleen (a) and lymph nodes (b); the height of the bars indicates the mean total frequency of 426c.Mod.Core+ GC cells, and the colors indicate whether they are of CD45.1+ (black) or CD45.2+ (green) origin. Bars represent the mean of n = 5 mice per group, and the error bars show the standard deviation. c Overlaid histograms showing IgK staining by flow cytometry of indicated cell populations at the indicated timepoints. Data normalized to mode. d–g Sequence and mutation analysis of single-cell sorted CD45.2+ B cells from the lymph nodes of iv4/iv9 prime, iv4/iv9 boost animals at D21 and D32. d and e Violin plots of overall percent mutation in the heavy chain (IgH, d) or light chains (IgK, e) compared to iGL-VRC01 with the number of chains analyzed above each plot. h–j Binding of 16 recombinant mAbs corresponding to BCRs from sorted cells was assessed for binding to a 500 nM solution of 426c.Mod.Core by BLI. h Representative BLI traces of sorted mAbs (black) compared to iGL-VRC01 IgG (red). i Rmax values of sorted mAbs to 426 c.Mod.Core from (h). Rmax of iGL-VRC01 to 426c.Mod.Core shown by the red dotted line. j Linear regression analysis of Rmax values from (i) vs. number of mutations relative to iGL-VRC01.
Fig. 4
Fig. 4. Serum responses to 426c and eOD-GT8 antigens in immunized mice.
a–d Serum was collected at D21 and D31 from the experiment shown in Fig. 2 and analyzed by ELISA. Endpoint binding titers were measured to eOD-GT8 (a), eOD-GT8-KO (b), 426c.Mod.Core (c), and 426c.Mod.Core-KO (d). Dashed line indicates half of the lowest dilution tested. Each data point represents one mouse. n = 5 mice per group, except the PBS only control group, where n = 4 mice. Mean is plotted. P values are reported as determined by the Kruskal–Wallis test with Dunn’s multiple comparisons. Statistical tests were performed separately on the Prime Only and Prime Boost groups, indicated by brackets.
Fig. 5
Fig. 5. Effect of on-target antibodies on B cell responses to a 426 c.Mod.Core prime.
a Schematic of the experiment. CD45.1+ WT mice (n = 5 per group) received 5000 CD45.2+ iGL-VRC01 cells (D-1). The next morning (D0 A.M.), they received IgG purified from naïve CD45.1+ WT mice, iGL-VRC01 mice or PBS, followed by an immunization with 426c.Mod.Core in the afternoon (D0 P.M.). Created with BioRender. b Endpoint binding titers to eOD-GT8 were measured by ELISA in serum collected from the indicated groups on D-6 and D1. Dashed line indicates half the lowest dilution tested. c Frequency of total B cells that are CD45.2+ in the lymph nodes at day 10. d Frequency of germinal center (GC) B cells that are CD45.2+ in the lymph nodes at day 10. Each data point represents one mouse (n = 5), and the mean is indicated by a bar. P values are reported as determined by the Kruskal–Wallis test with Dunn’s multiple comparisons. Dashed lines indicate the limit of detection in (bd). e Mean percentage of 426c.Mod.Core+ GC B cells in the lymph node at day 10. The height of the bar indicates the total frequency of 426c.Mod.Core+ cells, and the colors indicate whether they are CD45.1+ (black) or CD45.2+ (green). Bars represent the mean of n = 5 mice per group, and the error bars represent the standard deviation in (e).
Fig. 6
Fig. 6. Effect of on-target antibody transfer on response to boost.
a Schematic of the experiment. CD45.1+ WT mice received 5,000 iGL-VRC01 CD45.2+ cells and were immunized the next day (D0) with 426c.Mod.Core. Twenty-one days later (D21), they received IgG from naïve CD45.1+ WT or from iGL-VRC01 mice in the morning (A.M.), followed by an immunization with 426c.Mod.Core in the afternoon (P.M.). Created with BioRender. b and c Endpoint binding titers to eOD-GT8 (b) or eOD-GT8 KO (c) were measured by ELISA in serum collected on D20, D22, and D31. Dashed line represents half of the lowest dilution tested. d and e Frequency of total CD45.2+ B cells in the spleen (d) and lymph nodes (e) at D31. f and g Frequency of CD45.2+ B cells among GC B cells in the spleen (f) and lymph nodes (g) at D31. Each data point represents one mouse (n = 5). P values are reported as determined by the Kruskal–Wallis test with Dunn’s multiple comparisons, and dashed lines indicate limit of detection (d–g). h and i Percentage of 426c.Mod.Core+ B cells among GC B cells in the spleen (h) and lymph nodes (i) at day 31. Bars represent the mean of n = 5 mice per group, and the error bars represent the standard deviation. The height of the bar indicates the total frequency of 426c.Mod.Core+ cells, and the colors indicate whether they are CD45.1+ (black) or CD45.2+ (green).
Fig. 7
Fig. 7. Effect of off-target antibody transfer on response to boost.
a Schematic of the experiment. CD45.1+ wild-type mice received 5000 CD45.2+ iGL-VRC01 B cells and were immunized the next day (D0) with iv4/iv9. Twenty-one days later (D21), they received IgG from CD45.1+ wild-type mice immunized with PBS + SMNP (control, black n = 5) or with 426c.Mod.Core (purple n = 4) in the morning (A.M.), followed by an immunization with 426c.Mod.Core in the afternoon (P.M.). Created with BioRender. b and c Endpoint binding titers to 426c.Mod.Core (b) and 426c.Mod.Core KO (c) was measured by ELISA in serum collected on D20, D22, and D31. P values are reported as determined by the Kruskal–Wallis test with Dunn’s multiple comparisons, and the dashed line indicates half the lowest dilution tested. d and e Frequency of total CD45.2+ B cells in the spleen (d) and lymph nodes (e) at D31. f and g Frequency of CD45.2+ B cells among germinal center B cells in the spleen (f) and lymph nodes (g) at D31. Each data point represents one mouse, and bars represent the means. P values are reported as determined by the Mann–Whitney test, and the dashed line indicates the limit of detection (dg). h and i Percentage of 426c.Mod.Core+ B cells among GC B cells in the spleen (h) and lymph nodes (i) at day 31. Bars represent the mean of n = 5 mice per group in the naïve IgG group and n = 4 in the 426c IgG group, and the error bars represent the standard deviation. The height of the bar indicates the total frequency of 426c.Mod.Core+ cells, and the colors indicate whether they are CD45.1+ (black) or CD45.2+ (green).

Similar articles

References

    1. Burton, D. R. & Hangartner, L. Broadly neutralizing antibodies to HIV and their role in vaccine design. Annu. Rev. Immunol.34, 635–659 (2016). - PMC - PubMed
    1. Kwong, P. D. & Mascola, J. R. Human antibodies that neutralize HIV-1: identification, structures, and B cell ontogenies. Immunity37, 412–425 (2012). - PMC - PubMed
    1. West, A. P. Jr. et al. Structural insights on the role of antibodies in HIV-1 vaccine and therapy. Cell156, 633–648 (2014). - PMC - PubMed
    1. Scheid, J. F. et al. Sequence and structural convergence of broad and potent HIV antibodies that mimic CD4 binding. Science333, 1633–1637 (2011). - PMC - PubMed
    1. Diskin, R. et al. Increasing the potency and breadth of an HIV antibody by using structure-based rational design. Science334, 1289–1293 (2011). - PMC - PubMed

LinkOut - more resources