. 2025 Aug 5;15(1):28579.
doi: 10.1038/s41598-025-11052-4.

Investigation of ribociclib, abemaciclib and palbociclib resistance in ER+ breast cancer cells reveal potential therapeutic opportunities`

Affiliations

Investigation of ribociclib, abemaciclib and palbociclib resistance in ER+ breast cancer cells reveal potential therapeutic opportunities`

Mashael Algethami et al. Sci Rep. .

Abstract

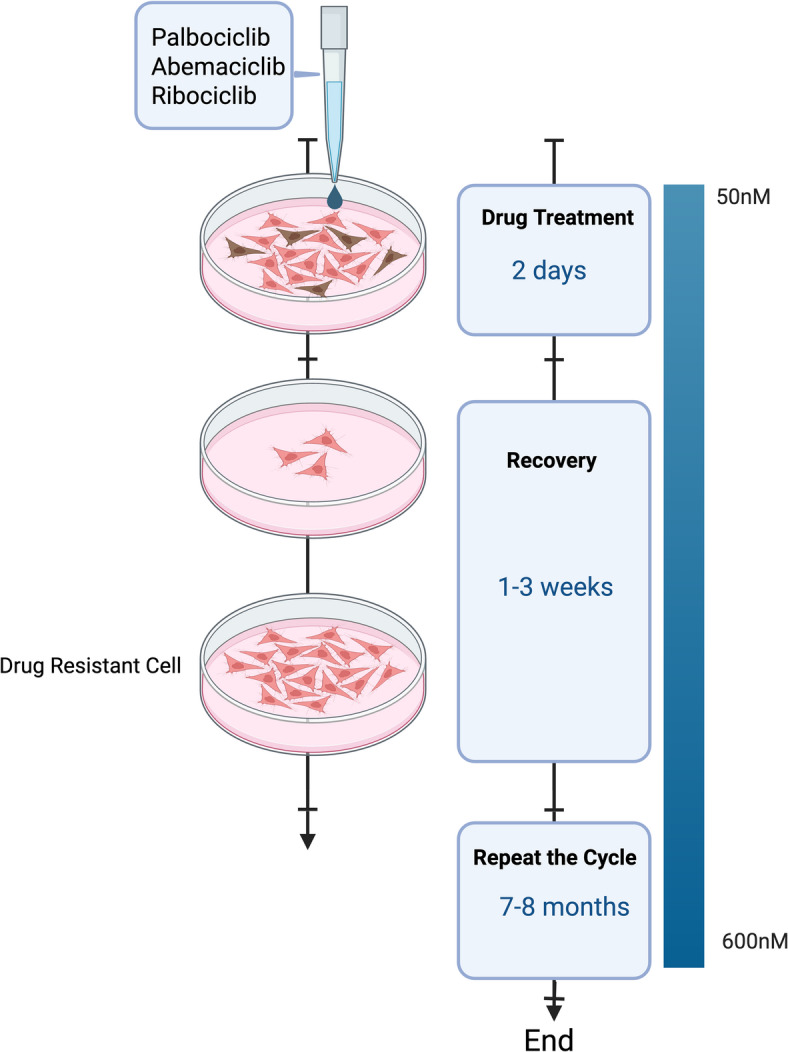
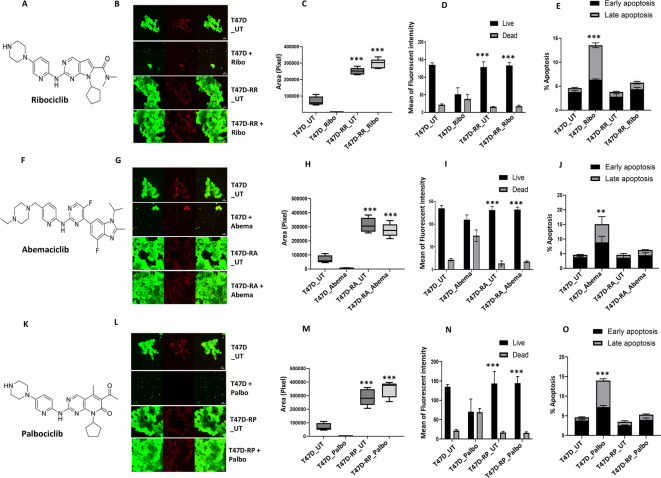
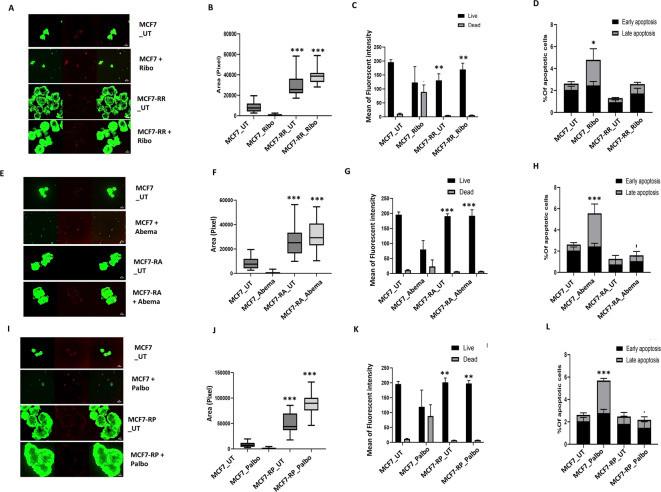
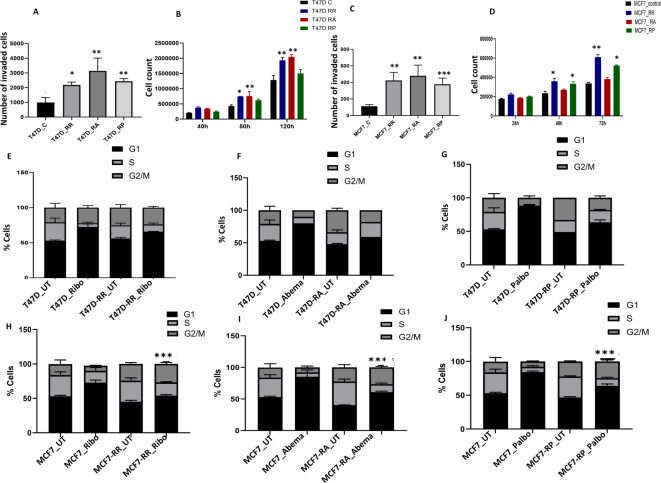
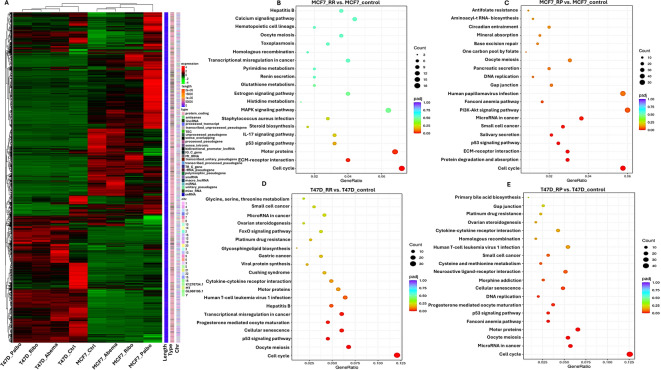
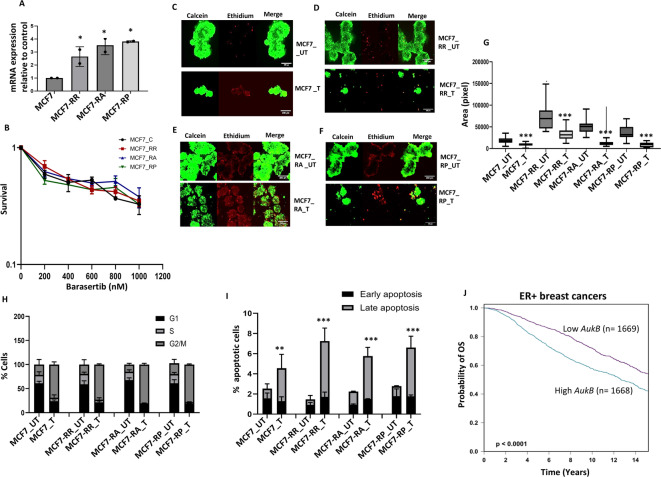
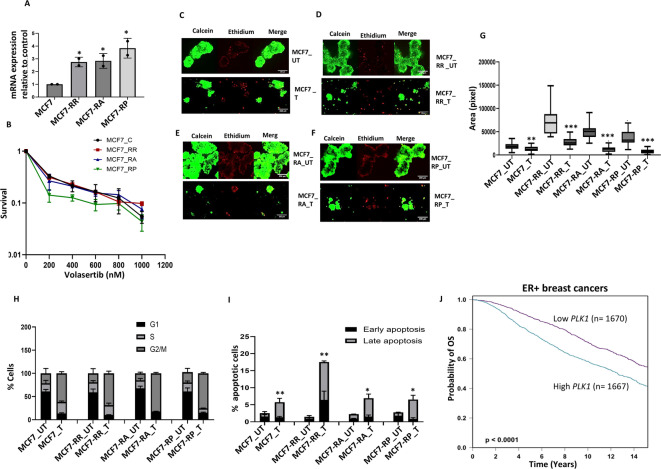
The cyclin-dependent kinase 4/6 inhibitor (CDK4/6i) ribociclib, abemaciclib, and palbociclib have transformed outcomes in patients with ER+ /HER2 - advanced breast cancer (BC). However, most patients eventually progress, and therapeutic options beyond CDK4/6i are an area of ongoing investigation. Here, we generated and evaluated ribociclib, abemaciclib, and palbociclib-resistant BCs. MCF7 and T47D (ER+ /HER2-) cells were chronically treated with increasing doses of ribociclib (R), abemaciclib (A), or palbociclib (P) over 8 months (0-600 nM). CDK4/6i-resistant cell lines (MCF7rR, MCF7rA, MCF7rP, T47DrR, T47DrA, and T47DrP) were isolated and evaluated for their aggressive phenotypes, cross-resistance, transcriptomic changes, and sensitivity to volasertib (PLK1 inhibitor) and barasertib (AukB inhibitor). Immunohistochemical evaluation of CDK4, CDK6, and p53 (n = 1005) and transcriptomic evaluation of AukB and PLK1 were performed in 5031 clinical breast cancers. MCF7rR, MCF7rA, MCF7rP, T47DrR, T47DrA, and T47DrP cells manifested aggressive phenotypes such as increased spheroid formation, invasion, proliferation, and progression through the G1/S phase of the cell cycle despite CDK4/6i treatment, increased resistance to apoptosis, and cross-resistance to other CDK4/6i. Transcriptomic analysis revealed the enrichment of distinct pathways in resistant cells, particularly the upregulation of cell cycle regulatory genes such as PLK1, AukB, CDKN2B and TGFβ. PLK1 or AukB overexpressing resistant cells were sensitive to volasertib (PLK1 inhibitor) and barasertib (AukB inhibitor) therapy, which was associated with G2/M cell cycle arrest and increased apoptosis. We conclude that cell cycle upregulation leading to G2/M progression is a key route for CDK4/6i resistance. AukB or PLK1 inhibitors that block G2/M phase could be a promising strategy.

Keywords: Abemaciclib; Breast cancer; CDK4; CDK6; Mechanism of resistance; Palbociclib; Ribociclib.


Conflict of interest statement

Declarations. Competing interests: The authors declare no competing interests. Ethics approval: The immunohistochemical study was approved by the Yorkshire & Humber-Leeds East Research Ethics Committee (REC Reference: 19/YH/0293) under IRAS Project ID: 266925. The collected data were anonymized. Patient consent: All patients provided informed written consent.

Figures

Fig. 1
Fig. 1
Generation of ribocilcib, abemaciclib and palbociclib resistant T47D and MCF7 cell lines: T47D and MCF7 was treated with increasing doses of ribociclib, abemaciclib, or palbociclib (50–600 nM). Please see methods section for full details. The figure was created in BioRender [Algethami, M. (2025) https://BioRender.com/bns6ond].
Fig. 2
Fig. 2
Evaluation of CDK4/6i resistant T47D cells. (A) Chemical structure of ribociclib. (B) T47D control and ribociclib resistant spheroids untreated (UT) or treated with 600 nM of ribociclib. (C) Spheroid size in control and resistant spheroids untreated (UT) or treated with 600 nM of ribociclib. (D) Proportion of living and dead cells in control and resistant spheroids untreated (UT) or treated with 600 nM of ribociclib. (E) % of apoptotic cells in untreated (UT) or treated with 600 nM of ribociclib. (F) Chemical structure of abemaciclib. (G) T47D control and abemaciclib resistant spheroids untreated (UT) or treated with 600 nM of abemaciclib. (H) Spheroid size in control and resistant spheroids untreated (UT) or treated with 600 nM of abemaciclib. (I) Proportion of living and dead cells in control and resistant spheroids untreated (UT) or treated with 600 nM of abemaciclib. (J) % of apoptotic cells in untreated (UT) or treated with 600 nM of abemaciclib. (K) Chemical structure of palbociclib. (L) T47D control and palbociclib resistant spheroids untreated (UT) or treated with 600 nM of palbociclib. (M) Spheroid size in control and resistant spheroids untreated (UT) or treated with 600 nM of palbociclib. (N) Proportion of living and dead cells in control and resistant spheroids untreated (UT) or treated with 600 nM of palbociclib. (O) % of apoptotic cells in untreated (UT) or treated with 600 nM of palbociclib. All the comparative analyses were between two sets of groups: Control_UT versus R_UT and Control_T versus R_T. ‘*’- p ≤ 0.05, ‘**’- p ≤ 0.01, ‘***’- p ≤ 0.001. All figures are representative of 3 or more experiments. Error bars represent standard error of mean between experiments.
Fig. 3
Fig. 3
Evaluation of CDK4/6i resistant MCF7 cells. (A) MCF7 control and ribociclib resistant spheroids untreated (UT) or treated with 600 nM of ribociclib. (B) Spheroid size in control and resistant spheroids untreated (UT) or treated with 600 nM of ribociclib. (C) Proportion of living and dead cells in control and resistant spheroids untreated (UT) or treated with 600 nM of ribociclib. (D) % of apoptotic cells in untreated (UT) or treated with 600 nM of ribociclib. (E) MCF7 control and abemaciclib resistant spheroids untreated (UT) or treated with 600 nM of abemaciclib. (F) Spheroid size in control and resistant spheroids untreated (UT) or treated with 600 nM of abemaciclib. (G) Proportion of living and dead cells in control and resistant spheroids untreated (UT) or treated with 600 nM of abemaciclib. (H) % of apoptotic cells in untreated (UT) or treated with 600 nM of abemaciclib. (I) MCF7 control and palbociclib resistant spheroids untreated (UT) or treated with 600 nM of palbociclib. (J) Spheroid size in control and resistant spheroids untreated (UT) or treated with 600 nM of palbociclib. (K) Proportion of living and dead cells in control and resistant spheroids untreated (UT) or treated with 600 nM of palbociclib. (L) % of apoptotic cells in untreated (UT) or treated with 600 nM of palbociclib. All the comparative analyses were between two sets of groups: Control_UT versus R_UT and Control_T versus R_T. ‘*’- p ≤ 0.05, ‘**’- p ≤ 0.01, ‘***’- p ≤ 0.001. All figures are representative of 3 or more experiments. Error bars represent standard error of mean between experiments.
Fig. 4
Fig. 4
CDK4/6i resistant cells have aggressive phenotype and bypass G1/S. (A) Invasion assay in T47D control and resistant cells. (B) Cell doubling times in T47D control and resistant cells. (C) Invasion assay in MCF7 control and resistant cells. (D) Cell doubling times in MCF7 control and resistant cells. (E) Cell cycle progression in T47D control and ribociclib resistant cells untreated (UT) or treated with ribociclib. (F) Cell cycle progression in T47D control and abemaciclib resistant cells untreated (UT) or treated with abemaciclib. (G) Cell cycle progression in T47D control and palbociclib resistant cells untreated (UT) or treated with palbociclib. (H) Cell cycle progression in MCF7 control and ribociclib resistant cells untreated (UT) or treated with ribociclib. (I) Cell cycle progression in MCF7 control and abemaciclib resistant cells untreated (UT) or treated with abemaciclib. (J) Cell cycle progression in MCF7 control and palbociclib resistant cells untreated (UT) or treated with palbociclib. The comparative analyses for 3A were between T47D_C and T47D resistant cells, and for 3C, they were between MCF7_C and MCF7 resistant cells. The comparative analysis for 3B and 3D were between control and resistant cells for each time point. For the cell cycle progression (3H, 3I, and 3 J), the comparisons were between G1 phase Control_T and G1 phase R_T.‘*’- p ≤ 0.05, ‘**’- p ≤ 0.01, ‘***’- p ≤ 0.001. All figures are representative of 3 or more experiments. Error bars represent standard error of mean between experiments.
Fig. 5
Fig. 5
RNA sequencing analysis. (A) Hierarchical clustering analysis (HCA) in T47D or MCF7 control and resistant cells. We used the mainstream hierarchical clustering to cluster the fpkm values of genes and homogenized the row (Z-score). The genes or samples with similar expression patterns in the heat map will be gathered together. The colour in each grid reflects not the gene expression value, but the value obtained after homogenizing the expression data rows (generally between—2 and 2). Therefore, the colours in the heat map can only be compared horizontally (the expression of the same gene in different samples), but not vertically (the same sample). There are not only inter group clustering, but also inter sample clustering. (B) Kyoto Encyclopedia of Genes and Genomes (KEGG) analysis in MCF7_RR compared to MCF7_control cells. The most significant 20 KEGG pathways were selected for display. The abscissa is the ratio of the number of differential genes linked with the KEGG pathway to the total number of differential genes. The ordinate is KEGG Pathway. The size of a point represents the number of genes annotated to a specific KEGG pathway. The colour from red to purple represents the significant level of the enrichment. (C) KEGG analysis in MCF7_RP compared to MCF7_control cells. (D) KEGG analysis in T47D_RR compared to T47D_control cells. (E) KEGG analysis in T47D_RP compared to T47D_control cells. See supplementary methods 2 for full details.
Fig. 6
Fig. 6
Barasertib sensitivity in CDK4/6i resistant MCF7 cells. (A) AukB transcript levels in MCF7 control and resistant cell lines. (B) Clonogenic assay of barasertib sensitivity in MCF7 control and resistant cell lines. (C) MCF7 control spheroids untreated (UT) or treated (T) with 800 nM of barasertib. (D) MCF7 ribociclib resistant spheroids untreated (UT) or treated (T) with 800 nM of barasertib. (E) MCF7 abemaciclib resistant spheroids untreated (UT) or treated (T) with 800 nM of barasertib. (F) MCF7 palbociclib resistant spheroids untreated (UT) or treated (T) with 800 nM of barasertib. (G) Spheroid size in MCF control and resistant cells untreated (UT) or treated (T) with 800 nM of barasertib. (H) Cell cycle progression in MCF control and resistant cells untreated (UT) or treated (T) with 800 nM of barasertib. (I) % apoptotic cells in MCF control and resistant cells untreated (UT) or treated (T) with 800 nM of barasertib. (J) AukB transcript expression and overall survival (OS) in clinical breast cancers. ‘*’- p ≤ 0.05, ‘**’- p ≤ 0.01, ‘***’- p ≤ 0.001. All figures are representative of 3 or more experiments. Error bars represent standard error of mean between experiments.
Fig. 7
Fig. 7
Volasertib sensitivity in CDK4/6i resistant MCF7 cells: (A) PLK1 transcript levels in MCF7 control and resistant cell lines. (B) Clonogenic assay of volasertib sensitivity in MCF7 control and resistant cell lines. (C) MCF7 control spheroids untreated (UT) or treated (T) with 800 nM of volasertib. (D) MCF7 ribociclib resistant spheroids untreated (UT) or treated (T) with 800 nM of volasertib. (E) MCF7 abemaciclib resistant spheroids untreated (UT) or treated (T) with 800 nM of volasertib. (F) MCF7 palbociclib resistant spheroids untreated (UT) or treated (T) with 800 nM of volasertib. (G) Spheroid size in MCF control and resistant cells untreated (UT) or treated (T) with 800 nM of volasertib. (H) Cell cycle progression in MCF control and resistant cells untreated (UT) or treated (T) with 800 nM of volasertib. (I) % apoptotic cells in MCF control and resistant cells untreated (UT) or treated (T) with 800 nM of volasertib. (J) PLK1 transcript expression and overall survival (OS) in clinical breast cancers. ‘*’- p ≤ 0.05, ‘**’- p ≤ 0.01, ‘***’- p ≤ 0.001. All figures are representative of 3 or more experiments. Error bars represent standard error of mean between experiments.

Similar articles

References

    1. Kastan, M. B. & Bartek, J. Cell-cycle checkpoints and cancer. Nature432, 316–323 (2004). - PubMed
    1. Baker, S. J. & Reddy, E. P. CDK4: A key player in the cell cycle, development, and cancer. Genes Cancer3, 658–669 (2012). - PMC - PubMed
    1. Fassl, A., Geng, Y. & Sicinski, P. CDK4 and CDK6 kinases: From basic science to cancer therapy. Science375, eabc1495 (2022). - PMC - PubMed
    1. Goel, S., Bergholz, J. S. & Zhao, J. J. Targeting CDK4 and CDK6 in cancer. Nat. Rev. Cancer22, 356–372 (2022). - PMC - PubMed
    1. Velasco-Velazquez, M. A. et al. Examining the role of cyclin D1 in breast cancer. Future Oncol.7, 753–765 (2011). - PubMed

MeSH terms