. 2025 Aug 5;15(1):25770.
doi: 10.1038/s41598-025-01720-w.

P-Rex2 suppresses glucose uptake into liver and skeletal muscle through different adaptor functions

Affiliations

P-Rex2 suppresses glucose uptake into liver and skeletal muscle through different adaptor functions

Elpida Tsonou et al. Sci Rep. .

Abstract

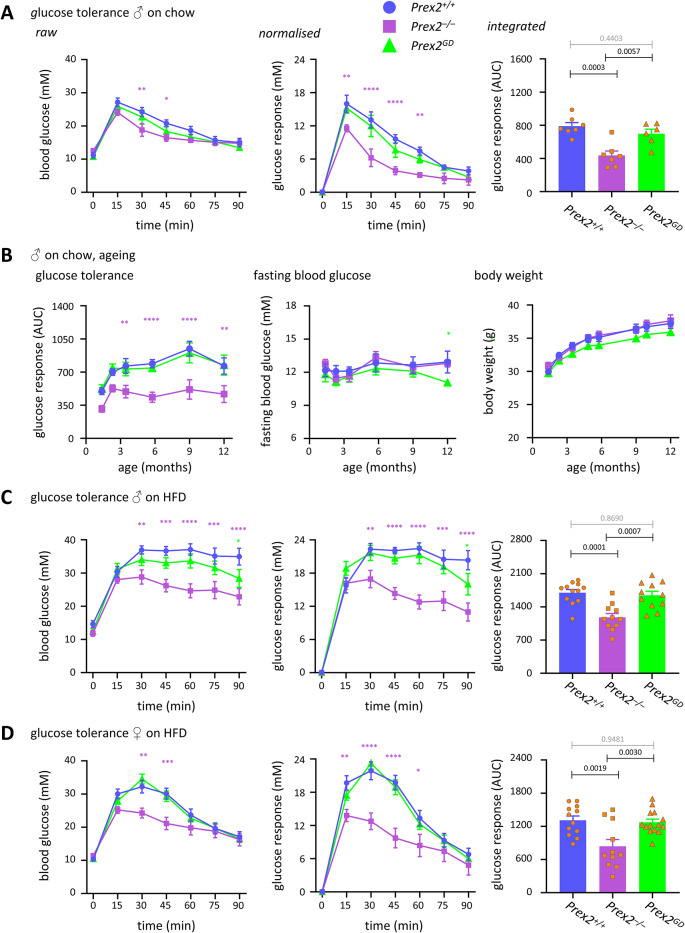
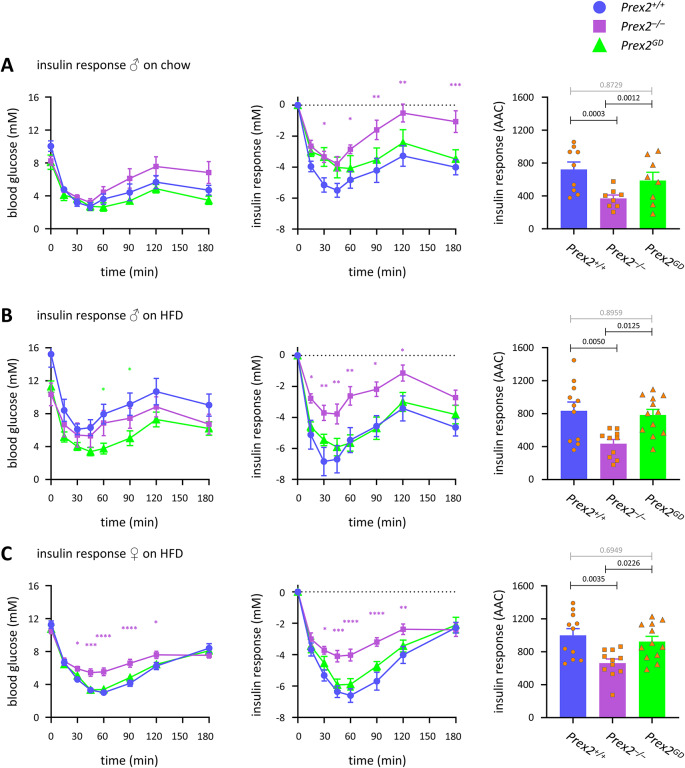
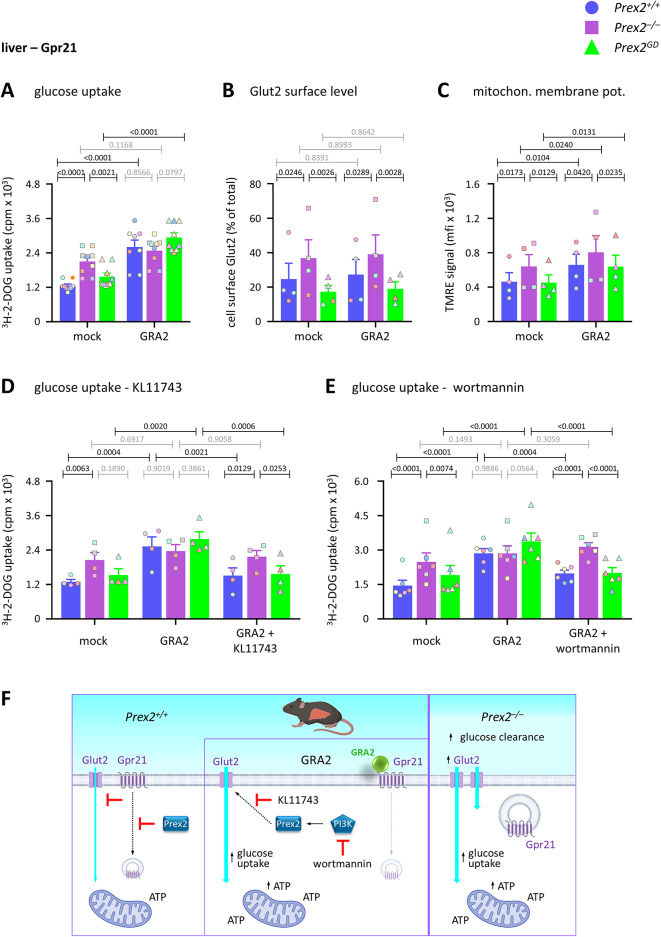
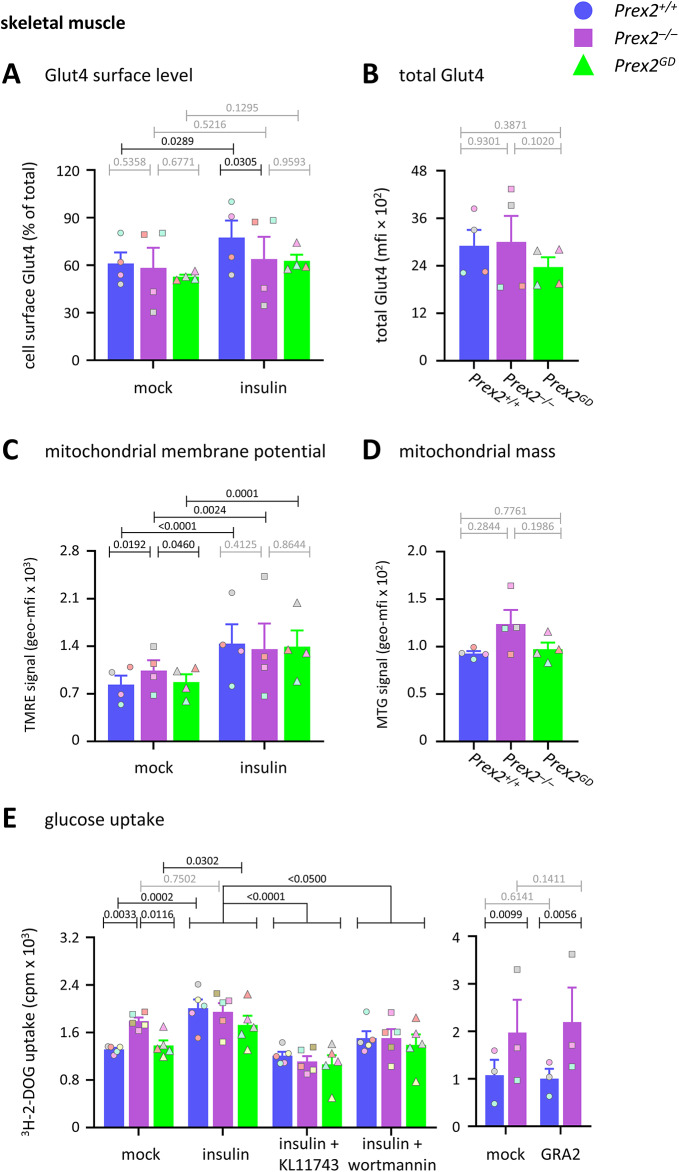
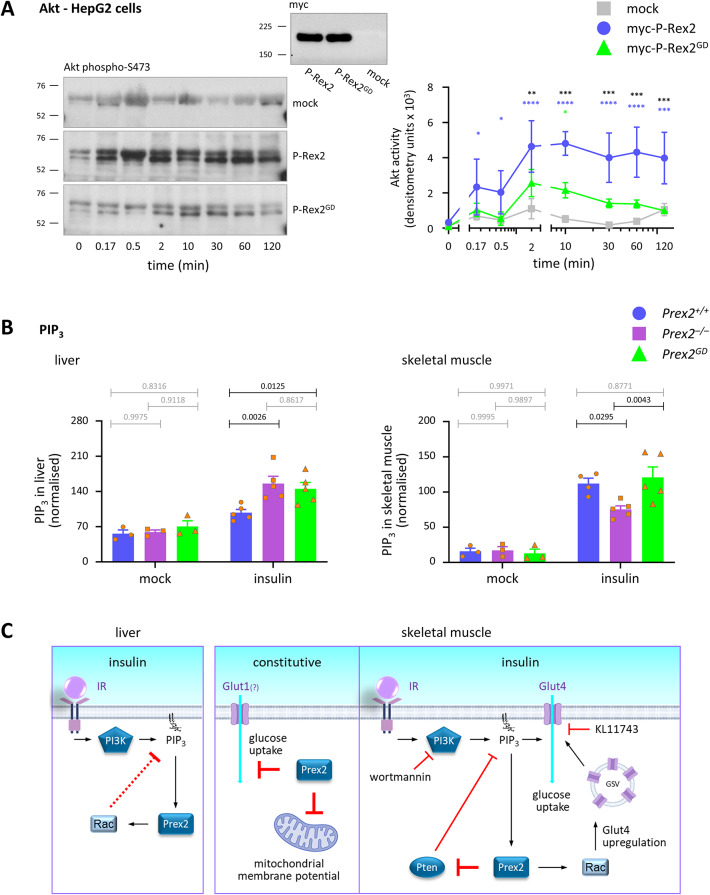
P-Rex2 is a Rac guanine-nucleotide factor (Rac-GEF) that controls glucose homeostasis. This role is thought to be mediated through its adaptor function inhibiting Pten rather than through its Rac-GEF activity, but this remains to be demonstrated. To examine this question, we have investigated the roles of P-Rex2 in glucose homeostasis using Prex2-/- and catalytically-inactive Prex2GD mice. We show that P-Rex2 is required for insulin sensitivity but limits glucose clearance, suppressing glucose uptake into liver and skeletal muscle independently of its catalytic activity. In hepatocytes, P-Rex2 suppresses Glut2 cell surface levels, mitochondrial membrane potential and mitochondrial ATP production. We identify the orphan GPCR Gpr21 as a P-Rex2 target and propose that P-Rex2 limits hepatic glucose clearance by controlling Gpr21 trafficking. In skeletal muscle cells, P-Rex2 suppresses glucose uptake through a separate adaptor function, independently of Gpr21. Additionally, P-Rex2 suppresses insulin secretion by pancreatic islets and plasma insulin levels. Finally, P-Rex2 plays distinct Rac-GEF activity dependent and independent roles in PIP3 production in liver and skeletal muscle, respectively. Together, our study identifies complex roles of P-Rex2 in glucose homeostasis, mediated through largely GEF-activity independent mechanisms which include the GPCR Gpr21 in hepatocytes and but are not obviously linked to the regulation of Pten.

Keywords: G protein-coupled receptor (GPCR); Glucose homeostasis; Gpr21; Guanine-nucleotide exchange factor (GEF); Liver; Mitochondria; P-Rex1; P-Rex2; Skeletal muscle.


Conflict of interest statement

Declarations. Competing interests: The authors declare no competing interests.

Figures

Fig. 1
Fig. 1
P-Rex2 limits glucose clearance in mice throughout ageing, independently of its GEF-activity, contributing to diet-induced glucose intolerance. (A, B) Glucose tolerance on chow diet. (A) The glucose tolerance of male Prex2+/+ (blue, circles), Prex2–/– (purple, squares), and Prex2GD (green, triangles) mice on chow diet was measured at the age of 6 months. Food was withdrawn for 6 h, fasting blood glucose tested, 2 g/kg glucose injected i.p., and blood glucose assessed again at the indicated time points. Left-hand panel: blood glucose concentration, middle: glucose response normalised to fasting blood glucose, right: integrated glucose response (AUC). Data are mean ± SEM of mice pooled from 2 independent cohorts of 3–4 mice per genotype; beige dots show individual mice. (B) Glucose tolerance (integrated response), fasting blood glucose and body weight of the cohorts in (A) measured at the indicated ages. (C, D) Glucose tolerance on high-fat diet (HFD). The glucose tolerance of 6-month-old male (C) and female (D) Prex2+/+, Prex2–/–, and Prex2GD mice on HFD was measured as in (A). Data are mean ± SEM of 3 independent cohorts of 3–4 (C) or 3–5 (D) mice per genotype; beige dots show individual mice. Statistics in time courses are two-way ANOVA with Sidak’s multiple comparisons correction; purple stars denote significance between Prex2+/+ and Prex2–/–, green between Prex2+/+ and Prex2GD. Statistics in bar graphs are one-way ANOVA with Tukey’s multiple comparisons test; p-values in black denote significant differences, p-values in grey are non-significant.
Fig. 2
Fig. 2
P-Rex2 is required for insulin sensitivity, independently of its catalytic activity. (A–C) Insulin sensitivity. Prex2+/+ (blue, circles), Prex2–/– (purple, squares), and Prex2GD (green, triangles) mice were fasted for 4 h, fasting blood glucose was measured, 0.75 IU/kg insulin s.c. injected, and blood glucose tested at the indicated timepoints. Mice in (A) were 10-month-old males on chow diet, in (B, C) 5-month-old males (B) or females (C) on HFD. Data are mean ± SEM of mice pooled from 2 independent cohorts of 3–4 mice per genotype (A), or 3 cohorts of 3–4 (B) or 3–5 (C) mice per genotype, the same cohorts as in Fig. 1; beige dots show individual mice. Left-hand panels: blood glucose concentration, middle: insulin response normalised to fasting blood glucose, right: integrated insulin response (AAC), beige dots show individual mice. Statistics in time courses are two-way ANOVA with Sidak’s multiple comparisons correction; purple stars denote significance between Prex2+/+ and Prex2–/–. Statistics in bar graphs are one-way ANOVA with Tukey’s multiple comparisons test; p-values in black denote significant differences, p-values in grey are non-significant.
Fig. 3
Fig. 3
P-Rex2 limits glucose-stimulated plasma insulin, pancreatic insulin secretion, and glucose uptake into liver and skeletal muscle, independently of its catalytic activity. (A) Glucose excretion. 15-week-old male and female Prex2+/+ (blue, circles), Prex2–/– (purple, squares), and Prex2GD (green, triangles) mice on HFD were fasted for 6 h before 2 g/kg glucose was i.p. injected. Urine was collected 90 min later and glucose concentration in urine assessed by ELISA. Data are mean ± SEM of 5 Prex2+/+, 4 Prex2–/–, and 6 Prex2GD mice pooled from 2 independent cohorts or 2–3 mice per genotype; beige symbols show individual mice. Statistics are one-way ANOVA with Tukey’s multiple comparisons test; p-values in grey are non-significant. (B) Plasma insulin. 15-week-old male Prex2+/+, Prex2–/–, and Prex2GD mice on HFD were fasted for 6 h and injected i.p. with water (0 time) or 2 g/kg glucose for 15 or 90 min, and insulin in blood plasma was analysed by ELISA. Data are mean ± SEM of mice pooled from 4 independent cohorts of 1–2 mice per group; beige symbols show individual mice. Statistics are two-way ANOVA with Sidak’s multiple comparisons correction. (C) Glucose-stimulated insulin secretion from pancreatic islets. Islets of Langerhans were isolated from the pancreas of 16-week-old female Prex2+/+, Prex2–/–, and Prex2GD mice on HFD. Left: Insulin secreted by 10 islets before and after stimulation with 2 mM glucose for 15 min and then 20 mM glucose for a further 45 min was detected by ELISA. Right: total insulin in lysates of 5 pancreatic islets. Data are mean ± SEM of 4–5 independent experiments; symbol colours mark individual experiments. Statistics on left are two-way ANOVA with Sidak’s multiple comparisons corrections, on right one-way ANOVA with Tukey’s multiple comparisons. (D, E) Glucose uptake into (D) liver cells and (E) skeletal muscle cells. Liver and skeletal muscle cells from 15-week-old Prex2+/+, Prex2–/–, and Prex2GD mice on chow diet were stimulated with 100 nM insulin for 10 min at 37 °C, or mock-stimulated, followed by the addition of 50 μM 2-DOG, 0.25 μCi 3H-2-DOG for 60 min. Cells were washed, lysed, and glucose uptake was measured by scintillation counting. Data are mean ± SEM of (D) 4 and (E) 9 independent experiments; symbol colours mark individual experiments. Statistics are two-way ANOVA with Sidak’s multiple comparisons correction. (AE) P-values in black denote significant differences, p-values in grey are non-significant.
Fig. 4
Fig. 4
P-Rex2 limits Glut2 surface level, mitochondrial membrane potential, and mitochondrial ATP production in liver cells. (A) Glut2 cell surface level. Liver cells from 15-week-old Prex2+/+ (blue, circles), Prex2–/– (purple, squares), and Prex2GD (green, triangles) mice on chow diet were stimulated with 5 mM glucose or 100 nM insulin for 10 min at 37 °C, or were mock-stimulated, stained with Glut2 antibody, analysed by flow cytometry, and the mean fluorescence intensity (mfi) of Glut2 surface level expressed as % of total Glut2. Data are mean ± SEM of 4 independent experiments; symbol colours mark individual experiments. (B) Total Glut2 was measured as in (A) except in permeabilised cells. Data are mean ± SEM of 4 independent experiments; beige symbols show individual experiments. (C) ATP production. Liver cells were analysed by Seahorse assay to quantify constitutive ATP production from glycolytic and mitochondrial respiration. Data are mean ± SEM of 5 independent experiments; symbol colours mark individual experiments. (D–F) Mitochondrial membrane potential. Liver cells were stained with MitoTracker Green (MTG), TMRE, and Hoechst 33342 DNA dye, and analysed by immunofluorescence microscopy (D), or they were stimulated with 5 mM glucose or 100 nM insulin for 30 min at 37 °C, or mock-treated, before staining with MTG and TMRE, and analysis by flow cytometry for (E) TMRE signal in MTG+ cells to quantify mitochondrial membrane potential and (F) MTG signal to quantify mitochondrial mass. Images in (D) are representative of 3 independent experiments. Data in (E, F) are mean ± SEM of 4 independent experiments; symbol colours mark individual experiments. Statistics in (A, C, E) are two-way ANOVA with Sidak’s multiple comparisons correction. Statistics in (B, F) are one-way ANOVA with Tukey’s multiple comparisons correction. P-values in black denote significant differences, p-values in grey are non-significant.
Fig. 5
Fig. 5
P-Rex2 limits glucose uptake into liver cells through Gpr21. (A) Glucose uptake. Liver cells from 15-week-old male Prex2+/+ (blue, circles), Prex2–/– (purple, squares), and Prex2GD (green, triangles) mice on chow diet were treated with 30 μM GRA2 for 3 h at 37 °C, or mock-treated, followed by the addition of 50 μM 2-DOG, 0.25 μCi 3H-2-DOG for 60 min. Cells were washed, lysed, and glucose uptake was measured by scintillation counting. Data are mean ± SEM of 9 independent experiments; symbol colours mark individual experiments. Statistics are two-way ANOVA with Sidak’s multiple comparisons correction. P-values in black denote significant differences, p-values in grey are non-significant. (B) Glut2 cell surface level. Liver cells were treated with 30 μM GRA2 for 3 h at 37 °C, or mock-treated, stained with Glut2 antibody, analysed by flow cytometry, and the mean fluorescence intensity (mfi) of Glut2 surface level expressed as % of total Glut2. Data are mean ± SEM of 4 independent experiments; symbol colours mark individual experiments. (C) Mitochondrial membrane potential. Liver cells were treated with 30 μM GRA2 for 30 min at 37 °C, or mock-treated, stained with MTG and TMRE, and analysed by flow cytometry for TMRE signal in MTG+ cells. Data are mean ± SEM of 4 independent experiments; symbol colours mark individual experiments. (D, E) Glucose uptake. Liver cells were pretreated with (D) 500 nM KL11743 or (E) 50 nM wortmannin for 30 min before treatment with 30 μM GRA2 for 3 h at 37 °C, or mock-treatment, followed by the addition of 50 μM 2-DOG, 0.25 μCi 3H-2-DOG for 60 min. Cells were washed, lysed, and glucose uptake was measured by scintillation counting. Data are mean ± SEM of (D) 4 and (E) 6 independent experiments; symbol colours mark individual experiments. Statistics (AE) are two-way ANOVA with Sidak’s multiple comparisons correction. P-values in black denote significant differences, p-values in grey are non-significant. (F) Model. P-Rex2 limits hepatic glucose clearance by suppressing glucose uptake into liver cells, independently of its Rac-GEF activity, through the constitutively-active, inhibitory GPCR Gpr21. This is likely to occur through the adaptor function of P-Rex2 in regulating the trafficking of active GPCRs, which will limit the internalisation of the Gpr21, thereby enabling Gpr21 to inhibit glucose uptake. Blockade of Gpr21 activity by GRA2 removes the inhibition of glucose uptake. Use of KL11743 and wortmannin under this condition revealed P-Rex2 as a mediator of class I glucose transporter activity and PI3K activity during glucose uptake, both through adaptor functions. In Prex2–/– liver cells, glucose uptake is increased because Gpr21 is internalised as the block of receptor endocytosis is removed, and Gpr21 can no longer inhibit glucose uptake.
Fig. 6
Fig. 6
P-Rex2 mediates the insulin-stimulated upregulation of Glut4 and limits mitochondrial membrane potential in skeletal muscle cells. (A) Glut4 cell surface level. Skeletal muscle cells from 15-week-old Prex2+/+ (blue, circles), Prex2–/– (purple, squares), and Prex2GD (green, triangles) mice on chow diet were stimulated with 100 nM insulin for 10 min at 37 °C, or mock-stimulated, stained with Glut4 antibody, analysed by flow cytometry, and the mean fluorescence intensity (mfi) of Glut4 surface level was expressed as % of total Glut4. Data are mean ± SEM of 4 independent experiments each; symbol colours mark individual experiments. (B) Total Glut4 was measured as in (A) except in permeabilised cells. Data are mean ± SEM of 4 independent experiments; beige symbols show individual experiments. (C, D) Mitochondrial membrane potential. Skeletal muscle cells were stimulated with 100 nM insulin, or mock-stimulated, stained with MTG and TMRE, and analysed by flow cytometry for (C) TMRE signal in MTG+ cells and (D) MTG signal. Data are mean ± SEM of 4 independent experiments; symbol colours mark individual experiments. (E) Glucose uptake. Left: Skeletal muscle cells from 15-week-old male Prex2+/+, Prex2–/–, and Prex2GD mice on chow diet were pretreated with 50 nM wortmannin or 500 nM KL11743 or for 30 min before stimulation with 100 nM insulin for 10 min, followed by the addition of 50 μM 2-DOG, 0.25 μCi 3H-2-DOG for 60 min. Cells were washed, lysed, and glucose uptake was measured by scintillation counting. Right: Skeletal muscle cells were treated with 30 μM GRA2 for 3 h, or mock-treated, followed by analysis of glucose uptake. Data are mean ± SEM of (left) 5 and (right) 3 independent experiments; symbol colours mark individual experiments. Statistics in (A, C, E) are two-way ANOVA with Sidak’s multiple comparisons correction. Statistics in (B, D) are one-way ANOVA with Tukey’s multiple comparisons correction. (AE) P-values in black denote significant differences, p-values in grey are non-significant.
Fig. 7
Fig. 7
P-Rex2 controls insulin-stimulated PIP3 production in liver and skeletal muscle through different mechanisms. (A) Insulin-stimulated Akt signalling in HepG2 cells. HepG2 cells were transfected with wild type or GEF-dead pCMV3-myc-P-Rex2, or mock-transfected, as indicated, serum-starved, and stimulated with 25 nM insulin for the times shown. Left: Total cell lysates were western blotted for phospho-S473 Akt. Representative blots are shown. Middle: To control for the expression of wild type and GEF-dead P-Rex2, total lysates were probed with myc antibody. Right: Blots were quantified by Fiji densitometry. Data are mean ± SEM of 4 independent experiments. Statistics are two-way ANOVA with Sidak’s multiple comparisons correction; black stars denote significance between P-Rex2 and P-Rex2GD, blue stars between mock and P-Rex2, green stars between mock and P-Rex2GD. (B) PIP3 production: 15–19-week-old male Prex2+/+ (blue, circles), Prex2–/– (purple, squares), and Prex2GD (green, triangles) mice on HFD were fasted for 4 h and injected i.p. with 10 U/kg insulin or mock-treated. After 8 min, the mice were humanely killed, and liver and anterior thigh skeletal muscle were recovered. Lipids were extracted and analysed by HPLC–MS. For each cohort, PIP3 levels (PIP3/PIP2 ratio) were normalised to the mean Prex2+/+ insulin response. Data are mean ± SEM of 3 mock-stimulated and 5 insulin-stimulated mice/group pooled from two independent cohorts. Statistics are two-way ANOVA with Sidak’s multiple comparisons correction; p-values in black denote significant differences, p-values in grey are non-significant. (C) Model. In insulin-stimulated hepatocytes, P-Rex2 suppresses PIP3 production through its Rac-GEF activity, by an unknown mechanism. In skeletal muscle cells, P-Rex2 constitutively limits glucose uptake and mitochondrial membrane potential through an adaptor function. In the presence of insulin, P-Rex2 is required for the upregulation of Glut4 through its Rac-GEF activity and for PIP3 production through an adaptor function, likely by inhibition of Pten. Use of KL11743 and wortmannin showed that glucose transporter activity and PI3K regulate glucose uptake in skeletal muscle cells independently of P-Rex2. Gpr21 is not involved in glucose uptake by skeletal muscle cells.

References

    1. Gerich, J. E. Physiology of glucose homeostasis. Diabetes Obes Metab2, 345–350. 10.1046/j.1463-1326.2000.00085.x (2000). - PubMed
    1. Machin, P. A., Tsonou, E., Hornigold, D. C. & Welch, H. C. E. Rho family GTPases and Rho GEFs in glucose homeostasis. Cells10, 10.3390/cells10040915 (2021). - PMC - PubMed
    1. Moller, L. L. V., Klip, A. & Sylow, L. Rho GTPases-emerging regulators of glucose homeostasis and metabolic health. Cells8, 10.3390/cells8050434 (2019). - PMC - PubMed
    1. Ueda, S., Kataoka, T. & Satoh, T. Activation of the small GTPase Rac1 by a specific guanine-nucleotide-exchange factor suffices to induce glucose uptake into skeletal-muscle cells. Biol Cell100, 645–657. 10.1042/BC20070160 (2008). - PubMed
    1. Ueda, S. et al. Crucial role of the small GTPase Rac1 in insulin-stimulated translocation of glucose transporter 4 to the mouse skeletal muscle sarcolemma. FASEB J24, 2254–2261. 10.1096/fj.09-137380 (2010). - PMC - PubMed