. 2025 Aug 5;16(1):7196.
doi: 10.1038/s41467-025-61427-4.

Functional avidity of anti-B7H3 CAR-T constructs predicts antigen density thresholds for triggering effector function

Affiliations

Functional avidity of anti-B7H3 CAR-T constructs predicts antigen density thresholds for triggering effector function

Marta Barisa et al. Nat Commun. .

Abstract

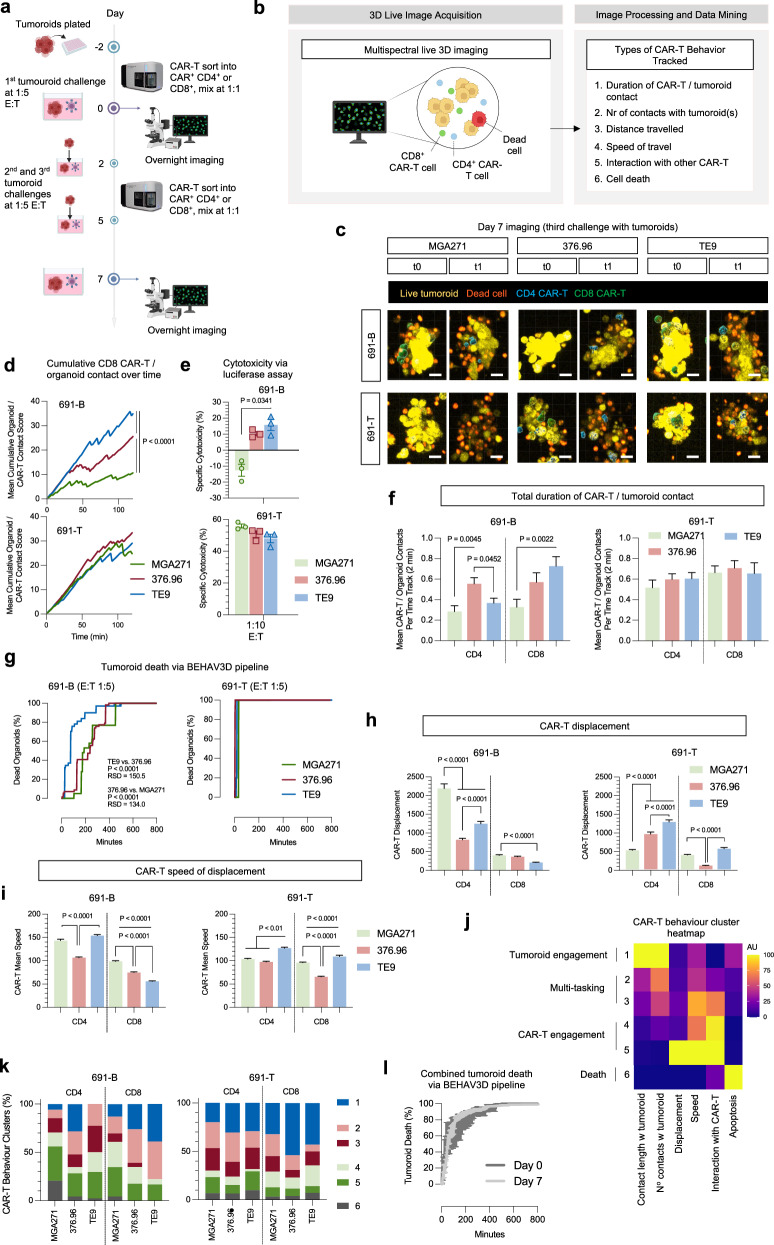
Chimeric Antigen receptor T cell (CAR-T) treatments for solid cancers have been compromised by limited expansion and survival in the tumor microenvironment following interaction with antigen-expressing target cells. Using B7H3 as a model antigen with broad clinical applicability, we evaluate the relationship between the antibody/antigen affinity of three clinical candidate binders and the three following characteristics: cellular avidity, duration of sustained cytotoxicity in tumoroid re-stimulation assays, and in vivo anti-tumoral responses. Next, BEHAV3D video microscopy is used to assess CAR-T cell interaction with tumor cells at single cell resolution. These data are consistent with a threshold avidity of CAR-T / tumor cell interaction and target cell B7H3 expression level, where enhanced functionality is characterized by longer cumulative CD8+ CAR-T / tumor target interaction times, CAR-T cell expansion and sustained tumor control. Lower checkpoint receptor expression does not correlate with enhanced anti-tumor function. These results provide further insights into design of anti-B7H3 CAR-T cells for antigen-dim cell targeting, and avoidance of antigen-dim tumor relapse.


Conflict of interest statement

Competing interests: M.Ba, J.A., K.C., K.B., and M.Bu hold patents in CAR-T technology development, including a pending patent for the TE9 anti-B7H3 binder. J.A. holds founder shares in Autolus. R.N., R.R., and D.S. were employed by Lumicks at the time of performing the experiments. The remaining authors declare no competing interests.

Figures

Fig. 1
Fig. 1. MGA271, 376.96 and TE9 scFv’s mediate divergent CAR-T responses against in vivo models of medulloblastoma and neuroblastoma.
a Schematic of the SFG backbone retroviral constructs. b Schematic of orthotopic, luciferase+ Med8A medulloblastoma tumor model in NSG mice with representative pre-treatment images. The experiment was repeated twice; each treatment group is representative of at least N = 5 animals. c Serial tumor luminescence measurements including at instances of metastatic relapse. d Event (acute tumor burden toxicity)-free survival was compared between the different T cell treatment groups (Log-Rank Mantel–Cox Test 376 x MGA p = 0.018; TE9 x MGA p = 0.056). e Representative pre-treatment images of luciferase+ LAN-1 neuroblastoma tumor model in NSG mice (N = 5). f Serial tumor luminescence measurements for all animals. g Event (tumors exceeding permissible 1 × 109 p/s/cm²/sr threshold prior to cull on ethical grounds)-free survival (log-rank Mantel–Cox test 376 x NT p = 0.0051; TE9 x NT p = 0.0053; MGA x NT p = 0.0296). h Tumors from LAN-1-engrafted animals were collected at cull and processed for flow cytometric analysis to assess live human T cell content of total live cells within the tumor mass (error bars ± SEM, N = 5; Kruskal–Wallis test). i Schematic of metastatic, luciferase+ SKN-A-S neuroblastoma tumor model in NSG mice. j SKN-A-S model: event (acute toxicity from tumor burden)-free survival of non-transduced or TE9 CAR-T cell treatment combined with 1.75 Gy total body irradiation (TBI) (N = 9; log-rank Mantel–Cox test). k Preliminary data from a single experiment of SKN-A-S treatment with 1.75. Gy TBI and MGA271 or 376.96 binder-CAR-T cells. Representative luminescence data over time on the left, and event (acute toxicity from tumor burden)-free survival comparison on the right: 8–9 animals per group; comparisons using a log-rank Mantel–Cox test.
Fig. 2
Fig. 2. 376.96 and TE9 but not MGA271 CAR-T form high avidity interactions with tumor cells in a B7H3 density-dependent manner.
a, b Cryopreserved, thawed CAR-T cell surface transgene expression was measured using flow cytometry with clone QBEND10 mAb to detect RQR8 marker gene and histidine-x6 tagged B7H3 protein (B7H3-his) + anti-his mAb to detect the CAR (mean ± SEM, N = 3 donors, two-way ANOVA MGA versus 376.98 p = 0.0257 MGA versus TE9 P = 0.0026). Representative dot plots of gated live (CD3+) T cells from one donor shown in (b). c CAR-T cells stained with Protein L (binds κ light chain) or anti-murine Fab. Representative histograms from one donor gated on live (CD3+) T cells. Binder 376.96 (λ-light chain) is noninformative with protein L staining and MGA271 (humanized framework) is noninformative for anti-mouse Fab. d Relative cell surface expression of RQR8 and CAR was compared between TE9 and MGA271 CAR-T cells using Earth Mover’s Distance (EMD) analysis of the flow cytometry data for RQR8, B7H3-his and Protein L. RQR8 was used as a marker of overall transduction whilst B7H3-his is marker of CAR binding to B7H3; Protein L is marker of CAR surface expression, and EMD measured transduced T cell staining compared to donor-matched non-transduced T cells. Marker expression was compared across three independent T cell donors, and statistical comparison done across linear regression curve slopes using Dunnett’s T3 Multiple Comparisons test (TE9 B7-his vs MGA B7-his p = 0.0115, TE9 B7-his vs TE9-pL p = 0.0054, TE9-pL vs MGA-pL p = 0.0235). Individual donor EMD data were in Supplementary Fig. 5c–e. e, f Binder affinity for B7H3 (4-Ig) using whole antibodies in IgG1 format, using Biacore Surface Plasmon Resonance (SPR). g Association (“on-rate”) and dissociation (“off-rate”) rate constants. h Binder affinity plotted against the gMFI of B7H3-his protein staining of three independent donor CAR-T cell products. i Respective geometric mean fluorescence intensities (gMFI) of B7H3-PE staining of a range of target cells. j Principle of Lumicks z-Movi synapse avidity measurement platform. k CAR-T detachment plotted against force in pN applied to the T cell/target interaction. Line indicates mean T cell attachment of four independent donors across three experimental replicates with matched donors compared for each construct: shaded area represents SEM. l Avidity as represented by attachment at 1000 pN applied force: N = 4 donors, each with three experimental replicates, one-way ANOVA. m Bound CAR-T (%) at 1000 pN plotted against QuantiBright defined B7H3 molecules per cell. The lines are linear regressions of the means of four individual donors (two-way ANOVA).
Fig. 3
Fig. 3. TE9 and 376.96, but not MGA271 CAR-T, respond to B7H3 ultra-dim tumor targets in serial re-challenge cytotoxicity assays.
a Number of B7H3 molecules/cell (QuantiBright flow cytometry assay) for evaluated target cell lines n = at least 3 technical replicates per cell line. b CAR-T cell cytotoxicity against LAN-1 and Kelly neuroblastoma cell lines at high E:T ratios (4 h 51Cr release assay). “Specific cytotoxicity” denotes cytotoxicity relative to non-transduced (NTD) T cell controls (mean ± SEM, N = 3 donors, two-way ANOVA). c CAR-T cell cytotoxicity against LAN-1 and SK-N-SH neuroblastoma cell lines at low E:T ratios (72 h flow cytometry-based cytotoxicity assay). “Specific cytotoxicity” denotes cytotoxicity relative to non-transduced (NTD) T cell controls (mean ± SEM, N = 3 donors (two technical replicates per donor), Two-way ANOVA for LAN1 376 vs MGA p = 0.003, TE9 vs MGA p = 0.02 for SKNSH 376 vs MGA p = 0.001, TE9 vs MGA p = 0.004). d CAR-T cell cytotoxicity against GFP/Luc-engineered tumoroids by overnight luminescence-based assay. “Specific cytotoxicity” denotes cytotoxicity relative to NTD T cell controls (mean ± SEM, n = 2 biological replicates for MGA and 376, n = 1 biological replicate for TE9: representative of two independent experiments, each with an n = 3 technical replicates; two-way ANOVA 376 vs MGA p = 0.0017, TE9 vs MGA p = 0.0002). eg Re-challenge assay timecourse (e), against f neuroblastoma tumoroids and g malignant rhabdoid tumoroids (MRT); gray arrows indicate re-challenge with tumor. In (f), data were mean ± SEM of n = 2 biological replicates for MGA and 376, n = 1 biological replicate for TE9: two independent experiments, each with an n = 3 technical replicates; “specific cytotoxicity” denotes cytotoxicity relative to NTD T cell controls; two-way ANOVA; uncorrected Fisher’s LSD with a single pooled variance in (f) 376 vs MGA p = 0.002, TE9 vs MGA p = 0.0055. In g, ”specific cytotoxicity” denotes cytotoxicity relative to tumor alone controls plated in parallel, data were mean ± SEM, N = 1 independent T cell donor across three experimental replicates: two-way ANOVA; Dunnett’s multiple comparisons test, with a single pooled variance 376 vs MGA p = 0.016, TE9 vs MGA p = 0.02. h Representative microscopy images of 103-T Malignant Rhabdoid Tumor tumoroid killing by TE9 CAR-T. The experiment was conducted once at this E:T ratio. i Flow cytometric analysis after CAR-T cell co-culture (691-B and 691-T tumoroids shown in (f)) was pooled across the replicates, dimensionality reduced using PCA, and grouped according to CAR, target and time-point (T0, pre-challenge with targets; T1, 1 week of challenge; T2, 2 weeks of challenge; T3, 3 weeks of challenge). The colored dots represent concatenated individual conditions, whereas the text in green is descriptive of the phenotype each PCA quadrant is enriched for. The arrows indicate the strength (arrow length) and direction of the contribution of each phenotypical marker to the two principal components, indicating that samples on the same side as a certain arrow have a high expression of that phenotypic marker; n = 1 biological replicate from a single experimental run, of three pooled technical replicates. j 1:10 E:T ratio cytotoxicity for the first and 3rd week challenge from the assays showed in panels (f, g) plotted against antigen density (Quantibright); line = mean cytotoxicity, shaded area  = SEM:n = 2 biological replicates for MGA and 376, n = 1 biological replicate for TE9: two independent experiments, each with an n = 3 technical replicates.
Fig. 4
Fig. 4. High avidity interaction with target cells drives CAR-T proliferation and sustained effector function.
a, b CAR-T cells stimulated with irradiated LAN-1 or Kelly neuroblastoma cells at a 1:1 E:T ratio every 7 days; IFN-γ (a) and IL-2 (b) measured in 24 h post stimulation supernatants (mean ± SEM, N = 3 independent donors, two-way ANOVA). c T cell numbers in same cocultures evaluated using precision count beads and flow cytometry (mean ± SEM, N = 3 independent donors, two-way ANOVA). d T cell counts were performed using the same precision count bead methodology in 72 h low E:T ratio LAN-1 and SK-N-SH cocultures, cytotoxicity for which is shown in Fig. 3c (mean ± SEM, N = 3 independent donors, two-way ANOVA: for LAN1 376 vs MGA 0.0168, TE9 vs MGA p = 0.0036). e, f Relative T cell proportions measured using flow cytometry in 691-B and 691-T tumor cocultures over 3 weeks of weekly tumor challenges at an E:T ratio of 1:10. Gated on single cells of harvested cultures (T cells and tumor cells) at days 14 and 21 and gated on all cells at day 0 prior to targets being added, representative dot plots from one donor CAR-T are shown. The numbers shown on the plots are indicative of % live tumor and % live T cells within each culture of total cells.
Fig. 5
Fig. 5. High avidity interactions drive CAR-T proliferation and cytotoxicity in brain tumor models.
a B7H3 molecules per cell were quantified using QuantiBright flow cytometry assay; brain tumor targets in blue, neuroblastoma and rhabdoid tumor targets in gray. b T cell proliferation in response to live brain tumor cell challenge at a 1:1 E:T ratio quantified after 6 days of co-culture (mean ± SEM, three independent T cell donors across two experimental replicates, Kruskal–Wallis test). c T cell fold-expansion plotted against number of B7H3 molecules per target cell; symbols represent mean proliferation of the different donors and replicates; lines are simple linear regression curves. d Mean fold-proliferation of CAR-T cells against Med8a and LAN-1 cells plotted against mean avidity at 1000 pN for the two cell lines. Symbols represent the mean proliferation of the different donors and replicates; the lines are simple linear regression curves.
Fig. 6
Fig. 6. High avidity drives the elimination of antigen-dim targets.
a Constructs for generation of B7H3 and GFP/luciferase sublines of SupT1 cells. b Expression of B7H3 in the unsorted “SupT1-B7H3range“ and flow-sorted “SupT1-B7H3hi“ cells. c Rechallenge assay experimental schematic. d Cytotoxicity was measured by luciferase signal as relative to tumor luminescence in the presence of donor-matched non-transduced (NTD) T cells (mean ± SEM, two-way ANOVA). e T cell numbers in the same assay following either a range of challenges with tumor targets or f target-free (mean ± SEM, two-way ANOVA). g Cytokine measurements in co-culture supernatants following a single challenge with SupT1-B7H3range targets at a 1:1 E:T ratio (mean ± SEM, two-way ANOVA). h B7H3 expression on targets measured using flow cytometry following the fifth re-challenge. Shown are concatenated histograms that were generated by combining flow data adjusted for 10,000 SupT1 cells per sample. i The same SupT1-B7H3range positivity for antigen as analyzed in each sample separately (mean represents geometric mean fluorescence intensity (gMFI) ± SEM, two-way ANOVA). j Schematic of leukemia model using SupT1-B7H3range T cell lymphoma cells. k, l Concatenated histograms (k) and graphical representation (l) showing B7H3 expression in gated SupT1 tumor cells in bone marrow at day 14 following CAR-T cell infusion. The samples with 500 or fewer gated tumor cell events were uniformly excluded from quantitation, as shown: error bars show SEM: two-way ANOVA. m Quantification of CAR-T cells in bone marrow at day 14 post-T cells; N = 5, error bars show SEM, two-way ANOVA. n Respective CAR fold-proliferation in response to five challenges with SupT1-B7H3range targets plotted against IL-2 production following the initial challenge. o IL-2 production after first challenge plotted against the mean avidity for SupT1-B7H3hi targets at 1000 pN. p Proliferation after five challenges with targets was plotted against the mean avidity that the respective CARs achieved when combined with SupT1-B7H3hi targets at 1000 pN. q SupT1-B7H3range cell B7H3 gMFI after five challenges with targets was plotted against the mean avidity that the respective CARs achieved when combined with SupT1-B7H3hi targets at 1000 pN. In nq each symbol represents an individual donor experimental replicate, the lines are simple linear regressions. For all data in the panels: N = 4 independent donors across four experimental replicates.
Fig. 7
Fig. 7. Higher CAR binder B7H3 avidity is associated with increased CD8± CAR-T / tumoroid contact duration and more rapid cytotoxicity against B7H3ultra-dim tumoroids.
a, b experimental overview- images created with BioRender. (Barisa, M. (2025) https://BioRender.com/ub1tswj). c Illustrative stills of tumoroid and T cell clusters at the start (day 0 = t0), and end (day 7 = t1) 800 min imaging sessions. d CD8+ CAR-T cell cumulative contact time with 691-B and 691-T organoids was tracked for the first 2 h of the first tumor challenge on day 0. The line represents the mean cumulative tumoroid contact score of all the individual CAR-T cells that were successfully tracked for the full 120 min period (the number of cells tracked in each of the conditions was a mean 31.33 ± 10.8; curves were compared using simple linear regressions). e CAR-T cells were incubated with tumoroids overnight at a 1:10 E:T ratio. “Specific cytotoxicity” denotes tumor luminescence relative to matched non-transduced T cell (NTD) controls (mean ± SEM, N = 3 independent experimental replicates, Kruskal–Wallis test). fi Respective parameters were tracked for the entire duration (800 min) of the first tumor challenge at day 0. f CD4+ and CD8+ CAR-T cell cumulative contact time with 691-B and 691-T organoids (mean ± SEM, N = 31.5 ± 10.6 cells per T cell condition, Two-Way ANOVA). g Cumulative tumoroid death (conversion from viability dye yellow to red) (a total of 398 incremental timepoints were recorded to track tumoroid apoptosis over the assay; curve comparison was carried out using a Friedman test for P value and rank sum differences (RSD)). h CD4+ and CD8+ CAR-T displacement (mean ± SEM, N = 31.5 ± 10.6 cells per T cell condition, two-way ANOVA). i Mean speed of CD4+ and CD8+ CAR-T displacement (mean ± SEM, N = 31.5 ± 10.6 cells per T cell condition, two-way ANOVA). j Trends in CAR-T behavior reduced into six clusters using UMAP analysis of behaviors across all the conditions observed in the initial tumor challenge at day 0 and represented as a heatmap. k The CAR-T behaviors are broken down by T cell, binder and target type. l Pooled data from all CAR constructs against both targets, comparing day 0 and day 7 challenge rate of organoid death.

References

    1. Albelda, S. M. CAR T cell therapy for patients with solid tumours: key lessons to learn and unlearn. Nat. Rev. Clin. Oncol.21, 47–66 (2024). - PubMed
    1. Majzner, R. G. & Mackall, C. L. Tumor antigen escape from CAR T-cell therapy. Cancer Discov.8, 1219–1226 (2018). - PubMed
    1. Labanieh, L. & Mackall, C. L. CAR immune cells: design principles, resistance and the next generation. Nature614, 635–648 (2023). - PubMed
    1. Weber, E. W. et al. Transient rest restores functionality in exhausted CAR-T cells through epigenetic remodeling. Science372, eaba1786 (2021). - PMC - PubMed
    1. Weber, E. W. et al. Pharmacologic control of CAR-T cell function using dasatinib. Blood Adv.3, 711–717 (2019). - PMC - PubMed