. 2025 Aug;5(8):1589-1600.
doi: 10.1038/s43587-025-00925-y. Epub 2025 Aug 5.

Large-scale genome-wide analyses with proteomics integration reveal novel loci and biological insights into frailty

Collaborators, Affiliations

Large-scale genome-wide analyses with proteomics integration reveal novel loci and biological insights into frailty

Jonathan K L Mak et al. Nat Aging. 2025 Aug.

Abstract

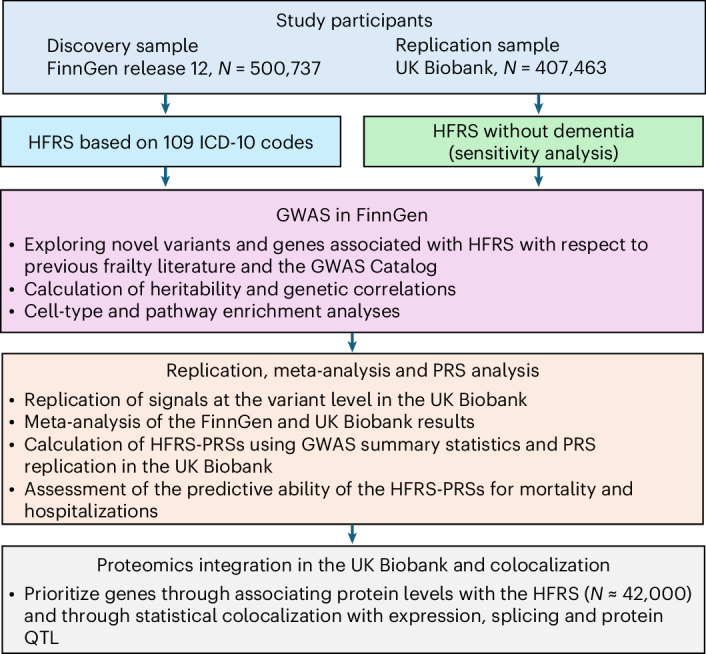
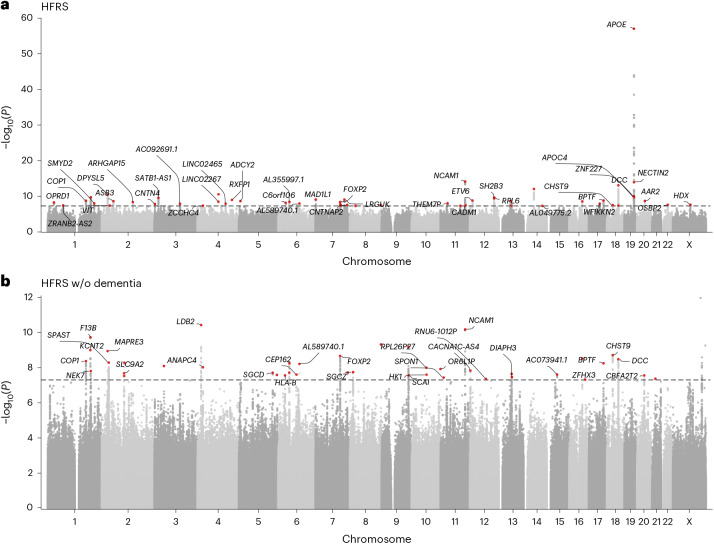
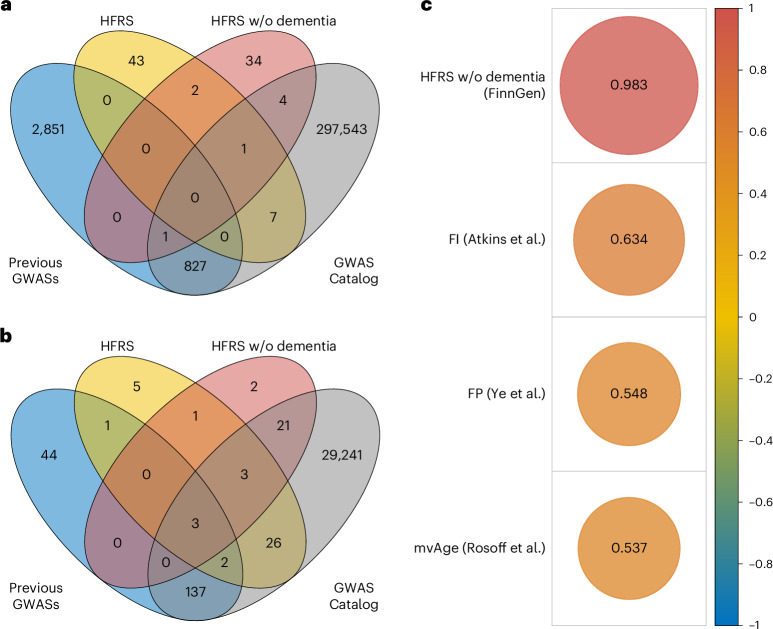
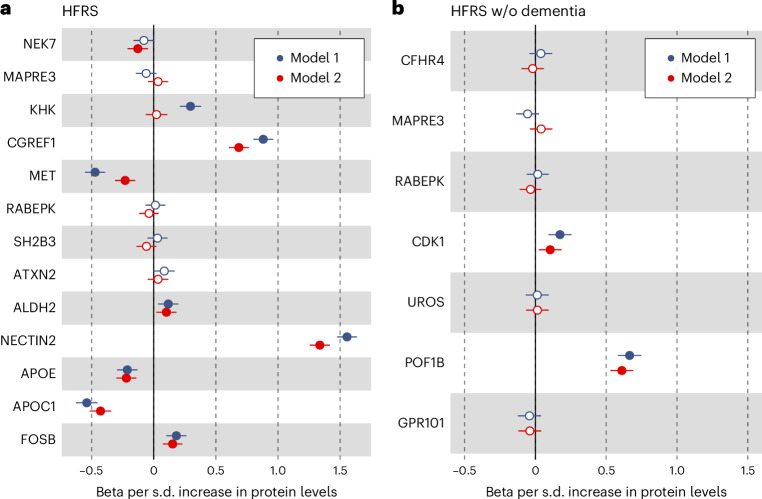
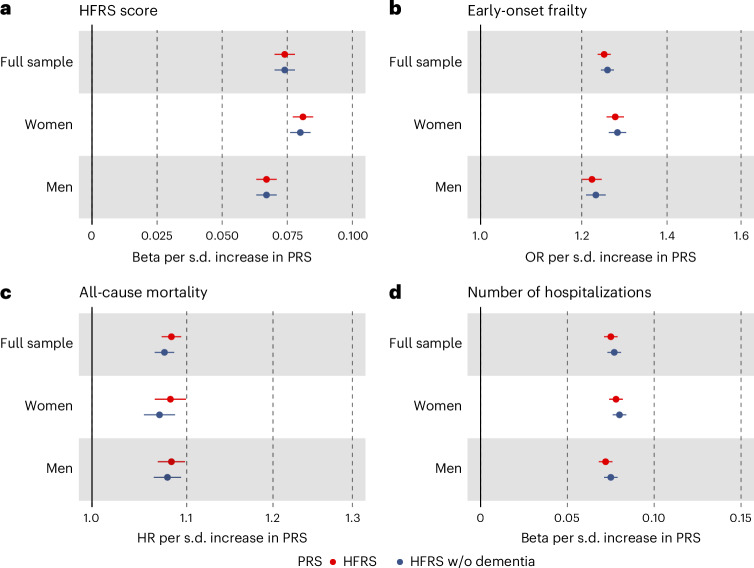
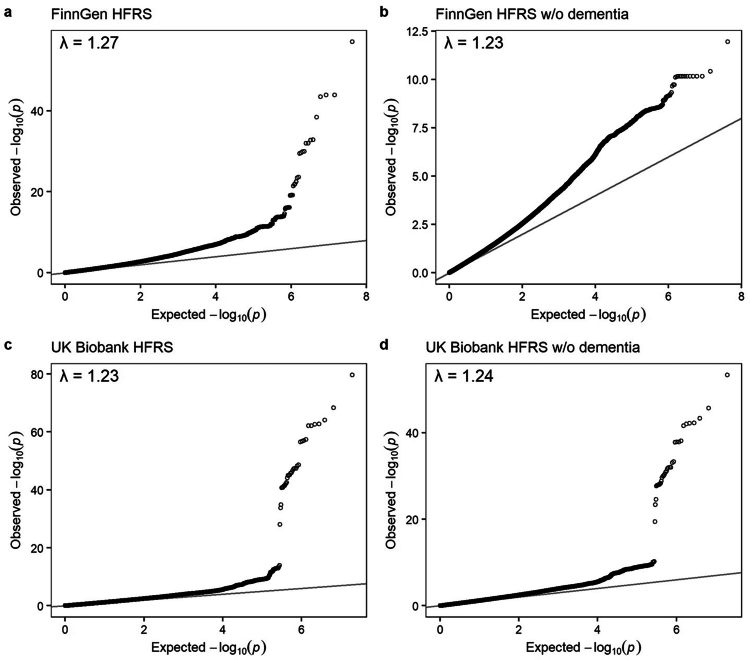
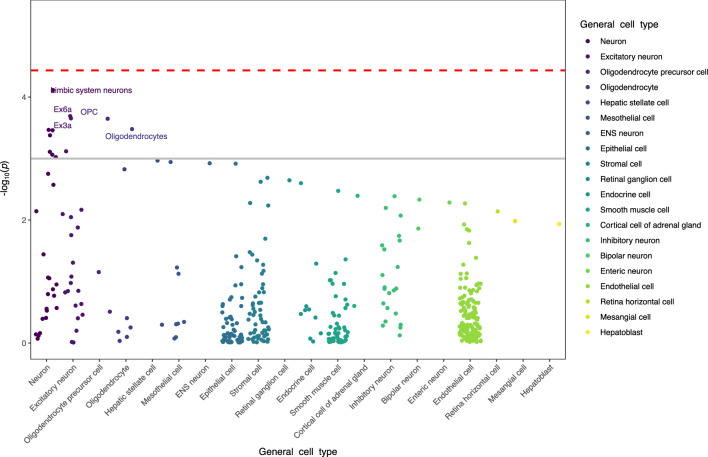
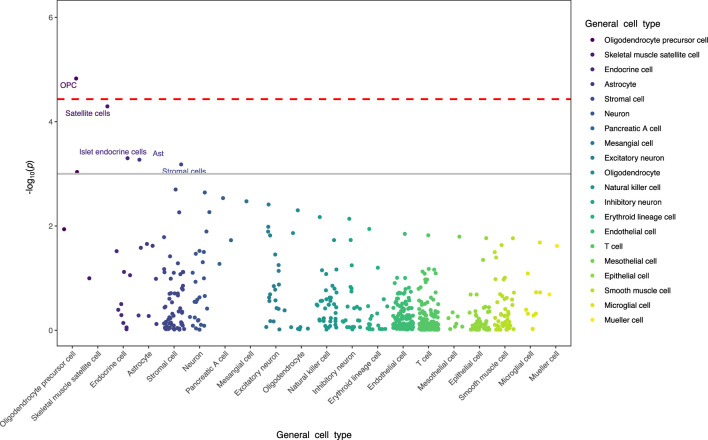
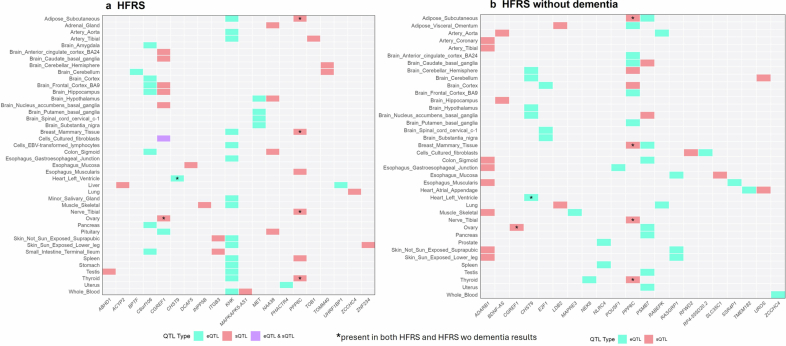
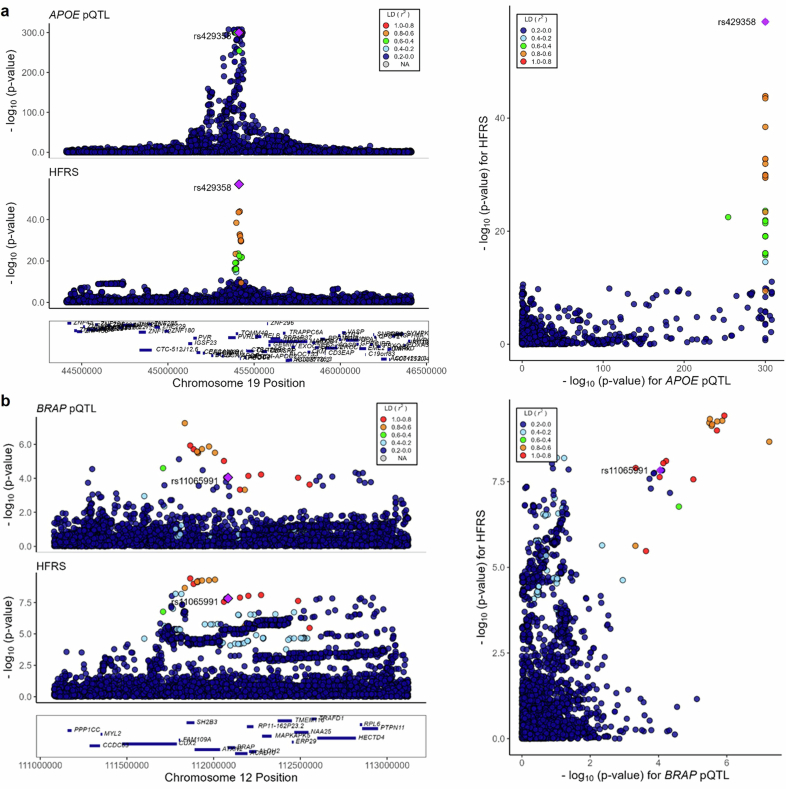
Frailty is a clinically relevant phenotype with notable gaps in our understanding of its etiology. Using the Hospital Frailty Risk Score (HFRS) to define frailty, we performed a genome-wide association study in FinnGen (N = 500,737), replicated the results in the UK Biobank (N = 407,463) and performed a meta-analysis. We prioritized genes through colocalization with expression, splicing and protein quantitative trait loci and proteomics integration. We identified 53 independent lead variants associated with frailty (P < 5 × 10⁻⁸), of which 45 were novel and not previously reported in the GWAS Catalog. Replication at the individual variant and polygenic risk score of the HFRS (P = 1.86 × 10-522) levels and meta-analysis largely confirmed the findings. Colocalization analysis supported a causal role for several genes, including CHST9, C6orf106 (ILRUN), KHK, MET, APOE, CGREF1 and PPP6C. Additionally, plasma levels of MET, CGREF1 and APOE were associated with HFRS. Our results reveal new genetic contributions to frailty and shed light on its biological basis.


Conflict of interest statement

Competing interests: The authors declare no competing interests.

Figures

Fig. 1
Fig. 1. Outline of the study.
Discovery GWASs of HFRS and HFRS without dementia were performed in FinnGen to identify genetic variants associated with frailty. The significant variants (P ≺ 5 × 10−8) were then replicated in the UK Biobank, and a meta-analysis of the FinnGen and UK Biobank results was performed. The GWAS summary statistics of FinnGen were used to calculate HFRS-PRSs, which were then assessed for their association with mortality and hospitalizations in the UK Biobank. Finally, protein association and colocalization analyses were performed to prioritize genes and identify causal variants.
Fig. 2
Fig. 2. GWAS results in FinnGen.
a,b, Manhattan plots for the associations with HFRS (a) and HFRS excluding dementia (b) in FinnGen using linear mixed-effects modeling adjusted for birth year, sex and the first ten PCs. The dashed lines indicate the genome-wide significance threshold (P = 5 × 10−8). The annotations represent the independent lead variants associated with frailty.
Fig. 3
Fig. 3. Lead variants and genes and genetic correlations of the HFRS.
a, Venn diagram showing the overlap of the lead variants associated with the full HFRS and the HFRS without dementia in FinnGen and those reported in the literature. Previous GWASs refers to genes identified in for the FI, FP and mvAge. b, Venn diagram showing the overlap of the lead variant genes associated with the full HFRS and the HFRS without dementia in FinnGen and those reported in the literature. c, Genetic correlations between HFRS in FinnGen and other frailty-related traits estimated using linkage disequilibrium score regression. All the correlations were statistically significant at P < 2.2 × 10−16.
Fig. 4
Fig. 4. Proteomics integration in the UK Biobank.
a,b, Protein associations (beta coefficients) with the full HFRS (a) and HFRS without dementia (b) the in the UK Biobank using linear regression models (N = 34,879–42,495; exact N for each model is given in Supplementary Table 10). All models were adjusted for birth year, sex and the first ten PCs (model 1), and additionally adjusted for batch, baseline assessment center, BMI and smoking (model 2). Solid dots indicate statistically significant associations at an FDR < 0.05. The bars indicate 95% confidence intervals.
Fig. 5
Fig. 5. HFRS-PRSs, frailty, mortality, and hospitalizations.
ad, Associations of the HFRS-PRSs with the HFRS (a), early-onset frailty (b), all-cause mortality (c) and number of hospitalizations (d) in the UK Biobank (N = 407,463). All models included birth year, birth region, sex and the first ten PCs as covariates. The bars indicate 95% confidence intervals of the beta coefficients, odds ratios (ORs) and hazard ratios (HRs).
Extended Data Fig. 1
Extended Data Fig. 1. QQ-plots of association summary statistics for the HFRS and HFRS without dementia.
Panels a and b show results for FinnGen, and panels c and d for the UK Biobank, respectively.
Extended Data Fig. 2
Extended Data Fig. 2. Cell-type enrichment analysis of HFRS.
Top 20 enriched cell types for the variants associated with the HFRS in FinnGen are shown.
Extended Data Fig. 3
Extended Data Fig. 3. Cell-type enrichment analysis of HFRS without dementia.
Top 20 enriched cell types for the variants associated with the HFRS without dementia in FinnGen are shown.
Extended Data Fig. 4
Extended Data Fig. 4. Colocalized expression and splicing quantitative trait loci.
Colocalized eQTL and sQTL by tissue with the genes associated with (a) HFRS and (b) HFRS without dementia. For each gene, the posterior probability for a shared causal variant was >80%.
Extended Data Fig. 5
Extended Data Fig. 5. Regional association plots for gene loci.
Regional association plots for gene loci – panel a for APOE and panel b for BRAP – identified in the colocalization analysis of protein quantitative trait loci (pQTL) and the variants associated with the Hospital Frailty Risk Score (HFRS).

Similar articles

References

    1. Clegg, A., Young, J., Iliffe, S., Rikkert, M. O. & Rockwood, K. Frailty in elderly people. Lancet381, 752–762 (2013). - PMC - PubMed
    1. Kojima, G., Iliffe, S. & Walters, K. Frailty index as a predictor of mortality: a systematic review and meta-analysis. Age Ageing47, 193–200 (2018). - PubMed
    1. Theou, O., Brothers, T. D., Mitnitski, A. & Rockwood, K. Operationalization of frailty using eight commonly used scales and comparison of their ability to predict all-cause mortality. J. Am. Geriatr. Soc.61, 1537–1551 (2013). - PubMed
    1. Gilbert, T. et al. Development and validation of a Hospital Frailty Risk Score focusing on older people in acute care settings using electronic hospital records: an observational study. Lancet Lond. Engl.391, 1775–1782 (2018). - PMC - PubMed
    1. Searle, S. D., Mitnitski, A., Gahbauer, E. A., Gill, T. M. & Rockwood, K. A standard procedure for creating a frailty index. BMC Geriatr.8, 24 (2008). - PMC - PubMed

LinkOut - more resources