. 2025 Sep;17(9):2299-2331.
doi: 10.1038/s44321-025-00279-3. Epub 2025 Aug 5.

Convergent activation of the integrated stress response and ER-mitochondria uncoupling in VAPB-associated ALS

Affiliations

Convergent activation of the integrated stress response and ER-mitochondria uncoupling in VAPB-associated ALS

Curran Landry et al. EMBO Mol Med. 2025 Sep.

Abstract

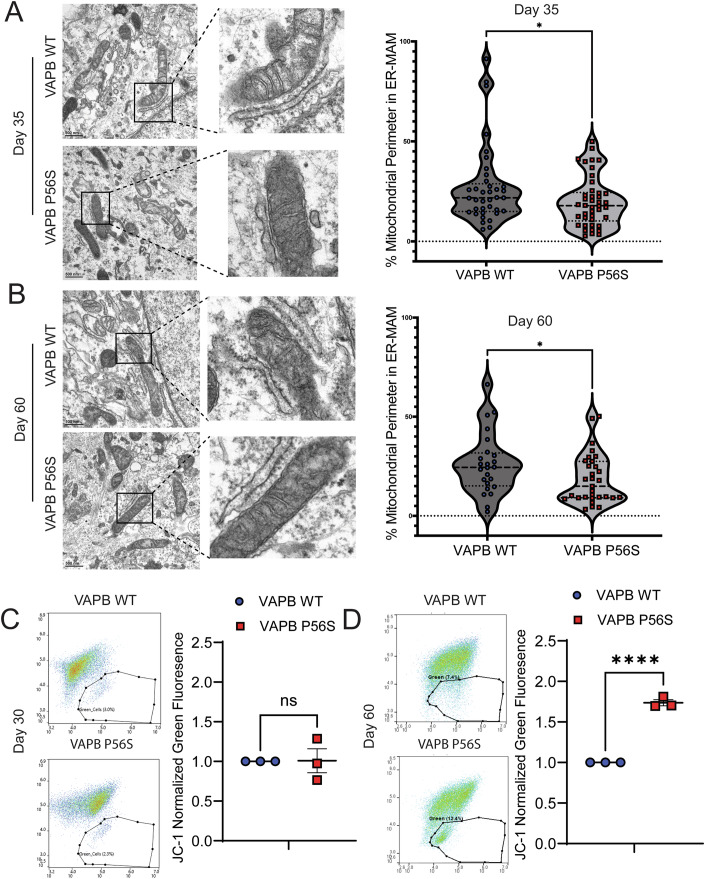
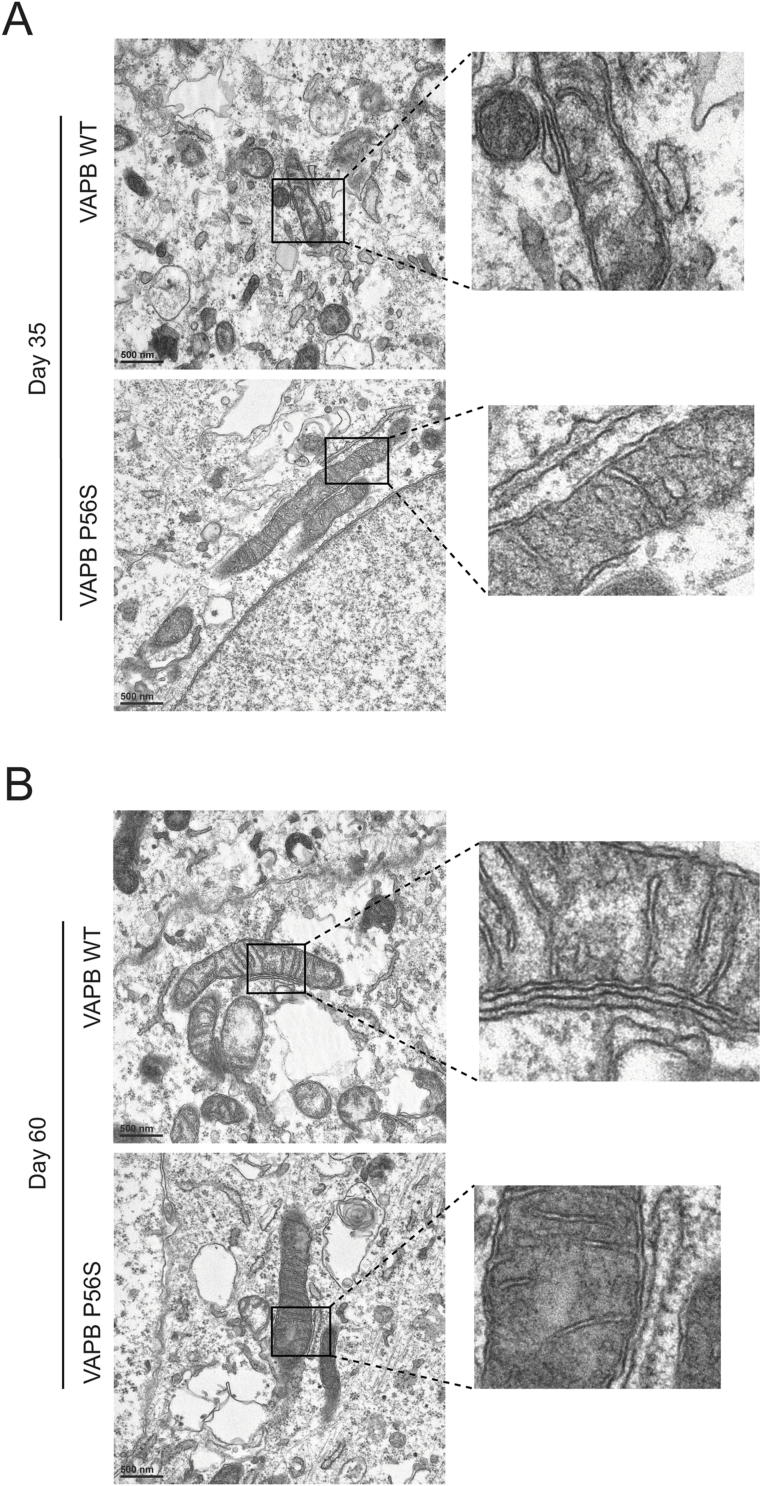
Vesicle-associated membrane protein-associated protein-B (VAPB) is an endoplasmic reticulum (ER) membrane-bound protein. The P56S mutation in VAPB causes a dominant, familial form of amyotrophic lateral sclerosis (ALS). However, the mechanism by which this mutation leads to motor neuron (MN) degeneration remains unclear. Utilizing inducible pluripotent stem cell (iPSC)-derived MNs expressing either wild-type (WT) or P56S VAPB, we demonstrate that the mutant protein reduces neuronal firing and disrupts ER-mitochondria-associated membranes (ER MAMs), with a time-dependent decline in mitochondrial membrane potential (MMP), hallmarks of MN pathology. These findings were validated in patient-derived iPSC-MNs. Additionally, VAPB P56S MNs show increased susceptibility to ER stress, elevated expression of the Integrated Stress Response (ISR) regulator ATF4 under stress, and reduced global protein synthesis. Notably, pharmacological ISR inhibition using ISRIB rescued ALS-associated phenotypes in both VAPB P56S and patient-derived iPSC-MNs. We present the first evidence that the VAPB P56S mutation activates ISR signaling via mitochondrial dysfunction in human MNs. These findings support ISR modulation as a strategy for ALS intervention and highlight the need for patient stratification in clinical trials.

Keywords: ALS (Amyotrophic Lateral Sclerosis); ER-MAM (Endoplasmic Reticulum Mitochondria Associated Membrane); ISR (Integrated Stress Response); Neurodegeneration; VAPB ((Vesicle Associated Membrane Protein Associated Protein B).


Conflict of interest statement

Disclosure and competing interests statement. HCM and ARM serve on the Scientific Advisory Board of Axion BioSystems, whose technology was used in this study. The authors declare no competing interests.

Figures

Figure 1
Figure 1. VAPB P56S motor neurons exhibit decreased neuronal firing rate compared to WT controls.
(A) Schematic representation of the motor neuron differentiation timeline. Created in BioRender. (https://BioRender.com/6g7xwxj and https://BioRender.com/6drsh7). (B) Weighted mean firing rate throughout 11 weeks of motor neuron differentiation. Data were presented as mean ± SEM, N = 8 technical replicates from each of three biological replicates. Statistical analysis: mixed-effects model (REML), interaction effect p = 0.000006****. (C) Number of bursts recorded through day 80 of motor neuron differentiation. Data were presented as mean ± SEM, N = 8 technical replicates. Statistical analysis: two-way ANOVA, interaction effect p = 0.0054**. (D) Raster plot depicting neuronal firing on day 61, recorded 100 s post-start. Bursts are outlined in magenta. Scatter plot quantifying the total number of bursts per well on day 61 of differentiation. Data were presented as mean ± SEM, N = 4 replicates. Source data are available online for this figure.
Figure 2
Figure 2. Interactome analysis of VAPB P56S compared to VAPB WT.
(A) Schematic illustrating the co-immunoprecipitation workflow used to isolate and identify VAPB interactors. (B) Ingenuity pathway analysis (IPA) depicting pathways enriched in proteins that exhibit increased binding to WT over P56S. The X-axis represents the IPA z-score, indicating predicted pathway activation/inhibition, while the Y-axis represents the –log(p value) for pathway enrichment significance. (C) A diagram showing connections between highly enriched pathways identified via IPA. (D) Cellular compartment analysis of proteins with a ≥1.5-fold increase in binding to VAPB WT compared to VAPB P56S, analyzed using DAVID. (E) Western blot of VAPB immunoprecipitation samples stained for PTPIP51 and β-actin. Quantification normalized to corresponding VAPB levels, mean ± SEM, N = 3 biological replicates. Statistical analysis: unpaired t-test, p = 0.0093**. Additional quantification of PTPIP51 levels in VAPB P56S samples normalized to VAPB WT levels, mean ± SEM, N = 3 biological replicates. Statistical analysis: unpaired t-test, p = 0.0439*. Source data are available online for this figure.
Figure 3
Figure 3. VAPB P56S reduces ER-mitochondrial contact and decreases mitochondrial membrane potential.
(A) Electron microscopy (EM) images of day 35 VAPB WT and VAPB P56S motor neurons, with inserts highlighting mitochondria-ER contacts. Violin plot represents median, first, and third quartiles (dashed lines), N = 37 mitochondria from 13 unique images for D35 WT, 42 mitochondria from 21 unique images for D35 P56S, unpaired t-test, p = 0.0475*. (B) EM images of day 60 VAPB WT and VAPB P56S motor neurons, with inserts highlighting mitochondria-ER contacts. Violin plot represents median, first, and third quartiles (dashed lines), N = 24 mitochondria from 13 unique images for D60 WT, 31 mitochondria for 18 unique images for D60 P56S, unpaired t-test, p = 0.0485*. (C) Scatter plot of day 30 motor neurons stained with JC-1 mitochondrial dye. X-axis: red fluorescence; Y-axis: green fluorescence; gate indicates the highly green-fluorescing population. Data presented as mean ± SEM, N = 3 biological replicates, paired t-test, p > 0.05. (D) Scatter plot of day 60 motor neurons stained with JC-1 mitochondrial dye. X-axis: red fluorescence; Y-axis: green fluorescence; gate indicates the highly green-fluorescing population. Data presented as mean ± SEM, N = 3 biological replicates, paired t-test, p = 0.0025**. Source data are available online for this figure.
Figure 4
Figure 4. The integrated stress response (ISR) is activated in VAPB P56S motor neurons.
(A) Western blot of ATF-4 basal levels and after 24 h tunicamycin exposure in day 35 motor neurons. Data presented as mean ± SEM, N= 3 biological replicates, unpaired t-test, p = 0.0045**. (B) Western blot of ATF-4 basal levels and after 24 h tunicamycin exposure in day 60 motor neurons. Data presented as mean ± SEM, N = 3 biological replicates, unpaired t-test, p = 0.0217*. (C) Western blot of DELE1 large and small fragments on day 35 of differentiation. Data presented as mean ± SEM, N = 3 biological replicates, unpaired t-test, p = 0.0023**. (D) Western blot of phosphorylated eIF2α (p-eIF2α) and total eIF2α on day 35 of differentiation. Data presented as mean ± SEM, N = 3 biological replicates, unpaired t-test, p = 0.0002***. (E) SUnSET assay on day 35 of differentiation. Data presented as mean ± SEM, N = 3 biological replicates, unpaired t-test, p = 0.0188*. Source data are available online for this figure.
Figure 5
Figure 5. ISR inhibition restores mRNA translation, mitochondrial membrane potential, and neuronal firing in doxycycline-inducible VAPB P56S iPSC-derived motor neurons.
(A) SUnSET assay on day 35 of differentiation with vehicle control and after 2h ISRIB treatment. Data presented as mean ± SEM, N = 3 biological replicates, unpaired t-test: WT vs. P56S, p = 0.0024**; P56S vs. P56S + ISRIB, p = 0.0125*. (B) Scatter plot of day 60 motor neurons stained with JC-1 mitochondrial dye following 24 h ISRIB treatment. Data presented as mean ± SEM, N = 3 biological replicates, paired t-test: WT vs. P56S, p = 0.0045**; P56S vs. P56S + ISRIB, p = 0.0482*; two-way ANOVA for genotype and ISRIB treatment, p = 0.0228*. (C) Weighted mean firing rate through day 59 of differentiation. Data presented as mean ± SEM, N = 4 technical replicates (wells per condition). Two-way repeated measures ANOVA from day 45 onward, interaction effect p = 0.0114*. Source data are available online for this figure.
Figure 6
Figure 6. ISR inhibition restores mRNA translation, mitochondrial membrane potential, and neuronal firing in ALS patient (Pt) iPSC-derived motor neurons.
(A) SUnSET assay on day 35 of differentiation with vehicle control and after 2 h ISRIB treatment. Data presented as mean ± SEM, N = 3 biological replicates, unpaired t-test: Pt WT vs. Pt P56S, p = 0.0296*; Pt P56S vs. Pt P56S + ISRIB, p = 0.0155*; Pt WT vs. Pt WT + ISRIB, p = 0.0201*. (B) Scatter plot of day 35 motor neurons stained with JC-1 mitochondrial dye following 24 h ISRIB treatment. Data presented as mean ± SEM, N = 3 biological replicates, paired t-test: Pt WT vs. Pt P56S, p = 0.0015**; Pt P56S vs. Pt P56S + ISRIB, p = 0.006**; Pt WT vs. Pt WT + ISRIB, p = 0.0122*. Two-way ANOVA for genotype and ISRIB treatment, p = 0.0034**. Source data are available online for this figure.
Figure 7
Figure 7. Proposed model of ALS pathogenesis.
Schematic representation of the proposed pathogenic mechanism. Created in BioRender. https://BioRender.com/rdfmnqy.
Figure EV1
Figure EV1. Characterization of doxycycline-inducible VAPB iPSCs.
(A) Next-generation sequencing of patient iPSCs following CRISPR-Cas9-mediated mutagenesis revealed two frameshift mutations: a 2 bp deletion in the WT VAPB allele and a 1 bp insertion in the P56S allele. (B) Sanger sequencing of VAPB WT and VAPB P56S lines after transduction with doxycycline-inducible constructs; the P56S mutation is highlighted in red. (C) Immunofluorescence analysis confirming robust expression of pluripotency markers Nanog, SOX2, and Oct4 in all inducible lines. N = 3 biological replicates, minimum of three technical replicates. (D) Quantitative PCR of HA-tagged VAPB transcripts in doxycycline-inducible iPSC lines. Expression was normalized to Neomycin and RPL3. Data were shown as mean ± SEM; N = 3 qPCR biological replicates per line, per time point.
Figure EV2
Figure EV2. Characterization of doxycycline-inducible VAPB iPSC-derived motor neurons.
(A) Western blot analysis of VAPB expression at days 15 (motor neuron progenitors, MNP) and 30 of differentiation. “Unaffected” and “Affected” refer to familial patient iPSC lines, with inducible lines generated from the Affected line. Data were presented as mean ± SEM; N = 3 biological replicates. (B) Immunofluorescence on day 15 showing expression of motor neuron progenitor markers Nestin and Olig2, with no detectable expression of the glial marker GFAP. N = 3 biological replicates, minimum of three technical replicates. (C) Immunofluorescence on day 30 comparing the number of DAPI/Islet 1/2 double-positive cells. Statistical analysis: unpaired t-test, no significant differences were observed (p > 0.05). Data were shown as mean ± SEM; N = 3 biological replicates, minimum of three technical replicates.
Figure EV3
Figure EV3. Burst frequency of VAPB P56S iPSC-derived motor neurons across differentiation.
(A) Data presented as mean ± SEM; N = 8 technical replicates.
Figure EV4
Figure EV4. Overexposed VAPB co-immunoprecipitation western blot.
(A) Overexposed western blot showing the PTPIP51 band in the input lane and absence of β-actin in the IP lane.
Figure EV5
Figure EV5. Expanded quantification of ER–mitochondria contacts (MAMs) from electron microscopy.
(A) Number of mitochondria counted for each line across all images taken at time point (day 35 or day 60) from 1 experiment. (B) Percent of mitochondria present in each image with no ER-Mitochondrial contact observable. Statistical analysis: unpaired t-test: VAPB WT Day 35 vs VAPB P56S Day 35 p = 0.0248*, VAPB WT Day 35 vs VAPB WT Day 60 p = 0.0078**, VAPB WT Day 35 vs VAPB P56S Day 60 p = 0.0293*, Violin plot with median, first and third quartiles denoted as dashed lines, N = 37 mitochondria from 13 unique images for D35 WT, 42 mitochondria from 21 unique images for D35 P56S, 24 mitochondria from 13 unique images for D60 WT, 31 mitochondria for 18 unique images for D60 P56S. (C) Area of mitochondria in pixels. Statistical analysis: unpaired t-test: all p values >0.05. Violin plot with median, first and third quartiles denoted as dashed lines, N = 50 mitochondria from 13 unique images for D35 WT, 91 mitochondria from 21 unique images for D35 P56S, 57 mitochondria from 13 unique images for D60 WT, 55 mitochondria from 18 unique images for D60 P56S.
Figure EV6
Figure EV6. Additional electron micrographs of ER–mitochondria contacts during motor neuron differentiation.
(A) Representative images from day 35 VAPB WT and VAPB P56S motor neurons, with insert zooms highlighting ER–mitochondria contacts. (B) Representative images from day 60 VAPB WT and VAPB P56S motor neurons, with insert zooms as above. Source data are available online for this figure.
Figure EV7
Figure EV7. VAPB P56S impairs cellular response to stress.
(A) JC-1 staining of day 35 motor neurons after 24 or 48 h of tunicamycin treatment, or untreated control. Data were presented as mean ± SEM; N = 3 biological replicates. Statistical analysis: paired t-test. Significant comparisons: VAPB WT Vehicle vs VAPB WT TM 48 h (p = 0.0141), VAPB WT TM 48 h vs VAPB P56S TM 48 h (p = 0.0450). (B) Same analysis as (A) on day 60. Statistical analysis: paired t-test. Significant comparisons: VAPB WT Vehicle vs VAPB P56S Vehicle (p = 0.043), VAPB WT Vehicle vs VAPB WT TM 24 h (p = 0.0374), VAPB P56S Vehicle vs VAPB P56S TM 24 h (p = 0.0229), VAPB WT TM 48 h vs VAPB P56S TM 48 h (p = 0.0212).
Figure EV8
Figure EV8. Characterization of VAPB patient iPSCs and isogenic control lines.
(A) Sanger sequencing of the patient iPSC line following CRISPR-Cas9-mediated mutagenesis. The heterozygous P56S mutation (TCC, encoding Ser) was corrected to the WT codon (CCC, encoding Pro). A synonymous mutation (SM) was also introduced at the adjacent PAM site (AGG to AGA, both encoding Arg) via the donor template to prevent re-cutting by Cas9. (B) Immunofluorescence confirming expression of pluripotency markers (SOX2, Nanog, and OCT4) in isogenic iPSC lines. N = 3 biological replicates, minimum of three technical replicates. (C) Immunofluorescence on day 15 showing expression of motor neuron progenitor markers Nestin and Olig2, with no GFAP expression. N = 3 biological replicates, minimum of three technical replicates. (D) Immunofluorescence on day 30 comparing the number of DAPI/Islet 1/2 double-positive cells. Statistical analysis: unpaired t-test, no significant difference observed (p > 0.05). Mean ± SEM; N = 3 biological replicates, three technical replicates of each biological replicate.

References

    1. Anagnostou G, Akbar MT, Paul P, Angelinetta C, Steiner TJ, de Belleroche J (2010) Vesicle associated membrane protein B (VAPB) is decreased in ALS spinal cord. Neurobiol Aging 31:969–985 - PubMed
    1. Baird TD, Wek RC (2012) Eukaryotic initiation factor 2 phosphorylation and translational control in metabolism. Adv Nutr 3:307–321 - PMC - PubMed
    1. Bauer BN, Rafie-Kolpin M, Lu L, Han A, Chen JJ (2001) Multiple autophosphorylation is essential for the formation of the active and stable homodimer of heme-regulated eIF2alpha kinase. Biochemistry 40:11543–11551 - PubMed
    1. B’chir W, Maurin A-C, Carraro V, Averous J, Jousse C, Muranishi Y, Parry L, Stepien G, Fafournoux P, Bruhat A (2013) The eIF2α/ATF4 pathway is essential for stress-induced autophagy gene expression. Nucleic Acids Res 41:7683–7699 - PMC - PubMed
    1. Borgese N, Iacomino N, Colombo SF, Navone F (2021a) The link between VAPB loss of function and amyotrophic lateral sclerosis. Cells 10:1865 - PMC - PubMed

MeSH terms

Substances