. 2025 Aug 5;12(1):1362.
doi: 10.1038/s41597-025-05131-4.

A global dataset of terrestrial biological nitrogen fixation

Affiliations

A global dataset of terrestrial biological nitrogen fixation

Carla R Reis Ely et al. Sci Data. .

Abstract

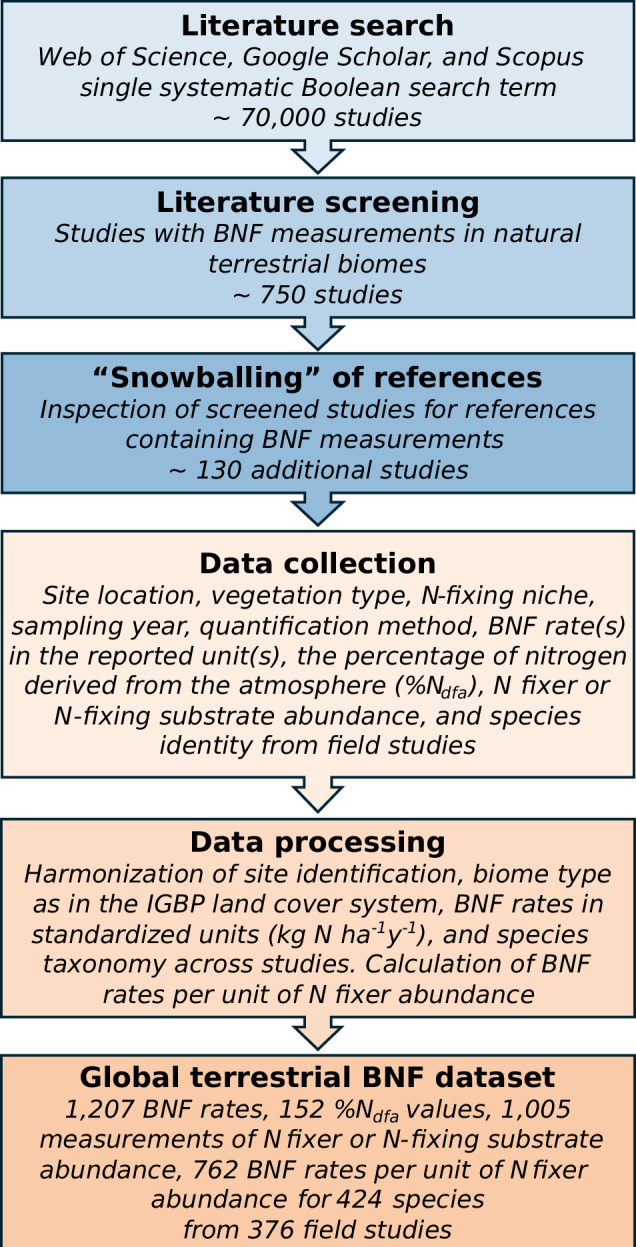
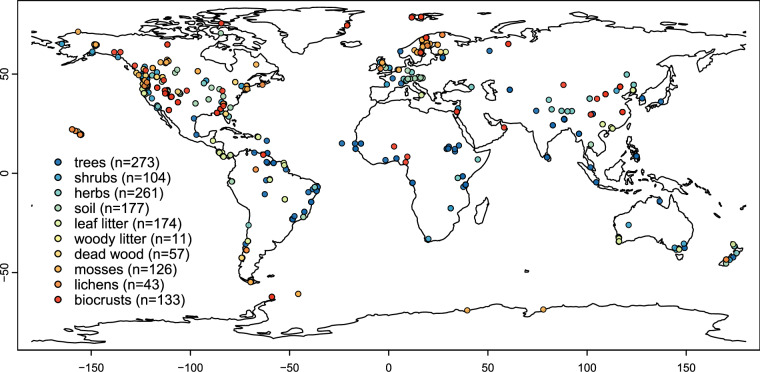
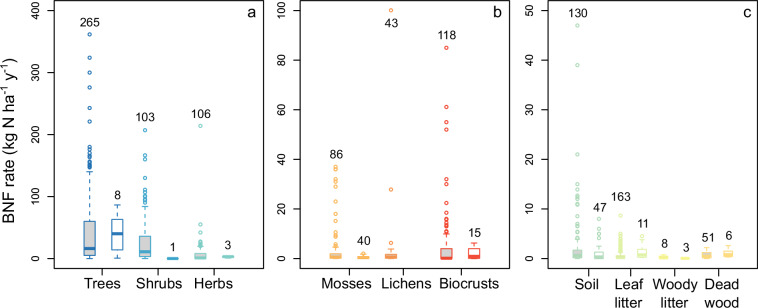
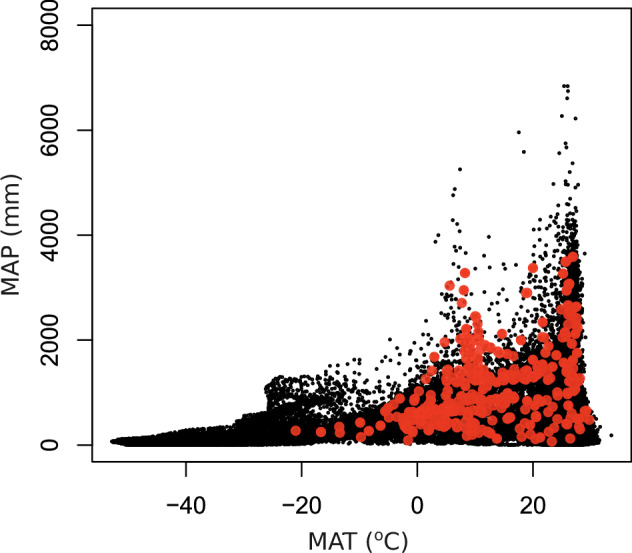
Biological nitrogen fixation (BNF) is the main natural source of new nitrogen inputs in terrestrial ecosystems, supporting terrestrial productivity, carbon uptake, and other Earth system processes. We assembled a comprehensive global dataset of field measurements of BNF in all major N-fixing niches across natural terrestrial biomes derived from the analysis of 376 BNF studies. The dataset comprises 32 variables, including site location, biome type, N-fixing niche, sampling year, quantification method, BNF rate (kg N ha-1 y-1), the percentage of nitrogen derived from the atmosphere (%Ndfa), N fixer or N-fixing substrate abundance, BNF rate per unit of N fixer abundance, and species identity. Overall, the dataset combines 1,207 BNF rates for trees, shrubs, herbs, soil, leaf litter, woody litter, dead wood, mosses, lichens, and biocrusts, 152 herb %Ndfa values, 1,005 measurements of N fixer or N-fixing substrate abundance, and 762 BNF rates per unit of N fixer abundance for a total of 424 species across 66 countries. This dataset facilitates synthesis, meta-analysis, upscaling, and model benchmarking of BNF fluxes at multiple spatial scales.


Conflict of interest statement

Competing interests: The authors declare no competing interests.

Figures

Fig. 1
Fig. 1
Workflow and systematic approaches for developing the global dataset of biological nitrogen fixation (BNF) in natural terrestrial biomes.
Fig. 2
Fig. 2
Location of field measurements of BNF in the global BNF dataset in natural terrestrial biomes. Each point represents one BNF rate (kg N ha−1 y−1) and/or percentage of nitrogen derived from the atmosphere (%Ndfa) value (n = 1,359) for root-nodulating N-fixing trees, shrubs, or herbs, free-living BNF in soil, leaf litter, woody litter, or dead wood, or BNF associated with mosses, lichens, or biocrusts. Not all points are visible due to overlap. Maps for each niche are in Supplementary Figures S2 to S4.
Fig. 3
Fig. 3
BNF rates originally reported in kg N ha−1 y−1 or similar units (grey filled boxplots) versus BNF rates converted to these units from cumulative or sub-annual BNF or ARA rates per unit of area or N fixer abundance, or %Ndfa values (white filled boxplots) for root-nodulating N-fixing trees, shrubs, and herbs (a), BNF associated with mosses, lichens, and biocrusts (b), and free-living BNF in soil, leaf litter, woody litter, and dead wood (c) in the global BNF dataset in natural terrestrial biomes. Boxplots depict the median and interquartile range, with whiskers representing values within 1.5 times the interquartile range. Values outside this range are shown as individual data points. The sample sizes are indicated above each boxplot.
Fig. 4
Fig. 4
Frequency distribution of BNF rates (kg N ha−1 y−1) for root-nodulating N-fixing trees, shrubs, and herbs, free-living BNF in soil, leaf litter, woody litter, and dead wood, and BNF associated with mosses, lichens, and biocrusts in the global BNF dataset in natural terrestrial biomes. The sample sizes are indicated in parentheses.
Fig. 5
Fig. 5
Climate space of study sites in the global BNF dataset. The background black points represent the density of mean annual temperature (MAT) and mean annual precipitation (MAP) grid cell values at 0.004-degree resolution across natural terrestrial biomes from TerraClimate (average of 2000–2020), including areas permanently covered by snow or ice. Study sites in the global dataset are depicted as red points.
Fig. 6
Fig. 6
Frequency distribution of sampling year of BNF rates (kg N ha−1 y−1) for root-nodulating N-fixing trees, shrubs, and herbs, free-living BNF in soil, leaf litter, woody litter, and dead wood, and BNF associated with mosses, lichens, and biocrusts in the global BNF dataset in natural terrestrial biomes. Totals by decade are indicated above each bar.

References

    1. LeBauer, D. S. & Treseder, K. K. Nitrogen limitation of net primary productivity in terrestrial ecosystems is globally distributed. Ecology89, 371–379, 10.1890/06-2057.1 (2008). - PubMed
    1. Du, E. et al. Global patterns of terrestrial nitrogen and phosphorus limitation. Nat Geosci13, 221–226, 10.1038/s41561-019-0530-4 (2020).
    1. Craine, J. M., Morrow, C. & Fierer, N. Microbial nitrogen limitation increases decomposition. Ecology88, 2105–2113, 10.1890/06-1847.1 (2007). - PubMed
    1. Cleveland, C. C. et al. Exploring the Role of Cryptic Nitrogen Fixers in Terrestrial Ecosystems: A Frontier in Nitrogen Cycling Research. Ecosystems25, 1653–1669, 10.1007/s10021-022-00804-2 (2022).
    1. Soper, F. M. et al. A roadmap for sampling and scaling biological nitrogen fixation in terrestrial ecosystems. Methods Ecol Evol12, 1122–1137, 10.1111/2041-210X.13586 (2021).

LinkOut - more resources