. 2025 Aug 5;10(1):184.
doi: 10.1038/s41541-025-01243-5.

Matrix-M adjuvant triggers inflammasome activation and enables antigen cross-presentation through induction of lysosomal membrane permeabilization

Affiliations

Matrix-M adjuvant triggers inflammasome activation and enables antigen cross-presentation through induction of lysosomal membrane permeabilization

Behdad Zarnegar et al. NPJ Vaccines. .

Abstract

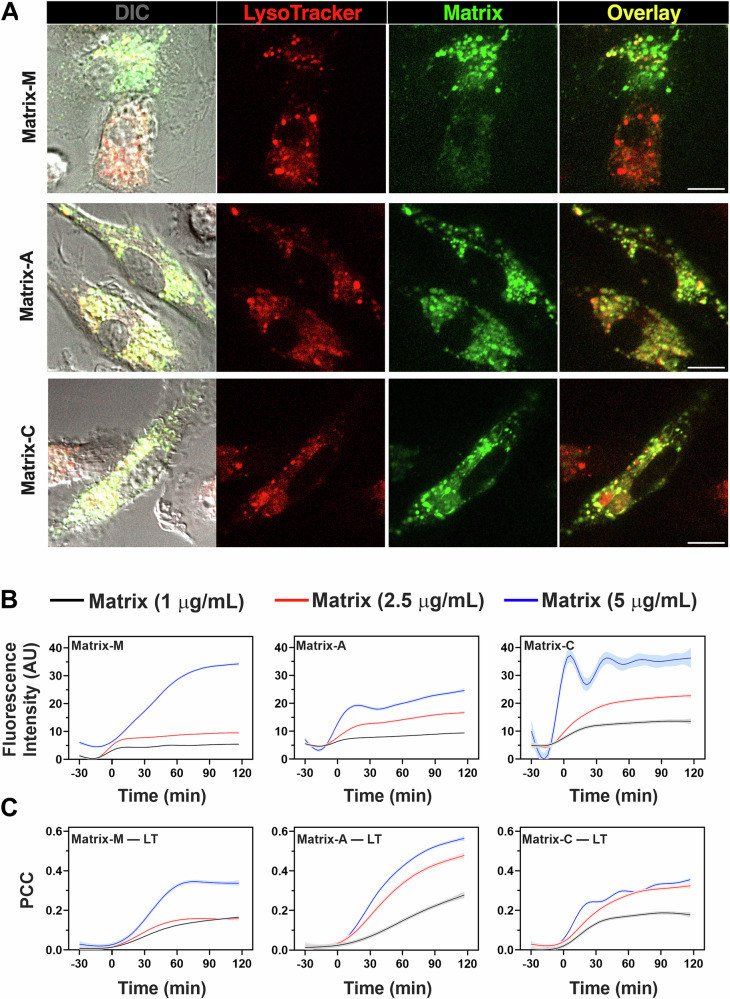
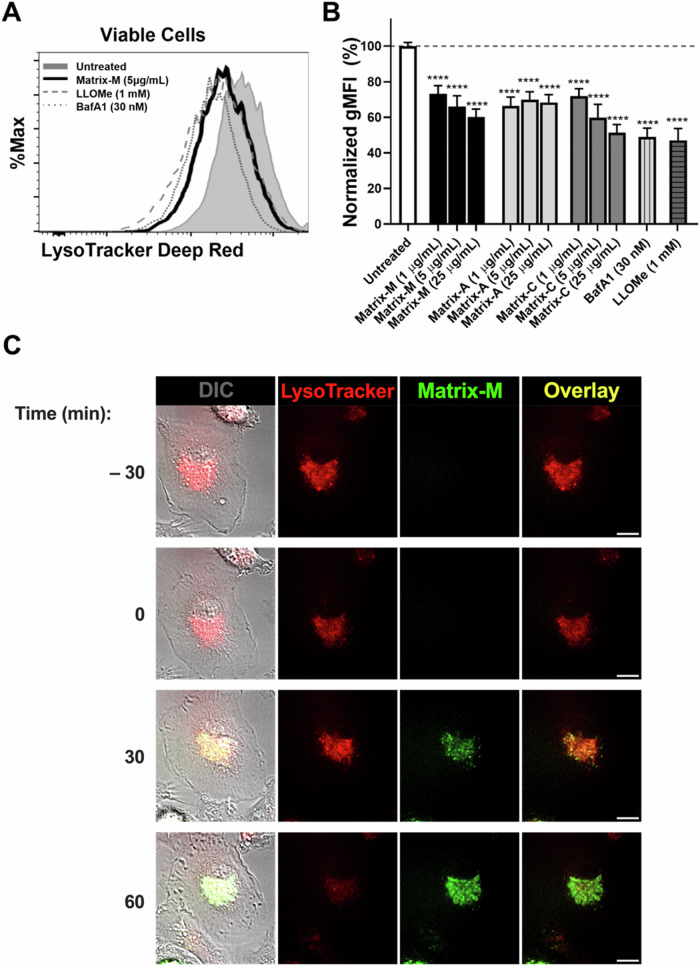
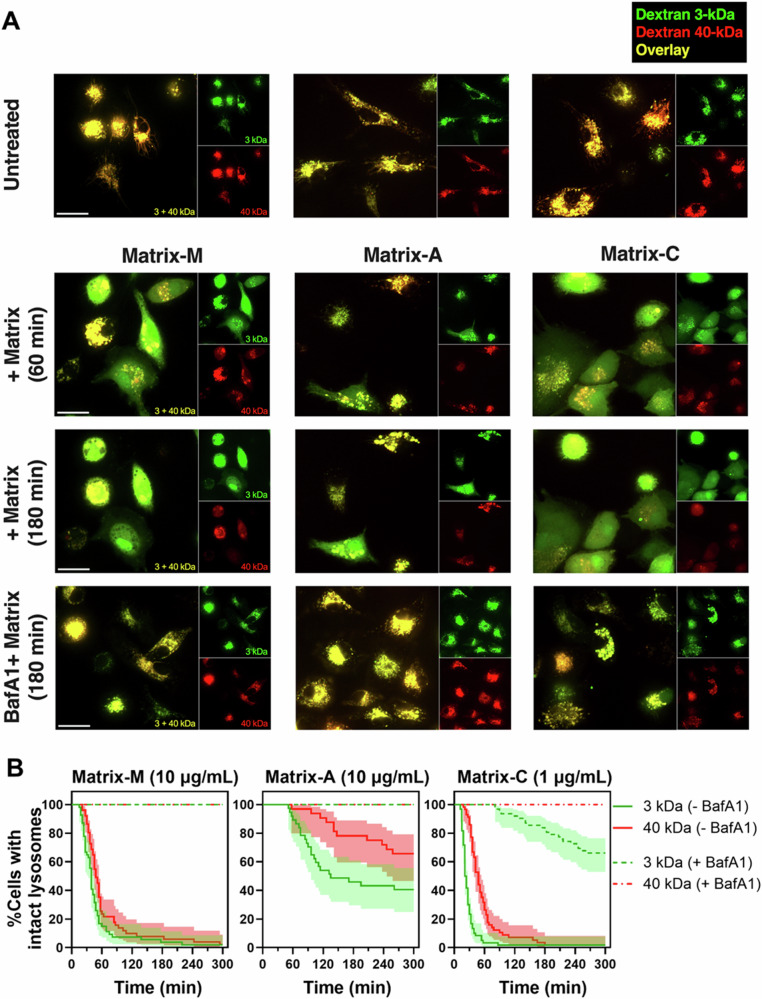
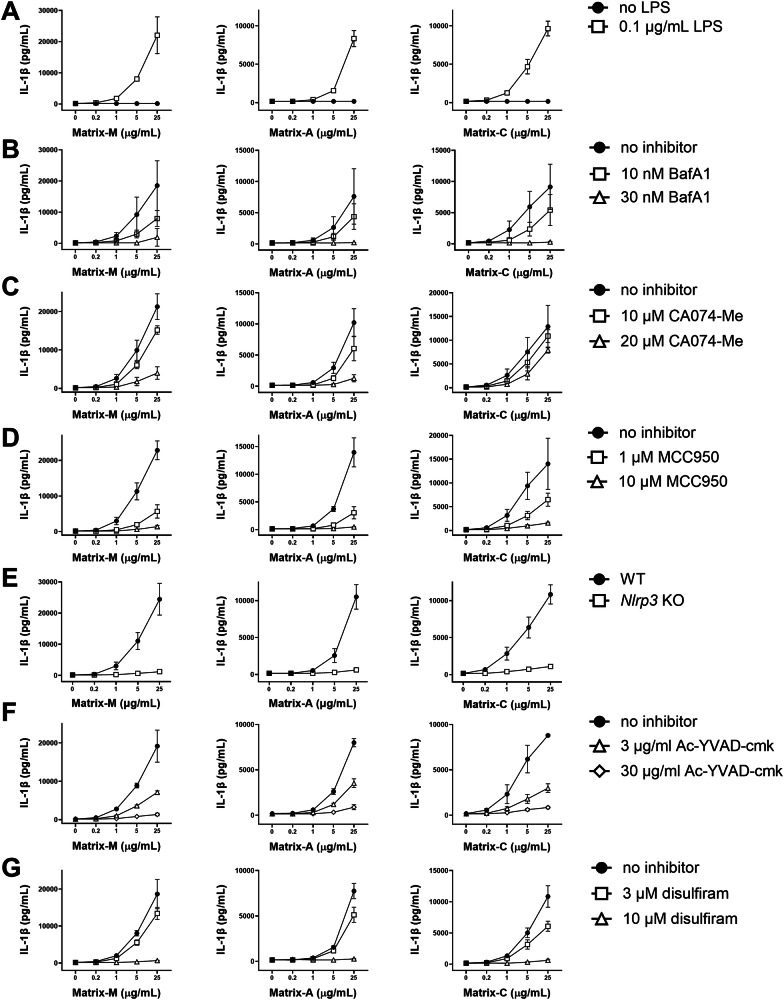
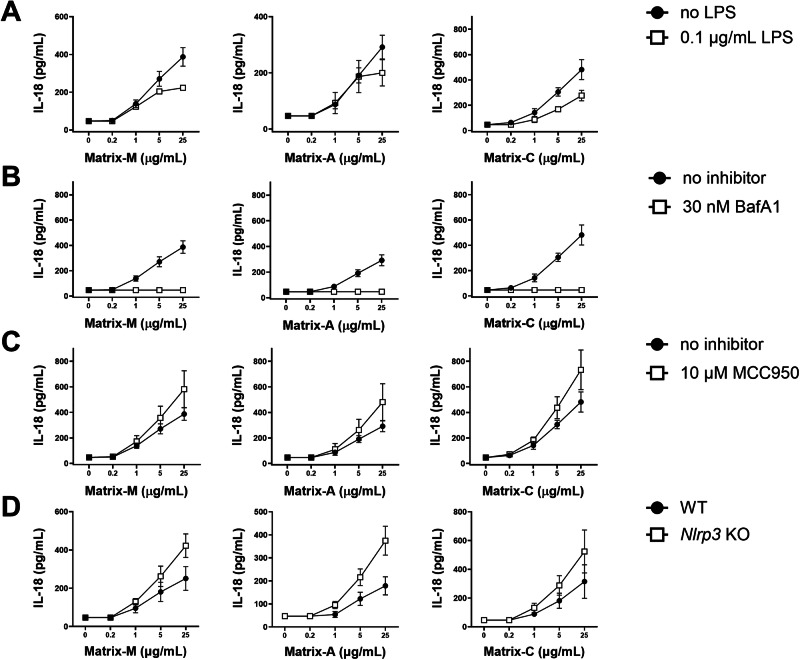
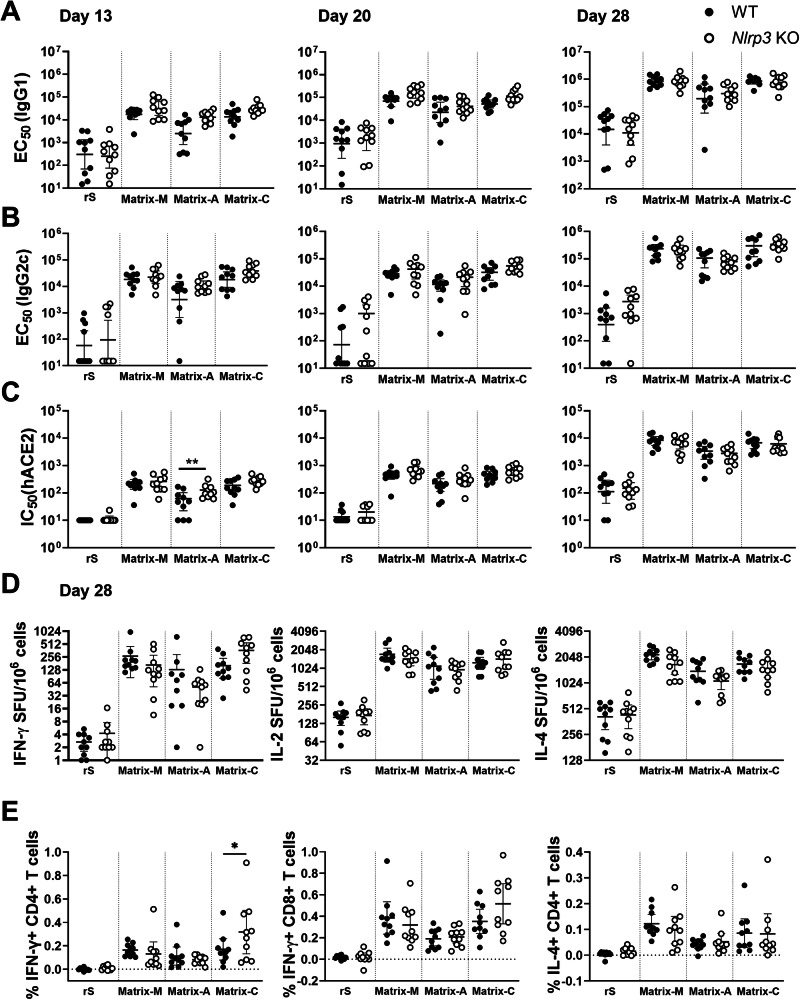
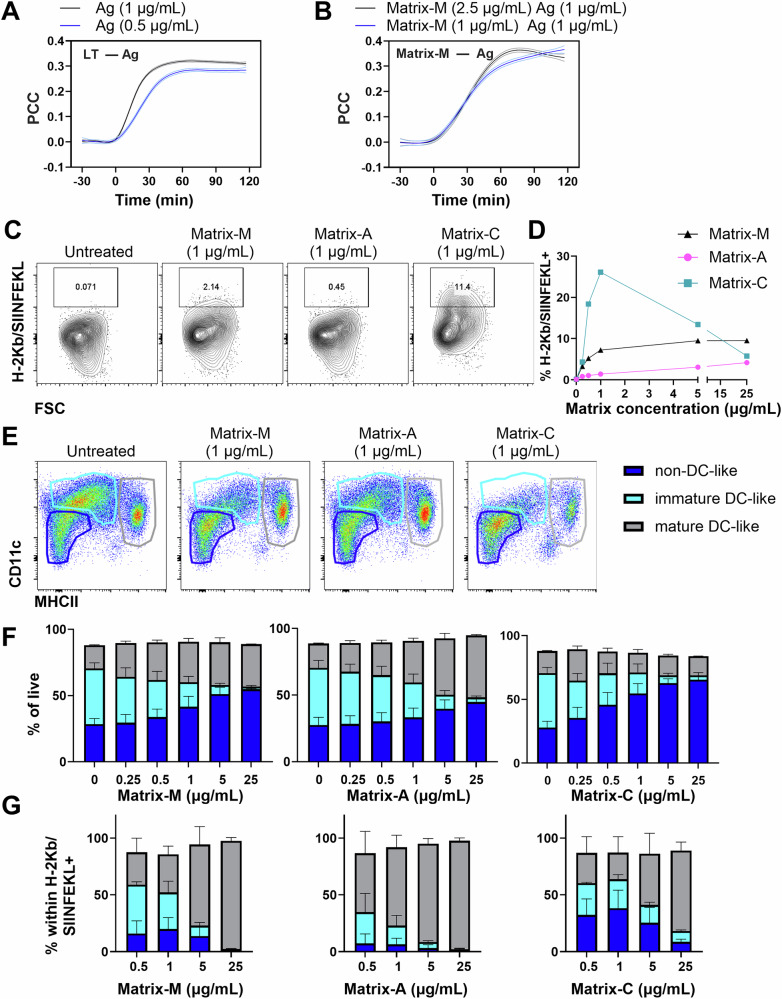
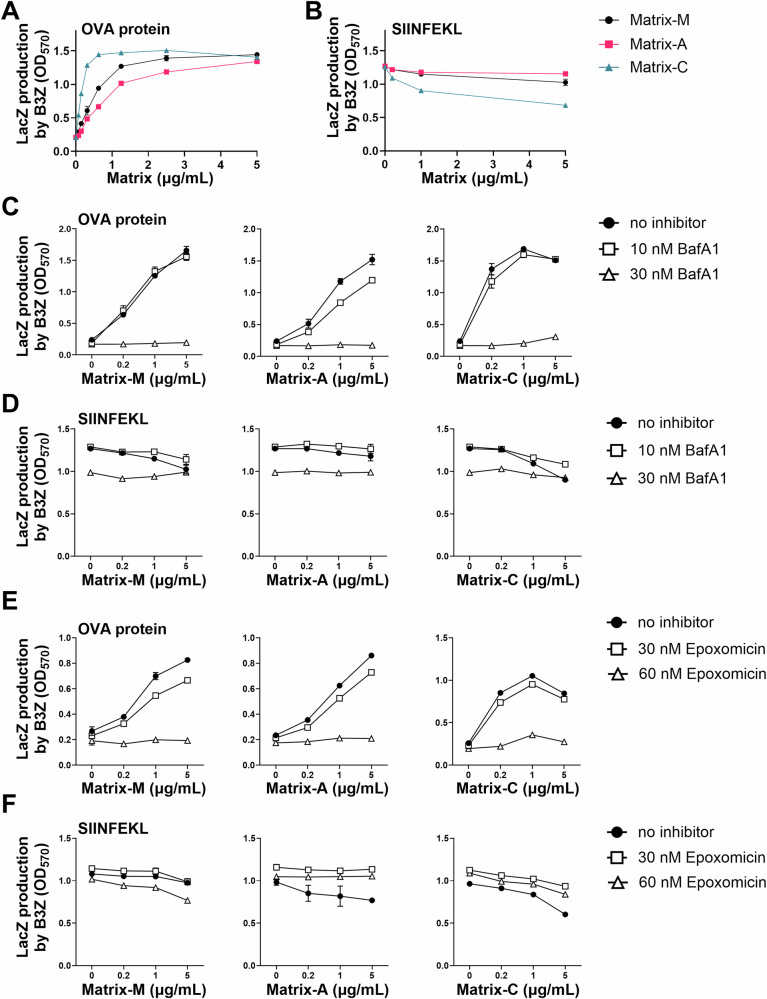
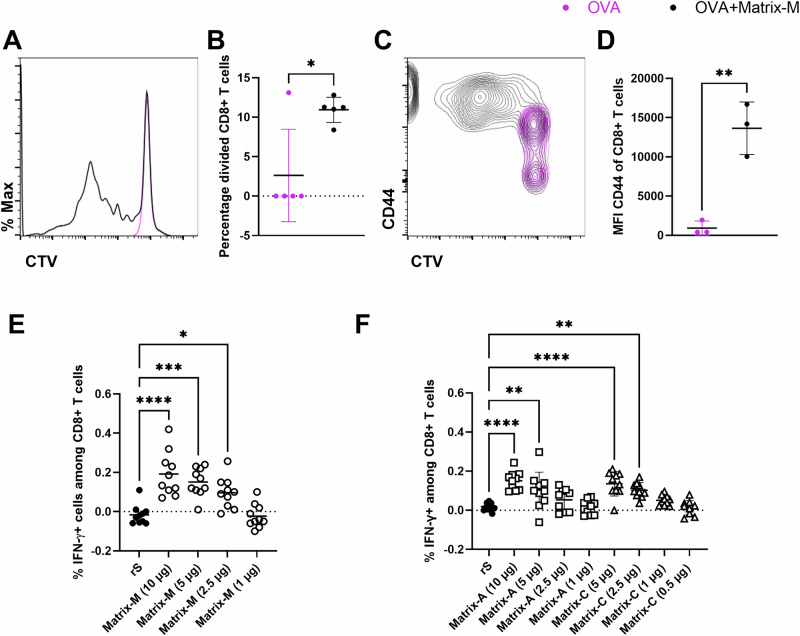
Matrix-M® adjuvant, containing saponins, delivers a potent adjuvant effect and good safety profile. Given that Matrix-M is composed of Matrix-A and Matrix-C particles, comprising different saponin fractions, understanding their distinct roles can provide deeper insight into the mechanism of action of Matrix-M and guide future applications. Here, we demonstrate that the antigen and Matrix-M, Matrix-A, or Matrix-C colocalize in lysosomes following uptake by bone marrow-derived dendritic cells. Matrix-M, Matrix-A, and Matrix-C induce lysosomal membrane permeabilization (LMP), but Matrix-C shows the highest LMP potential. LMP is required for interleukin (IL)-1β and IL-18 secretion in vitro. In vivo, a robust adjuvant effect of Matrix-M, Matrix-A, and Matrix-C is observed, both in the presence and absence of the NLRP3 inflammasome. LMP induced by Matrix-M, as well as Matrix-A and Matrix-C, also enables antigen cross-presentation. Thus, Matrix-induced LMP explains the capability of Matrix-M-adjuvanted protein vaccines to induce CD8+ T-cell responses.


Conflict of interest statement

Competing interests: B.Z., B.C., E.S., P.Ö., E.A., I.L.O., L.L., J.A., P.H., J.B., K.L.B., A.E.P., L.S. and C.L.A. are current or former employees of Novavax AB. E.B. and N.H. were contractors to Novavax AB at the time of manuscript preparation. B.Z., B.C., P.Ö., E.A., I.L.O., L.L., J.A., P.H., J.B., K.L.B., A.E.P. and L.S. are shareholders and/or optionees of Novavax, Inc. J.E. and M.E.S. have no competing interests to declare.

Figures

Fig. 1
Fig. 1. Matrix-M accumulates inside lysosomes.
BMDCs were loaded with LysoTracker Red DND-99, washed and imaged for 30 minutes. Following the initial pre-bleaching image acquisition, cells were treated with BODIPY-labeled Matrix-M, Matrix-A, or Matrix-C at concentrations of 1, 2.5, or 5 μg/mL, and live-cell spinning-disk confocal imaging continued for an additional 120 minutes. A Representative images showing individual channels (LysoTracker, BODIPY), overlays, and the DIC (differential interference contrast) channel captured after each treatment (scalebar = 10 μm). B The fluorescence intensity kinetics of BODIPY fluorescence for the indicated Matrix concentrations. C Pearson’s correlation coefficients (PCC) for BODIPY and LysoTracker fluorescence over time. Data shown in B and C represent smoothed averages from at least three biological replicates ±SEM.
Fig. 2
Fig. 2. Matrix-M induces lysosomal membrane permeabilization (LMP).
BMDCs were treated with either Matrix-M, Matrix-A, or Matrix-C (for 1 h), bafilomycin (BafA1, for 1 h), or L-Leucyl-L-Leucine methyl ester (LLOMe, for 15 min) at the indicated concentrations followed by staining with LysoTracker Deep Red and FVS520 for 15 and 7 min, respectively. Stained cells were analyzed by flow cytometry. A Flow cytometry histograms showing LysoTracker fluorescence intensity in viable BMDCs from representative samples (gating shown in Supplementary Fig. 2). B Normalized geometric mean fluorescence intensity (gMFI) of LysoTracker Deep Red in BMDCs. Data were normalized to untreated control samples and are shown as the mean ± SD; pooled from three independent experiments. Statistical differences between untreated control and treated samples were determined by one-way ANOVA followed by Dunnett’s multiple comparisons test (****p < 0.0001). C Images of LysoTracker-stained BMDCs before and after treatment with BODIPY-labeled Matrix-M, as described in Fig. 1. Scalebar = 10 μm.
Fig. 3
Fig. 3. Matrix-induced LMP results in the release of lysosomal contents into the cytosol.
BMDCs were preloaded overnight with dextran particles of different sizes and fluorochromes (Alexa Fluor™ 488–conjugated 3-kDa dextran and tetramethylrhodamine-conjugated 40-kDa dextran). The following day, cells were pretreated with bafilomycin A1 (BafA1, 30 nM) or left untreated for 1 hour. Live-cell spinning-disk confocal imaging was performed at 3-min intervals for up to 5 h, before and after adding Matrix-M, Matrix-A (both at 10 μg/mL), or Matrix-C (1 μg/mL), to monitor lysosomal release of dextran particles into the cytosol. A Representative images showing individual channels (3- and 40-kDa dextrans) and overlays at the indicated time points and treatment conditions (scalebar = 20 μm). B The percentage of cells with intact lysosomes over time for each treatment condition. Data are pooled from three independent experiments and presented as percent cells with intact lysosomes ±95% confidence interval.
Fig. 4
Fig. 4. Matrix-M induces NLRP3 inflammasome activation and IL-1β release in vitro.
BMDCs were either non-primed (A) or LPS-primed (AG) and treated with increasing doses of Matrix-M, Matrix-A, or Matrix-C for 5 hours. Released IL-1β levels were measured in the supernatants by ELISA. Before treatment with Matrix adjuvants, cells were pretreated for 1 h with no inhibitor (AG), V-ATPase inhibitor bafilomycin A1 (BafA1) (B), cathepsin B inhibitor CA074-Me (C), NLRP3-related inhibitors MCC950 (D) and Ac-YVAD-cmk (F), or gasdermin D pore formation inhibitor disulfiram (G) at the indicated concentrations. Additionally, IL-1β levels were measured in NLRP3-deficient and wild-type (WT, C57BL/6) BMDCs after Matrix adjuvant treatment (E). Results are shown as the mean ± SD from at least three independent experiments.
Fig. 5
Fig. 5. Matrix-M–induced IL-18 release is NLRP3 inflammasome independent.
BMDCs were either non-primed (AD) or LPS-primed (A). BMDCs were treated with increasing doses of Matrix-M, Matrix-A, or Matrix-C for 24 hours. Released IL-18 levels were measured by ELISA. Before treatment with Matrix adjuvants, cells were pretreated for 1 h with V-ATPase inhibitor bafilomycin A1 (BafA1) (B) or NLRP3-assembly inhibitor MCC950 (C) at the indicated concentration. Similarly, IL-18 levels were measured in NLRP3-deficient and wild-type (WT, C57BL/6) BMDCs after Matrix adjuvant treatment (D). Results are shown as mean ± SD of three independent experiments.
Fig. 6
Fig. 6. NLRP3 inflammasome activation is not required for Matrix-M adjuvanticity in vivo.
C57BL/6 (WT) and Nlrp3 KO mice (n = 10/group) were immunized with 0.1 µg SARS-CoV-2 rS (rS) alone or adjuvanted with 5 μg Matrix-M, Matrix-A, or Matrix-C. Serum samples obtained 13, 20, and 28 days after the primary immunization were evaluated by ELISA for IgG1 (A) and IgG2c (B) antibody titers against rS protein and for hACE2 receptor-inhibiting antibody titers (C). At day 28, splenocytes from individual mice were isolated and the number of cells producing IFN-γ, IL-2, or IL-4 in response to rS protein restimulation was determined by FluoroSpot assay (D). Individual titers (ELISA) or spot forming units (SPU)/106 splenocytes are shown as individual symbols, with horizontal bars representing geometric mean values, and error bars represent their 95% confidence intervals. Additionally, splenocytes were analyzed by flow cytometry (intracellular staining) to access frequencies of rS-specific CD4+ and CD8+ T cells producing IFN-γ and IL-4 (E). Data for each individual mouse response are shown with symbols and group means are represented by horizontal bars. The data (AD) were log-transformed before being analyzed. The data (AE) were analyzed for differences between WT and and Nlrp3 KO mice within each adjuvanted group by one-way ANOVA with Šidák’s multiple comparisons test (*for p < 0.05, ** for p < 0.01).
Fig. 7
Fig. 7. Matrix-M enables antigen cross-presentation in BMDCs.
BMDCs were loaded with LysoTracker Red DND-99, washed and imaged using spinning-disk confocal microscopy for 30 minutes. Following the initial pre-bleaching image acquisition, cells were treated with Alexa Fluor 647–labeled rS (0.5 or 1 μg/mL) and BODIPY-Matrix-M (1 or 2.5 μg/mL) and live-cell imaging continued for an additional 120 min. Pearson’s correlation coefficients (PCC) for the channel combination LysoTracker and Alexa Fluor 647 (A), and BODIPY and Alexa Fluor 647 (B) were determined as indicators of lysosome–antigen or Matrix‒M–antigen colocalization, respectively. Data in panels A and B are presented as smoothed averages ± SEM, pooled from at least three experiments, each performed in triplicates. CG BMDCs were exposed to 0.8 mg/mL ovalbumin (OVA) and indicated concentrations of Matrix-M, Matrix-A, or Matrix-C for 24 hours. Cells were analyzed by flow cytometry for surface markers and for H-2kB bound to SIINFEKL complexes, with the latter indicative of antigen cross-presentation. The percentage of viable BMDCs positive for H-2kB/SIINFEKL complexes is shown as representative contour plots (C) and corresponding graphs (D) for untreated and Matrix-treated groups. E Representative flow cytometry plots and F graphs show the proportion of major subpopulations within BMDC culture, identified as non-DC-like cells (CD11c MHCII, dark blue), immature DC-like cells (CD11c+ MHCII−/lo, turquoise) and mature DC-like cells (CD11c+ MHCIIhi, gray). G The percentage of various BMDC subpopulations within cells positive for H-2Kb/SIINFEKL complexes are shown. Data in panels CE are representative of three independent experiments, while graphs in F and G show pooled data from three independent experiments, presented as the mean ± SD.
Fig. 8
Fig. 8. Lysosomal acidification and proteasomal degradation contribute to Matrix-induced antigen cross-presentation.
BMDCs were exposed to 80 µg/mL OVA and indicated concentrations of Matrix-M, Matrix-A, or Matrix-C for 5 hours (A, C, E). In control experiments, 5 ng/mL SIINFEKL instead of OVA was added (B, D, F). Cells were co-cultured for 18 h with B3Z cells, which produce β-galactosidase upon TCR recognition of SIINFEKL presented on H-2kB. BMDCs were pretreated for 1 h with bafilomycin A1 (BafA1) to inhibit lysosomal acidification (C, D) or with epoxomicin (E, F) to inhibit proteasomal activity. Results shown are representative of two independent experiments, with data presented as mean values of technical triplicates ± SD.
Fig. 9
Fig. 9. Matrix-M generates dose dependent CD8+ T-cell responses in vivo.
C57BL/6 mice were immunized with OVA alone or adjuvanted with 5 µg Matrix-M. Pools of DCs isolated from the dLNs 24 h post-immunization were co-cultured for 3 days with naïve, CellTrace Violet (CTV)-stained CD8+ OT-I T cells. Representative histograms for CTV dilution are shown (A); these were used to calculate the percentage of divided cells by FlowJo proliferation analysis (B). Surface expression (median fluorescence intensity; MFI) of the T-cell activation marker CD44 within CD8+ T cells was analyzed, as displayed in the representative contour plot and corresponding graph (C, D). Each symbol represents one individual pool, with the solid horizontal bars representing group means ± SD. Unpaired t-test was applied for comparisons between the two groups (B, D). E, F BALB/c mice (n = 10/group) were immunized with 0.1 µg SARS-CoV-2-rS alone or adjuvanted with the indicated doses of Matrix-M (E), Matrix-A, or Matrix-C (F). Splenocytes from individual mice were isolated to determine the frequency of CD8+ T cells that produce IFN-γ after rS protein stimulation. Each symbol represents an individual mouse; horizontal bars represent group means. One-way ANOVA with Tukey’s multiple comparisons test was applied to compare the groups to the antigen only (p-values * for p < 0.05, **p < 0.01, ***p < 0.001, ****p < 0.0001).

Similar articles

References

    1. Datoo, M. S. et al. Efficacy and immunogenicity of R21/Matrix-M vaccine against clinical malaria after 2 years’ follow-up in children in Burkina Faso: a phase 1/2b randomised controlled trial. Lancet Infect. Dis.22, 1728–1736 (2022). - PubMed
    1. Dunkle, L. M. et al. Efficacy and safety of NVX-CoV2373 in adults in the United States and Mexico. N. Engl. J. Med.386, 531–543 (2022). - PMC - PubMed
    1. Heath, P. T. et al. Safety and efficacy of NVX-CoV2373 Covid-19 vaccine. N. Engl. J. Med.385, 1172–1183 (2021). - PMC - PubMed
    1. Shinde, V. et al. Efficacy of NVX-CoV2373 Covid-19 vaccine against the B.1.351 variant. N. Engl. J. Med.384, 1899–1909 (2021). - PMC - PubMed
    1. Datoo, M. S. et al. Efficacy of a low-dose candidate malaria vaccine, R21 in adjuvant Matrix-M, with seasonal administration to children in Burkina Faso: a randomised controlled trial. Lancet397, 1809–1818 (2021). - PMC - PubMed

LinkOut - more resources