. 2025 Aug 5;11(1):153.
doi: 10.1038/s41522-025-00793-9.

Genomic insights and metabolic profiling of gut commensal Luoshenia tenuis at strain level

Affiliations

Genomic insights and metabolic profiling of gut commensal Luoshenia tenuis at strain level

Xin-Wei Sun et al. NPJ Biofilms Microbiomes. .

Abstract

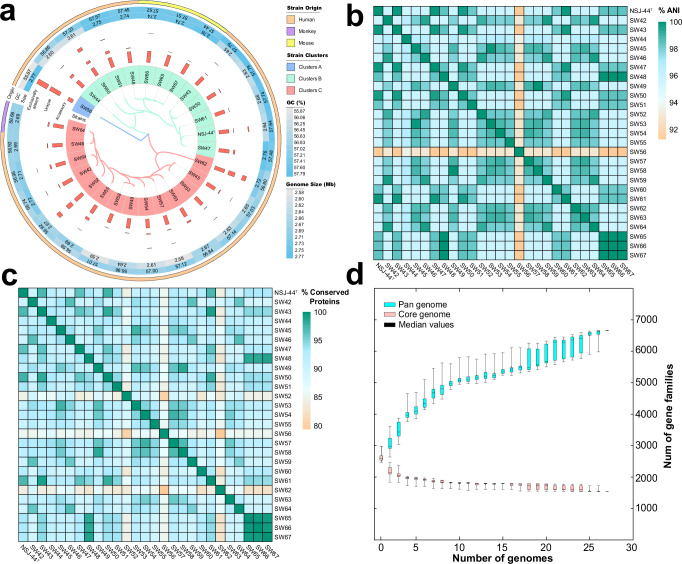
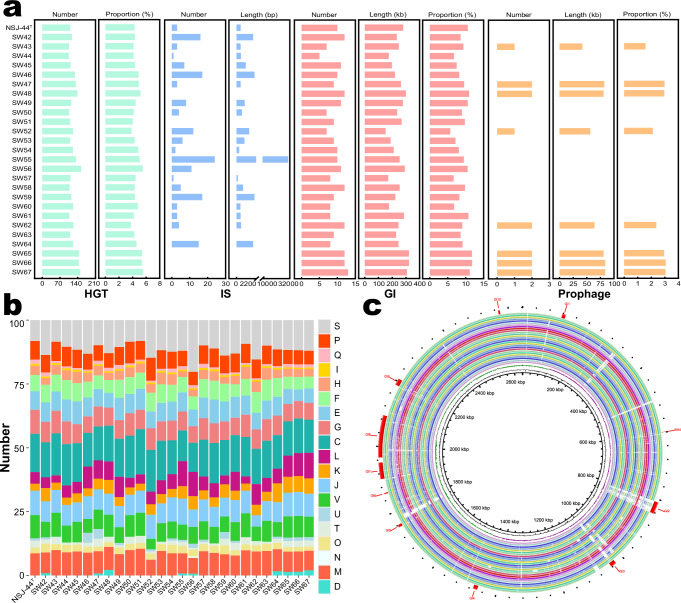
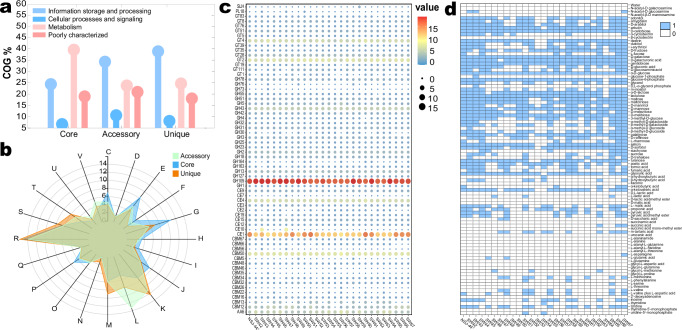
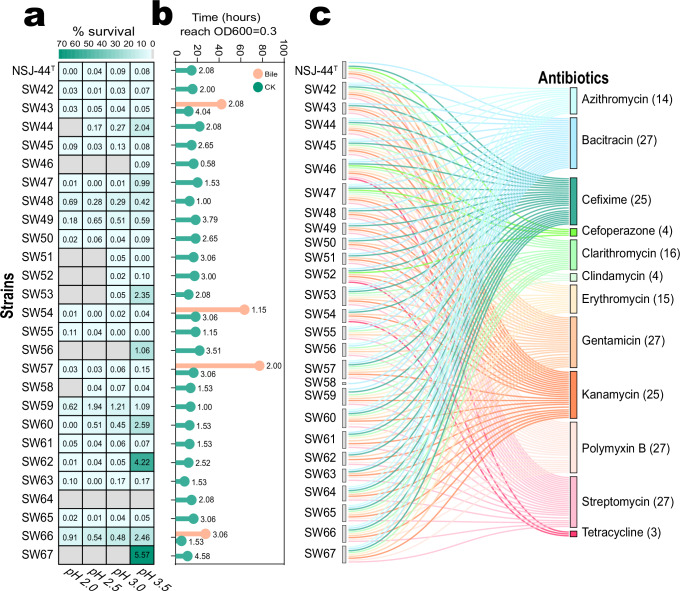
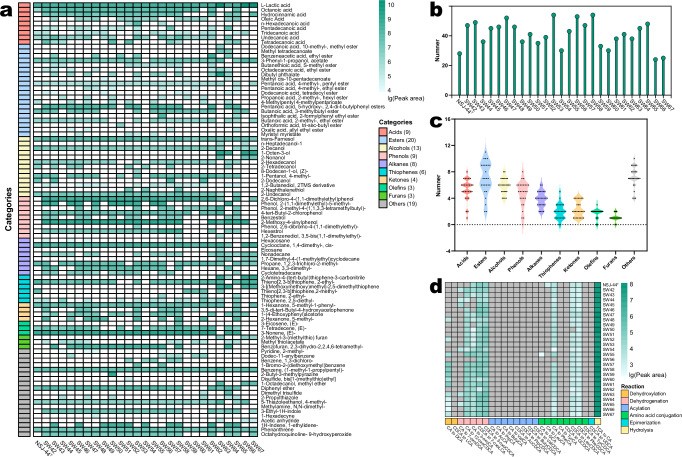
Luoshenia tenuis, a newly identified gut commensal microbe from the family Christensenellaceae, has shown therapeutic effects on weight control and metabolic disorders in model mice. Bacterial strains are essential for investigations on the host-microbe interaction and further development of medical applications. In this study, we collected 27 strains of L. tenuis from the Christensenellaceae Gut Microbial Biobank (ChrisGMB) and sequenced their complete genomes. Our analysis revealed considerable genetic diversity and genomic plasticity. Metabolic prediction indicated that L. tenuis had a preference for metabolizing plant-derived carbohydrates and the ability to synthesize various amino acids and cofactors. In silico analysis, along with in vitro experiments, validated that L. tenuis strains possessed strong acid tolerance and limited antibiotic resistance, suitable traits for oral probiotic development. Further volatile metabolomics and bile acid transformation profiling revealed that L. tenuis was capable of producing metabolites with previously-identified beneficial effects, along with extensive bile acid modification, potentially contributing to its positive impact on host metabolism. This study provides essential insight into strain-level functional and genomic features, laying a foundation for future research towards the development of L. tenuis-based therapies for metabolic disease.


Conflict of interest statement

Competing interests: The authors declare no competing interests. Consent for publication: All authors read and agree to the publication of this manuscript.

Figures

Fig. 1
Fig. 1. General genome features and Pangenomes analysis of L. tenuis.
a Phylogenomic tree constructed from whole-genome sequences and genomic overview of the L. tenuis strains. The first ring represents distinct clusters. The second to fourth rings represent accessory genes, unique genes, and exclusively absent genes, respectively. The fifth and sixth rings are heatmaps showing the distribution of genome sizes and GC contents. The seventh ring represents the origins of the strains. b Average Nucleotide Identity (ANI) values among L. tenuis strains. The heatmap color gradient from yellow to green represents the increasing % ANI values. c Percentage of Conserved Proteins (POCP) values among L. tenuis strains. d Curves for pan-genome (blue) and core-genome (red) sets of L. tenuis strains.
Fig. 2
Fig. 2. Horizontal gene transfer analysis of the L. tenuis genomes.
a Distribution of HGTs and mobile genetic elements (MGEs). b Distribution of COG functional categories among potential horizontal gene transfer (HGT) families. c Comparative genomic analysis of 27 L. tenuis genomes, with the reference genome of strain NSJ-44T.
Fig. 3
Fig. 3. In-silico prediction and experimental validation of carbon source utilization of L. tenuis.
a COG functional categories distribution in the pangenome of L. tenuis. b Comparison of COG functional categories in the pan-genome of L. tenuis. c CAZymes analysis in L. tenuis. The colour change from blue to red and the size of the circle correspond to the number of CAZymes, with red and larger circles indicating a greater number. d Carbon source utilization profile of 27 L. tenuis strains (Biolog), with blue indicating utilization and white indicating non-utilization. Data are presented from single independent experiments.
Fig. 4
Fig. 4. Genome annotation and test of tolerances to high acidity and bile salts and antibiotic resistance of L. tenuis.
a The percentage survival of L. tenuis strains after a 4-h treatment at different pH (2.0, 2.5, 3.0, 3.5). Values of the heatmap represent mean percentages relative to the pH 7.0 control (set as 100% survival). Values on the heatmap indicate standard deviations from three replicates. b Bile salts tolerance of L. tenuis strains. The time required to reach OD600 = 0.3 was determined (maximum 120 h). Strains cultured in bile-free broth served as the control. strains not displaying orange bars (indicating no detectable growth in bile salt-supplemented medium) were considered bile salt-sensitive. Values on the panel indicate standard deviations from three replicates. c Antibiotic resistance profiles of the 27 L. tenuis strains (disk diffusion, n = 3). Numbers in parentheses indicate resistant strains for each antibiotic. All strains remained susceptible to the other 8 tested antibiotics. Detailed antibiotic susceptibility data are provided in Supplementary Fig. S6.
Fig. 5
Fig. 5. Metabolic profiling of L. tenuis strains.
a Volatile metabolite heatmap. Color gradient indicates peak area intensities from GC-MS analysis: Dark green: High abundance; White: Not detected. Compounds are grouped by chemical class. Categories containing fewer than three compounds are classified as “Others.” Numbers in parentheses indicate the quantity of compounds within each category. b The total number of metabolites of different L. tenuis strains. c The number of different types of metabolites from different L. tenuis strains. d Quantitative detection of bile acid biotransformation. The substrate used in this study was cholic acid (CA), chenodeoxycholic acid (CDCA), and taurocholic acid (TCA).

Similar articles

References

    1. Fan, Y. & Pedersen, O. Gut microbiota in human metabolic health and disease. Nat. Rev. Microbiol.19, 55–71 (2021). - PubMed
    1. Clemente, J. oseC., Ursell, L. ukeK., Parfrey, L. auraW. & Knight, R. The impact of the gut microbiota on human health: an integrative view. Cell148, 1258–1270 (2012). - PMC - PubMed
    1. de Vos, W. M., Tilg, H., Van Hul, M. & Cani, P. D. Gut microbiome and health: mechanistic insights. Gut71, 1020–1032 (2022). - PMC - PubMed
    1. Chanda, D. & De, D. Meta-analysis reveals obesity associated gut microbial alteration patterns and reproducible contributors of functional shift. Gut Microbes16, 2304900 (2024). - PMC - PubMed
    1. Jie, Z. et al. The gut microbiome in atherosclerotic cardiovascular disease. Nat. Commun.8, 845 (2017). - PMC - PubMed

Substances

LinkOut - more resources