. 2025 Aug 5;23(1):242.
doi: 10.1186/s12915-025-02333-5.

Ephrin-B2 deletion in GABAergic neurons induces cognitive deficits associated with single-nucleus transcriptomic differences in the prefrontal cortex

Affiliations

Ephrin-B2 deletion in GABAergic neurons induces cognitive deficits associated with single-nucleus transcriptomic differences in the prefrontal cortex

Peijun Ju et al. BMC Biol. .

Abstract

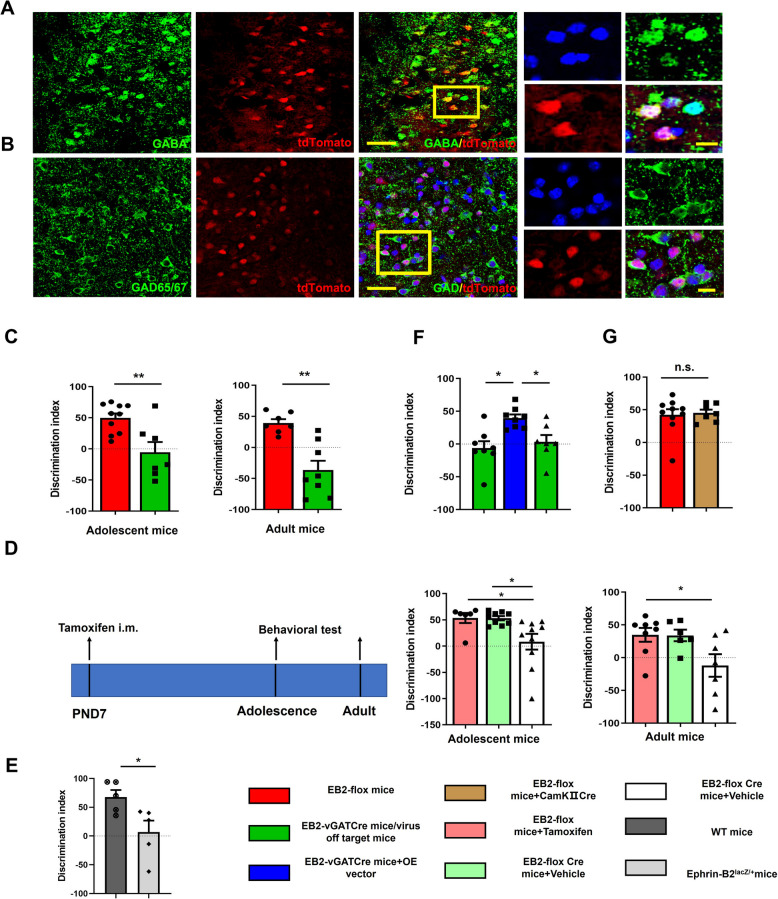
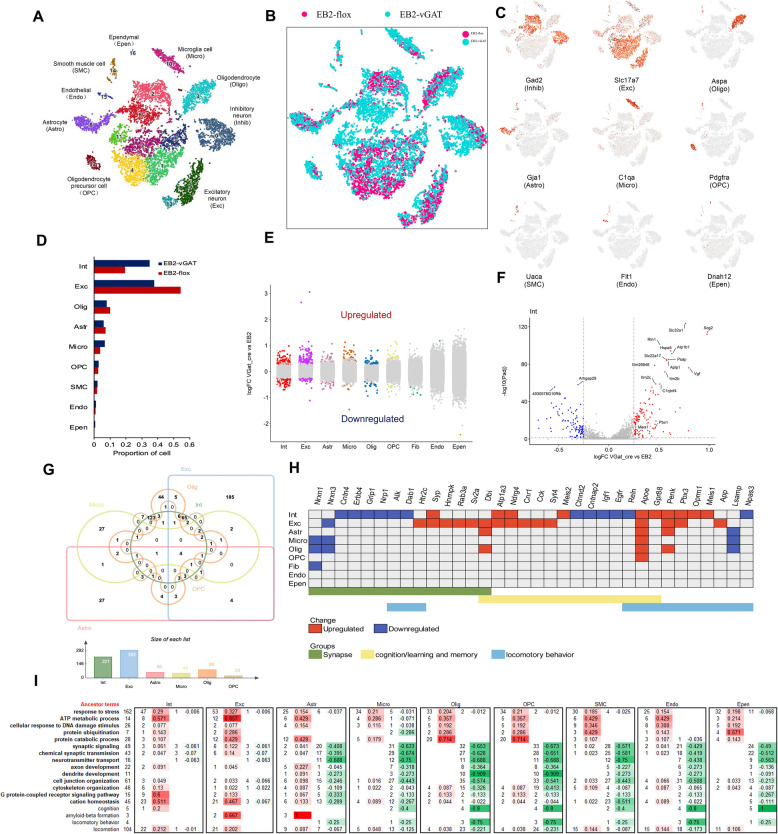
Background: Ephrin-B2 (EB2) signaling plays a crucial role in regulating memory and synaptic plasticity. Comprehensive identification of cell-type-specific transcriptomic changes in EB2 knockout mice is expected to shed light on potential mechanisms associated with EB2 signaling in cognitive functions.

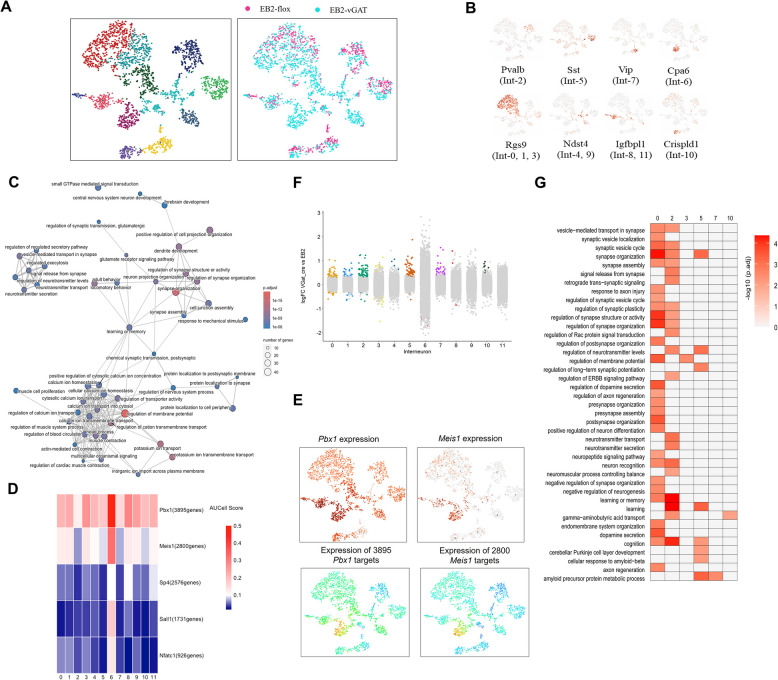
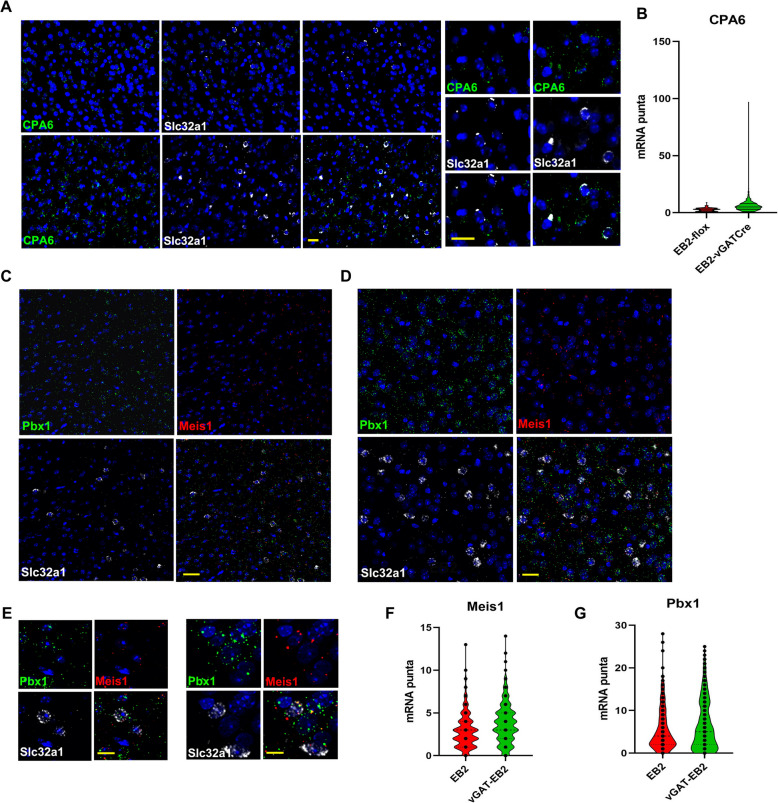
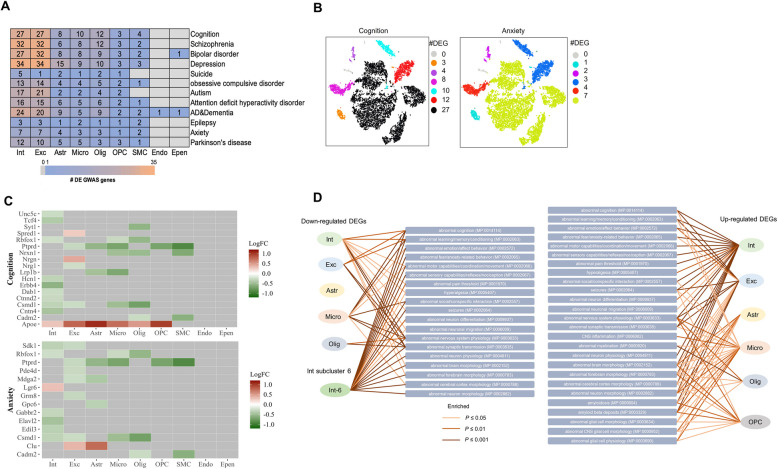
Results: Our study captures changes in cell populations in response to EB2 manipulation and reveals previously uncharacterized cell types (CPA6 + inhibitory neurons) in the mPFC. We validated the differential transcriptomic activity of Pbx1 and Meis1 in CPA6 + neurons using fluorescence in situ hybridization (ISH) in EB2-vGATCre mice. The aberrant presence of CPA6 + neurons in the mPFC may correlate with cognitive impairments induced by EB2 deletion in vGAT + neurons. Analyzing differentially expressed genes (DEGs) in individual cell clusters, we identified alterations related to synapse organization and development, cognition, amyloid-beta formation, and locomotor behavior. Additionally, our DEGs overlapped with human genome-wide association study (GWAS) candidate genes related to cognition and anxiety, underscoring the relevance of our mouse model to human disease.

Conclusions: We present a comprehensive atlas of cell-type-specific gene expression changes in this synaptic deficiency model and identify novel cell-type-specific targets implicated in cognitive deficits. Our investigation provides a detailed map of the cell types, genes, and pathways altered in this inhibitory synaptic deficiency model.

Keywords: Cognition; Ephrin-B2; GABAergic neurons; Single-nucleus RNA sequencing.


Conflict of interest statement

Declarations. Ethics approval and consent to participate: All experiments involving mice were carried out in accordance with National Institute of Health Guide for the Care and Use of Laboratory Animals and approved by Animal Care and Use Committee in Shanghai Jiao Tong University (IACUC No. A2019102). Consent for publication: Not applicable. Competing interests: The authors declare no competing interests.

Figures

Fig. 1
Fig. 1
Specific ablation of EB2 in vGAT + neurons induced cognitive deficits. A and B In vGATCre mice, the neurons labeled with Ai9 Rosa26 reporter tdTomato were expressing GABA and GAD65/67. DAPI indicated the nuclei location. Scale bar, 20 μm. C NORT discrimination index in EB2-vGATCre mice as compared with EB2-flox mice (left) adolescent, **P = 0.0097, Mann–Whitney U test. (right) Adult, **P = 0.0012, Mann–Whitney U test. D Left, schematic representation of the tamoxifen treatment protocol. Behavioral tests were carried out during postnatal week 4 and week 10. Bar plots showing the NORT discrimination index in Cre + T mice compared with W/OCre + T and Cre + V mice. Middle, P = 0.0051, Kruskal–Wallis ANOVA test, W/OCre + T vs. Cre + V, P > 0.9999, W/OCre + T vs. Cre + T, *P = 0.0153, Cre + V vs. Cre + T, *P = 0.0227. Right, P = 0.0298, ordinary one-way ANOVA test, W/OCre + T vs. Cre + V, P = 0.9987, W/OCre + T vs. Cre + T, *P = 0.0416, Cre + V vs. Cre + T, P = 0.0658. E NORT discrimination index in Ephrin-B2.lacZ/+mice as compared with WT mice (*P = 0.0317, Mann–Whitney U test). F Specific restoration of Ephrin-B2 by the precise bilateral injections of pAAV-EF1a-DIOEfnb22A-EGFP (OE virus) rescues NOR behavior deficit. P = 0.0038, ordinary one-way ANOVA test, EB2-vGATCre + Control vector vs. EB2-vGATCre + OE vector, **P = 0.0041, EB2-vGATCre + Control vector vs. Off target + OE vector, P = 0.7480, EB2-vGATCre + OE vector vs. Off target + OE vector, *P = 0.0274. G Mice injected with control vector and pAOV-CAMKIIα-GFP-2A-Cre showed no difference in NORT discrimination index (P = 0.9623, Mann–Whitney U test)
Fig. 2
Fig. 2
Impaired synaptic plasticity in mice with EB2 ablation in vGAT + neurons. A Schematic diagram showing the location of a MED64 probe placed on the coronal PFC slice (left) and the arrangement of the 8 × 8 recording array. Light microscopy photograph showing the location of the MED64 probe relative to the PFC cortex. The red dot indicates the stimulation site. B At various stimulation intensities (20, 40, 70 μA), the response intensity around the stimulation point (black) is shown (each square is 100 μm per side). The bar on the right indicates the color changes in response intensity. C Sample traces of evoked potentials in both groups of mice. D Significant decrease in fEPSP at positions 100 μm above, below, and to the left of the stimulation point (the top row). Upper 100 μm: two-way ANOVA, interaction, F(8,72) = 1.416, P = 0.2045, row factor, F(8,72) = 8.936, P < 0.0001, column factor, F(1,72) = 49.26, P < 0.0001, Sidak’s multiple comparisons test, 50 μA, 60 μA, 70 μA, **P < 0.01; left 100 μm: two-way ANOVA, interaction, F(8,72) = 1.584, P = 0.1447, row factor, F(8,72) = 12.26, P < 0.0001, column factor, F(1,72) = 78.53, P < 0.0001, Sidak’s multiple comparisons test, 40 μA, 50 μA, 60 μA, **P < 0.01, 70 μA, ***P < 0.001; lower 100 μm: two-way ANOVA, interaction, F(8,72) = 2.891, P = 0.0075, row factor, F(8,72) = 8.489, P < 0.0001, column factor, F(1,72) = 59.16, P < 0.0001, Sidak’s multiple comparisons test, 40 μA, *P < 0.05, 50 μA, ****P < 0.0001, 70 μA, ***P < 0.001. At positions 100 μm above, below, and to the left of the stimulation point, there is a significant decrease in the paired-pulse ratio of fEPSP (the bottom row). Upper 100 μm: two-way ANOVA, interaction, F(8,72) = 0.6037, P = 0.7689, row factor, F(8,72) = 0.7938, P = 0.6098, column factor, F(1,72) = 61.17, P < 0.0001, Sidak’s multiple comparisons test, 25 μA *P = 0.0388, 30 μA *P = 0.0243, 40 μA, *P = 0.0175, 60 μA, *P = 0.0421, 70 μA, *P = 0.0139; left 100 μm: two-way ANOVA, interaction, F(8,72) = 0.4780, P = 0.8678, row factor, F(8,72) = 0.3884, P = 0.9234, column factor, F(1,72) = 41.39, P < 0.0001, Sidak’s multiple comparisons test, 25 μA, *P = 0.0495, 40 μA, *P = 0.0211; lower 100 μm: two-way ANOVA, interaction, F(8,72) = 0.9763, P = 0.4618, row factor, F(8,72) = 1.159, P = 0.3359, column factor, F(1,72) = 14.1, P = 0.0004, Sidak’s multiple comparisons test
Fig. 3
Fig. 3
Functional connectivity changes between EB2-vGATCre and EB2-flox group of mice. A Upper panel: head fixation and skull thinning. Lower panel: 3D registration enabled linear probe positioning (gray bar) through the PFC. Right panel: anatomical delineations derived from the Allen Common Coordinate Framework overlaid on a representative fUS Doppler image show coverage of ROIs. B Heatmap of Pearson correlation coefficient between selected ROIs in both groups of mice. C Differences in functional connectivity z-values between EB2-vGATCre and EB2-flox group of mice for RNT-IA (Mann–Whitney U test, **P = 0.0020). N = 5 per group
Fig. 4
Fig. 4
Widespread transcriptional changes in PFC cell types between EB2-flox and EB2-vGATCre mouse. A t-SNE plot showing the broad clustering of PFC cells (5336 from EB2-flox mouse PFC and 5754 from EB2-vGAT mouse PFC). B t-SNE plot showing the broad clustering of PFC cell (5336 from EB2-flox mouse PFC and 5754 from EB2-vGAT mouse PFC). t-SNE plot showing the distribution of the merged PFC cells from EB2-flox mouse (red) and EB2-vGATCre mouse (green). C t-SNE plot showing the expression of well-established marker genes in each broad cell cluster. D Bar plot showing the proportion of PFC cell types in EB2-flox and EB2-vGAT mice. E Strip chart shows the logFC of all detected genes (dots) across all 9 cell types. Genes in colored dots are significantly (Padj < 0.05 and |logFC|> 0.25) upregulated or downregulated. Genes in gray are not significantly changed. F Representative volcano plots showing altered gene expression that are significantly upregulated (red dots) or downregulated (blue dots) in the interneuron. G Overlap of differentially expressed genes between neurons and glia. H Expression changes of selected genes involved in synapse, learning and memory, and locomotory behavior. I Enriched pathways related to metabolism, cellular stress, synapse, and channel activity per cell type. The ancestor terms selected from the Gene Ontology and numbers of their associated child terms are listed on the left. On the right, the red and green colors represent numbers and percentages of upregulated and downregulated enriched pathways
Fig. 5
Fig. 5
Inhibitory neuronal subclusters. A t-SNE plot showing that inhibitory neurons of PFC can be classified into 12 subtypes based on their transcriptome (left), and the distribution of the merged cells from EB2-flox (1038 cells, red) and EB2-vGAT (2010 cells, green) PFC cells (right). B t-SNE plots highlight marker genes for inhibitory neuronal subclusters. C Enrichment map network of GO pathways impacted in Int_6 based on marker genes. Each node represents a GO term and each edge represents the overlap between two GO terms. D Heatmap of the mean value of AUCell scores of expression regulation by transcription factors, as estimated using SCENIC, per inhibitory neuronal subcluster. E t-SNE plots of inhibitory neurons, color-coded for expression of Pbx1 and Meis1 (up), for AUC of the estimated regulon activity of Pbx1 and Meis1 (bottom), corresponding to the degree of expression regulation of their target genes. F Strip chart shows logFC of all detected genes (dots) across all 12 subclusters. Genes in colored dots are significantly (Padj < 0.05 and |logFC|> 0.25) upregulated or downregulated. Genes in gray are not significantly changed. G Heatmap showing the functional GO pathways impacted in many of subclusters based on gene expression changes between EB2-flox and EB2-vGAT mice
Fig. 6
Fig. 6
Validation of gene expression changes in PFC of EB2-vGATCre group of mice. A Multi-channel FISH detecting subtypes within a novel inhibitory neuronal subpopulation in PFC (CPA6 +, arrow, and CPA6 −, arrowhead within vGAT neurons: enlarged view of single cells in box area shown in side panel). B Violin plots with boxplots overlaid (right) showing the quantification of the RNAscope data (data presents differential expression of CPA6 in vGAT + neurons (n = 82 cells from 4 brains of EB2-flox mice, n = 442 cells from 4 brains of EB2-vGATCre mice, ****P < 0.0001, Mann–Whitney U test)). C and D Ablation of EB2 induced the upregulation of the Pbx1 and Meis1 genes in vGAT + neurons (Pbx1 + cells; indicated by arrows), scale bar, 50 μm and 10 μm. E Enlarged view of single cells in box area shown, scale bar, 10 μm. F Violin plots with boxplots overlaid (right) showing the quantification of the RNAscope data (data presents median expression of Pbx1 in vGAT + neurons (n = 493 cells from 4 brains of EB2-flox mice, n = 540 cells from 4 brains of EB2-vGATCre mice, *P = 0.0102, Mann–Whitney U test) and G Meis1 + vGAT + neurons (n = 493 cells from 4 brains of EB2-flox mice, n = 564 cells from 4 brains of EB2-vGATCre mice; ****P < 0.0001, Mann–Whitney U test))
Fig. 7
Fig. 7
EB2 deletion links to phenotypes of mice and neuropsychiatric diseases. A Heatmap showing the number of differentially expressed GWAS candidate genes relevant to 12 disorders/phenotypes in the PFC cell types between EB2-flox and EB2-vGAT mice. B t-SNE plot indicating the number of differentially expressed cognition and anxiety GWAS candidates per cluster (shown in distinct colors). C Heatmap showing the representative differential expressed GWAS candidates relative to cognition (up) and anxiety (down) in PFC cell types. Cognition and anxiety are shown as examples. D The phenotypes are found to be associated to markers of Int_6 and DEGs of neurons and glia. The left panel shows the downregulated DEGs, and the right panel shows the upregulated DEGs. The Fisher’s exact test and Benjamini–Hochberg FDR correction were used for P values

Similar articles

References

    1. Markram H, Toledo-Rodriguez M, Wang Y, Gupta A, Silberberg G, Wu C. Interneurons of the neocortical inhibitory system. Nat Rev Neurosci. 2004;5(10):793–807. - PubMed
    1. Favuzzi E, Rico B. Molecular diversity underlying cortical excitatory and inhibitory synapse development. Curr Opin Neurobiol. 2018;53:8–15. - PubMed
    1. Lisman J, Cooper K, Sehgal M, Silva AJ. Memory formation depends on both synapse-specific modifications of synaptic strength and cell-specific increases in excitability. Nat Neurosci. 2018;21(3):309–14. - PMC - PubMed
    1. Henderson NT, Dalva MB. EphBs and ephrin-Bs: trans-synaptic organizers of synapse development and function. Mol Cell Neurosci. 2018;91:108–21. - PMC - PubMed
    1. Holland SJ, Gale NW, Mbamalu G, Yancopoulos GD, Henkemeyer M, Pawson T. Bidirectional signalling through the EPH-family receptor Nuk and its transmembrane ligands. Nature. 1996;383(6602):722–5. - PubMed

LinkOut - more resources