. 2025 Aug 5;20(1):120.
doi: 10.1186/s13020-025-01179-x.

Explore the potential mechanism of Huachansu injection against osteosarcoma via metabolomics, network pharmacology and bioinformatics

Affiliations

Explore the potential mechanism of Huachansu injection against osteosarcoma via metabolomics, network pharmacology and bioinformatics

Jingjing Meng et al. Chin Med. .

Abstract

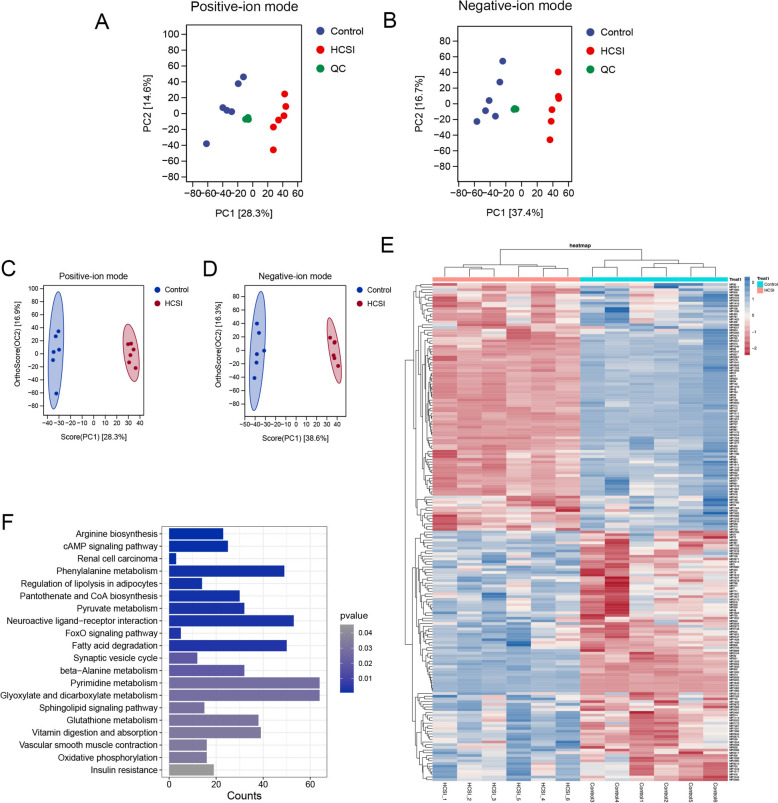
Aim: Huachansu injection (HCSI) shows effective medicinal functions against osteosarcoma. This study aimed to reveal the underlying mechanisms of HCSI against osteosarcoma by integrating metabolomics, network pharmacology and bioinformatics.

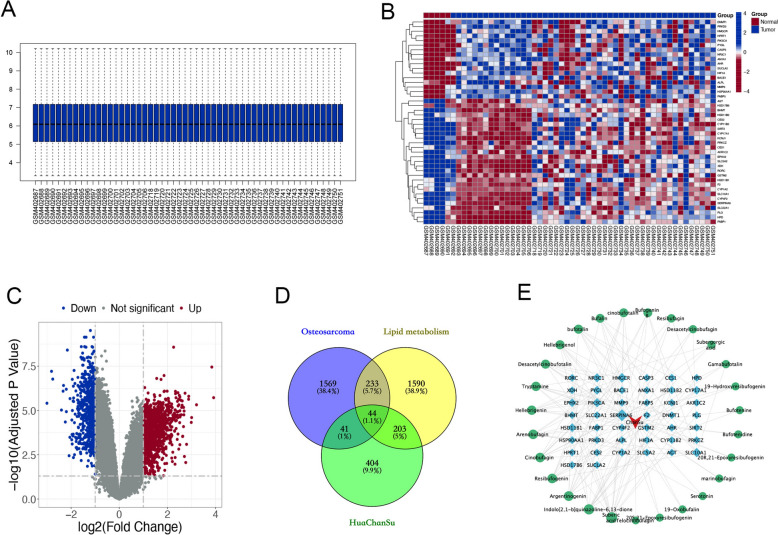
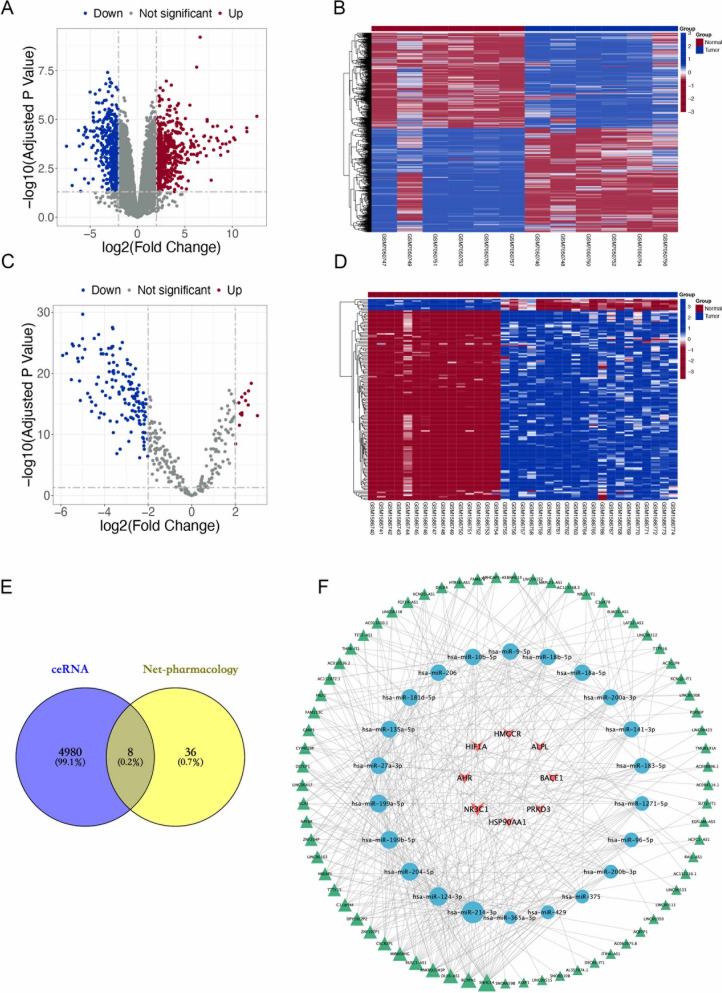
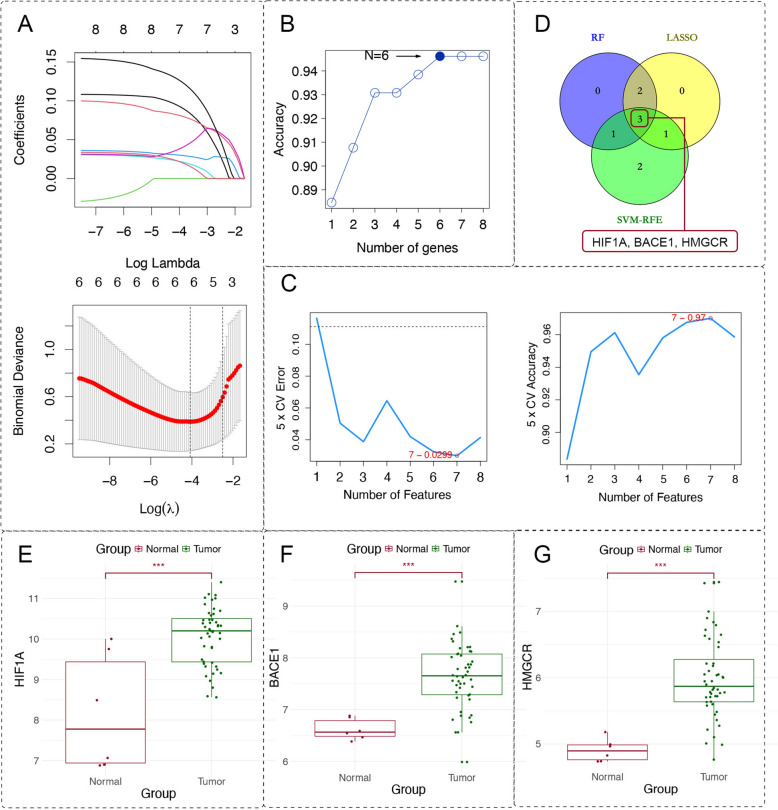
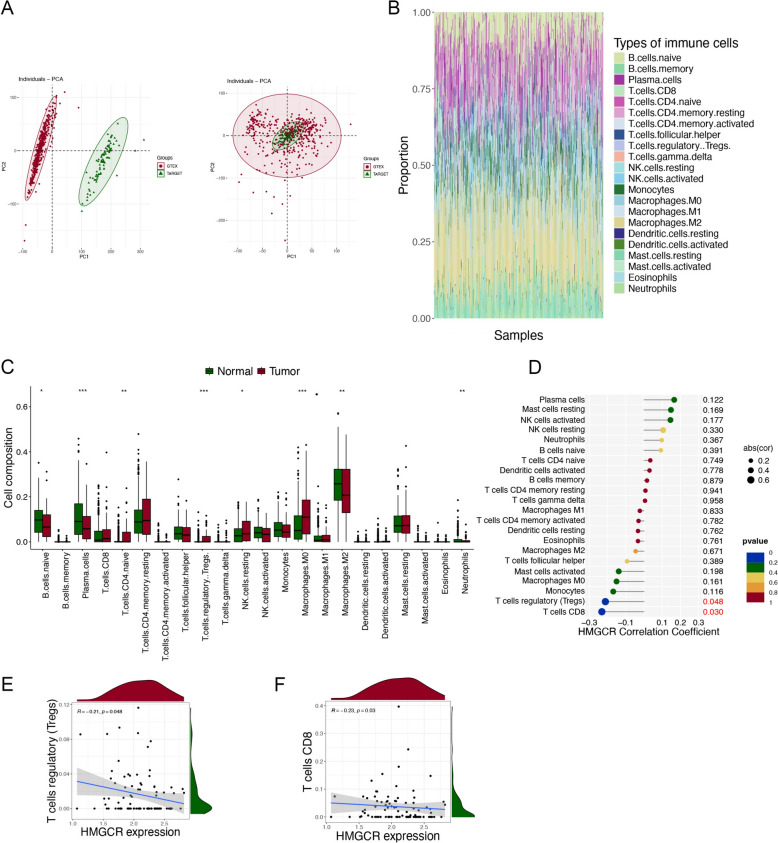
Methods: Metabolomics was used to identify different metabolites and pathways. Network pharmacology was utilized to predict the potential targets of HCSI against osteosarcoma. Differentially expressed lncRNAs and miRNAs were screened and the corresponding lncRNAs-miRNAs-mRNAs network were constructed through the GEO database and miRcode database. Machine learning and immune infiltration analysis were performed on the key target obtained from the intersection of network pharmacology and bioinformatics. The binding affinity between active compounds of HCSI and potential targets was evaluated by molecular docking. The underlying mechanisms were further validated by RT-qPCR and immunoblotting.

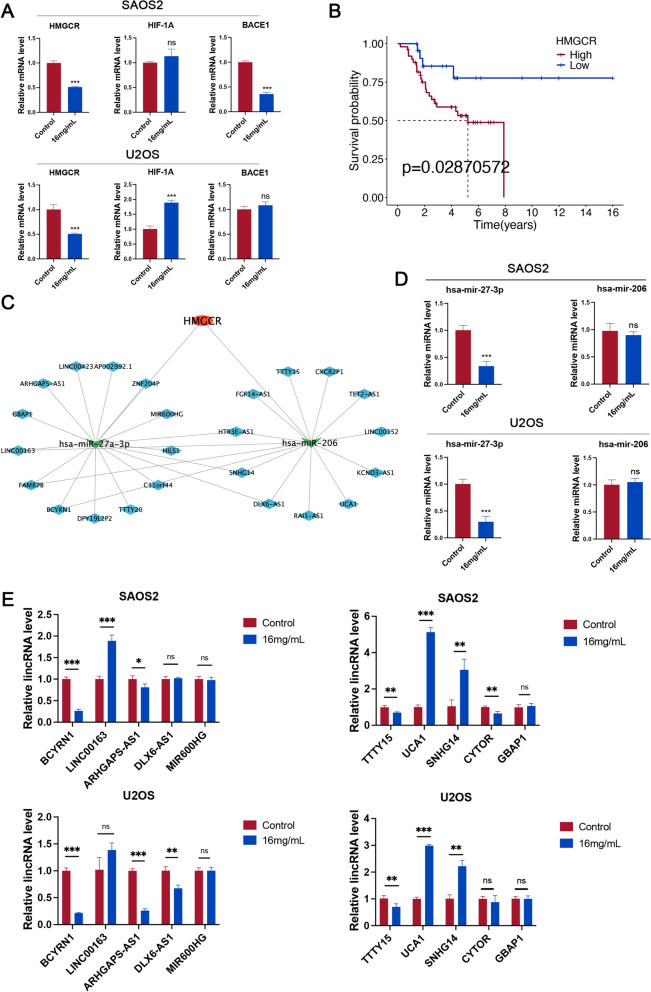
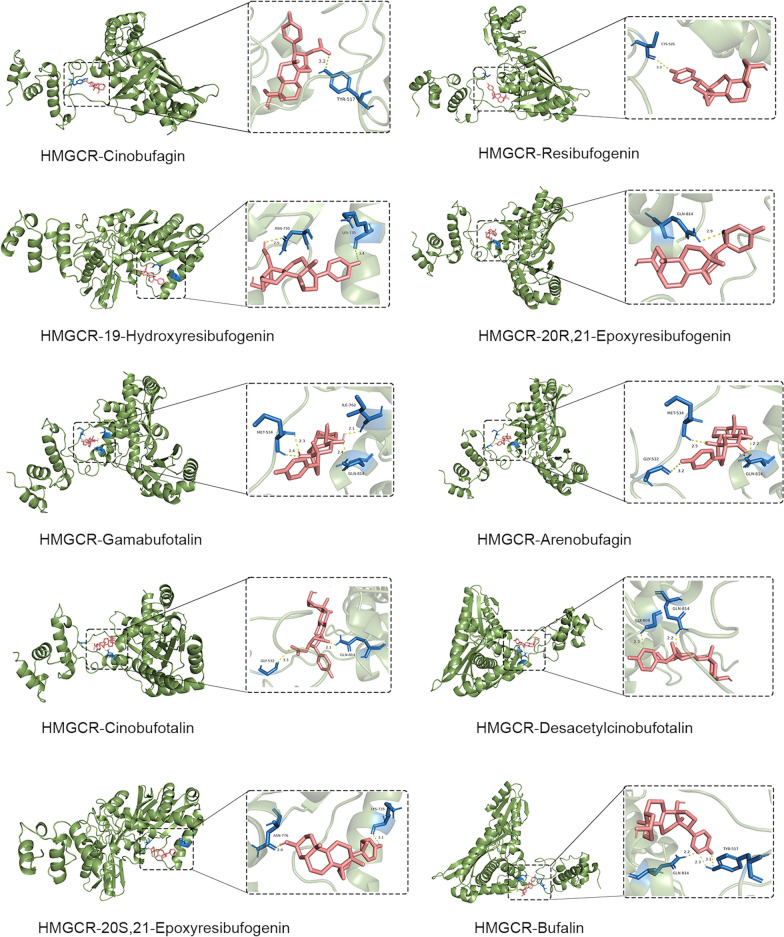
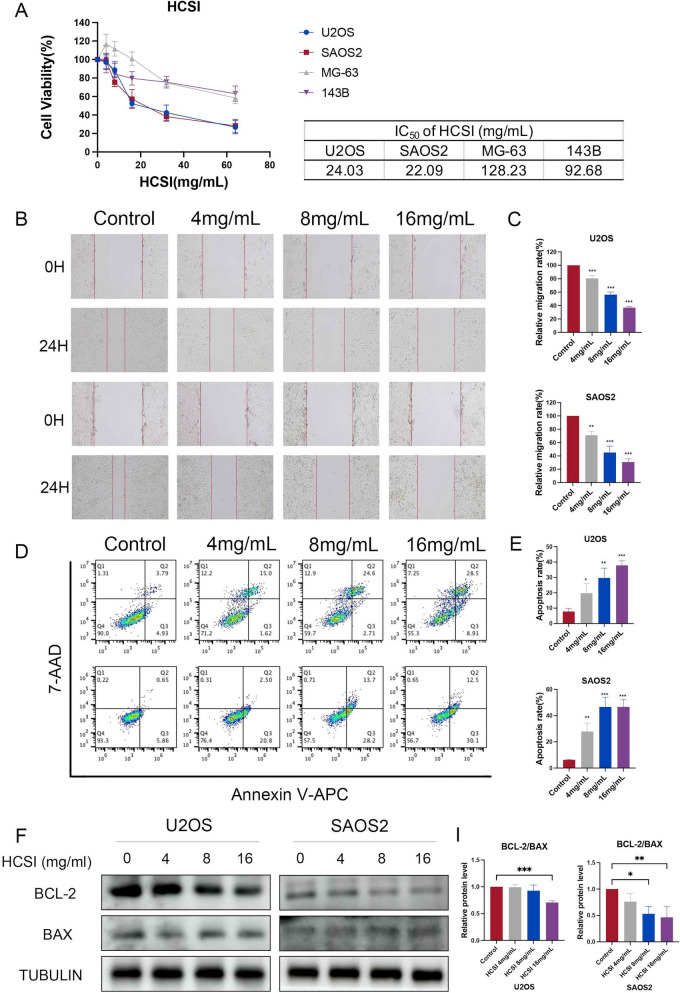
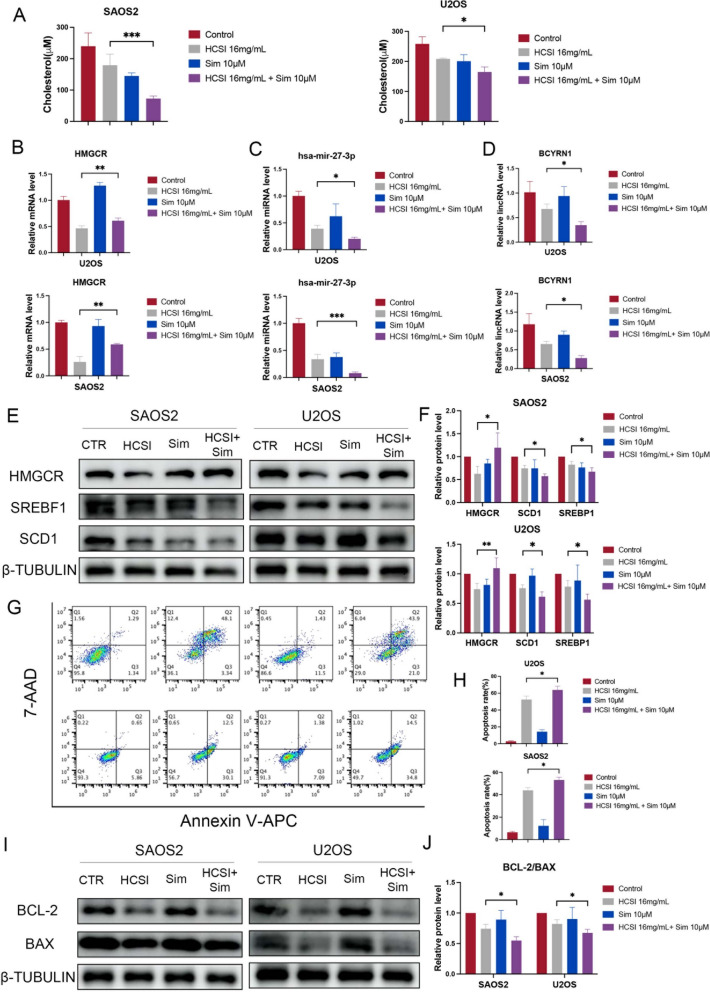
Results: Lipid metabolism pathways were obtained by non-target metabolomics enrichment. A total of 44 HCSI targets associated with osteosarcoma were collected by network pharmacology. Intersection of the mRNAs obtained from ceRNA network with the above 44 targets yielded eight common targets. The main target HMGCR were obtained by machine learning and RT-qPCR. The BCYRN1-miR-27a-3p-HMGCR axis was subsequently screened as the primary ceRNA regulatory network in HSCI against osteosarcoma. Molecular docking also showed an excellent affinity between the active compounds of HCSI and HMGCR. In vitro experiments demonstrated that HCSI down-regulated HMGCR, thereby reduced intracellular cholesterol levels, and ultimately promoting osteosarcoma cell apoptosis.

Conclusion: HCSI could inhibit osteosarcoma progression by regulating lipid metabolism through BCYRN1-miR-27a-3p-HMGCR axis, indicating that HCSI may provide insights for developing herbal medicine injection-based therapies for osteosarcoma.

Keywords: BCYRN1-miR-27a-3p-HMGCR axis; Huachansu injection; Lipid metabolism; Metabolomics; Network pharmacology; Osteosarcoma.


Conflict of interest statement

Declarations. Ethics approval and consent to participate: Not applicable. Consent for publication: The manuscript is approved by all authors for publication. Competing interests: The authors have declared no Competing interests.

Figures

Fig. 1
Fig. 1
HCSI may affect osteosarcoma cell progression by regulating lipid metabolism. A PCA model of control group, HCSI group and QC group in positive- ion mode. B PCA model of control group, HCSI group and QC group in negative-ion mode. C OPLS-DA scores scatter illustrating differences between the control groups and HCSI treated groups in positive-ion mode. D OPLS-DA scores scatter illustrating differences between the control groups and HCSI treated groups in negative-ion mode. E Heat map of hierarchical cluster analysis of differential metabolites in positive-ion mode and negative-ion mode. F Enriched metabolic pathways of differential metabolites in cell samples
Fig. 2
Fig. 2
Target identification of anti-osteosarcoma targets of HCS through lipid metabolism. A Normalization box plot of the GSE16088 and GSE16091 datasets. B Heatmap displaying the 44 DEGs as well as the intersecting targets. C Volcano plot of the DEGs. Red represents upregulated genes, while green represents downregulated genes. D A Venn diagram of the intersection genes of HCS, lipid metabolism and osteosarcoma. E Construction of “drug-active compounds-targets” network diagram. Circle nodes active compounds, diamond nodes represent targets, and V nodes represent the drug
Fig. 3
Fig. 3
Differential expression of lncRNAs and miRNAs of osteosarcoma. A Volcano plot of the DElncRNAs in the GSE225588 series. B Heatmap showing the 993 DElncRNAs. C Volcano plot of the DEmiRNAs in the GSE65071 series. D Heatmap showing the 149 DEmiRNAs. E A Venn diagram of the intersection mRNA from ceRNA and network pharmacology. F Construction of “lncRNAs-miRNAs-mRNAs” ceRNA network diagram. Triangular nodes represent lncRNAs, circle represent nodes miRNAs, and V nodes represent mRNAs. Size represents the RNA's degrees, with larger sizes indicating higher degrees
Fig. 4
Fig. 4
Identification of the core target for HCS through machine learning. A The coefficients and regularization diagrams from the LASSO logistic regression algorithm with tenfold cross-validation. B The accuracy rate curves based on the RF algorithm to select 6 related features. C The accuracy and error rate curves of fivefold cross-validation based on the SVM-RFE algorithm. D A Venn diagram of the intersection targets from 3 machine learning algorithms. EG The box plots of the expression analysis of the three targets based on the GSE16088 and GSE16091 datasets
Fig. 5
Fig. 5
Construction of the LncRNA-miRNA-mRNA axis. A Quantitative RT-PCR analysis for expression of HMGCR, HIF-1A and BACE1 in SAOS2 and U2OS cells with HCSI treatment (n = 3). B Kaplan–Meier overall survival curve based on HMGCR mRNA expression in TARGET OS dataset. C Construction of the lncRNAs-miRNAs-HMGCR network. D Quantitative RT-PCR analysis for expression of miR-27-3p and miR-206 in SAOS2 and U2OS cells with HCSI treatment (n = 3). E Quantitative RT-PCR analysis for expression of 10 lncRNAs in SAOS2 and U2OS cells with HCSI treatment (n = 3). Data are presented as mean ± SD (n = 4). *P < 0.05, **P < 0.01, and ***P < 0.001 versus the Control group
Fig. 6
Fig. 6
Immune cell infiltration analysis. A Eliminating the batch effect between GTEX and TCGA databases. B Stacked column chart of the infiltration of 22 types of immune cells in a total of 484 samples. C Box plot of the infiltration levels of 22 immune cells between the normal and osteosarcoma groups. D Lollipop graph of correlation between HMGCR expression and 22 immune cells in tumor tissues. EF Correlations between HMGCR expression and immune cells (P < 0.05)
Fig. 7
Fig. 7
Verification of molecular docking. Visualization of molecular docking results of 10 compounds with HMGCR. The green portions represent the target protein HMGCR. The red portions represent the compounds. Hydrogen bond interactions between the ligands and the receptors are represented by the yellow dashed lines. And the blue portions represent the amino acid residues linked to hydrogen bonds
Fig. 8
Fig. 8
HCSI inhibits the proliferation and migration of osteosarcoma cells in vitro. A The CCK-8 assay was used to detect the changes in cell viability after 24 h of HCSI (4, 8, 16, 32 mg/ml) treatment on U2OS, SAOS2, MG-63 and 143B cells, and to screen for the appropriate intervention concentration. B-C Flow cytometry detected that HCSI (4, 8, 16 mg/ml) induces apoptosis in U2OS and SAOS2 cells. D-E Wound healing assay was used to determine the migration ability of different concentrations of HCSI on U2OS and SAOS2 cells. F-I Western blotting was used to detect the expression of proliferative protein Bcl-2 and Bax after 24 h of intervention with different concentrations of HCSI. Data are presented as mean ± SD (n = 3). *P < 0.05, **P < 0.01, and ***P < 0.001 versus the Control group
Fig. 9
Fig. 9
HCSI regulated lipid metabolism in osteosarcoma cells. A-B Observation of neutral lipid content by staining with fluorescence dye BODIPY 493/503 in U2OS and SAOS2 cells with HCSI treatment. C Quantitative RT-PCR for mRNA expression levels of SCD1, SREBF1, HMGCR, HMGCS1 and CD36 with HCSI treatment (n = 4). D-E Protein levels of SCD1, SREBF1, HMGCR in H U2OS and SAOS2 cells with HCSI treatment. F Spearman correlation analysis of the relationship between the mRNA expression levels of HMGCR and SCD1, HMGCS1 and HMGCR in tumor tissues from 42 osteosarcoma patients. G Intracellular levels of cholesterol were measured in U2OS and SAOS2 cells with HCSI treatment. H-I Observation of intracellular ROS levels by staining with fluorescence dye DCFH-DA in U2OS and SAOS2 cells with HCSI treatment. Data are presented as mean ± SD (n = 3). *P < 0.05, **P < 0.01, and ***P < 0.001 versus the Control group
Fig. 10
Fig. 10
HCSI regulated lipid metabolism in osteosarcoma cells. A Intracellular levels of cholesterol were measured in U2OS and SAOS2 cells with HCSI and simvastatin treatment. B-D Quantitative RT-PCR for mRNA, miRNA and lncRNA expression levels of BCYRN1, miR-27a-3p and HMGCR with HCSI and simvastatin treatment. (n = 4). EF Protein levels of SCD1, SREBF1, HMGCR in the U2OS and SAOS2 cells with HCSI and simvastatin treatment. G-H Flow cytometry detected that HCSI and simvastatin induces apoptosis in U2OS and SAOS2 cells. I-J Western blotting was used to detect the expression of proliferative protein Bcl-2 and Bax after 24 h of intervention with HCSI and simvastatin treatment. Data are presented as mean ± SD (n = 3). *P < 0.05, **P < 0.01, and ***P < 0.001 versus the Control group

Similar articles

References

    1. Lu KH, Lu PWA, Lu EWH, Lin CW, Yang SF. Curcumin and its analogs and carriers: potential therapeutic strategies for human osteosarcoma. Int J Biol Sci. 2023;19(4):1241–65. 10.7150/ijbs.80590. - PMC - PubMed
    1. Tian H, Cao J, Li B, et al. Managing the immune microenvironment of osteosarcoma: the outlook for osteosarcoma treatment. Bone Res. 2023;11:11. 10.1038/s41413-023-00246-z. - PMC - PubMed
    1. Cheng D, Zhang Z, Mi Z, et al. Deciphering the heterogeneity and immunosuppressive function of regulatory T cells in osteosarcoma using single-cell RNA transcriptome. Comput Biol Med. 2023;165: 107417. 10.1016/j.compbiomed.2023.107417. - PubMed
    1. Lu KH, Lu EWH, Lin CW, Yang JS, Yang SF. New insights into molecular and cellular mechanisms of zoledronate in human osteosarcoma. Pharmacol Ther. 2020;214: 107611. 10.1016/j.pharmthera.2020.107611. - PubMed
    1. Angulo P, Kaushik G, Subramaniam D, et al. Natural compounds targeting major cell signaling pathways: a novel paradigm for osteosarcoma therapy. J Hematol OncolJ Hematol Oncol. 2017;10(1):10. 10.1186/s13045-016-0373-z. - PMC - PubMed

LinkOut - more resources