

TCF7L2 regulates GPX4 to resist ferroptosis and enhance osteogenesis in mouse mesenchymal stem cells
- PMID: 40764595
- PMCID: PMC12323166
- DOI: 10.1186/s40001-025-02993-7
TCF7L2 regulates GPX4 to resist ferroptosis and enhance osteogenesis in mouse mesenchymal stem cells
Abstract
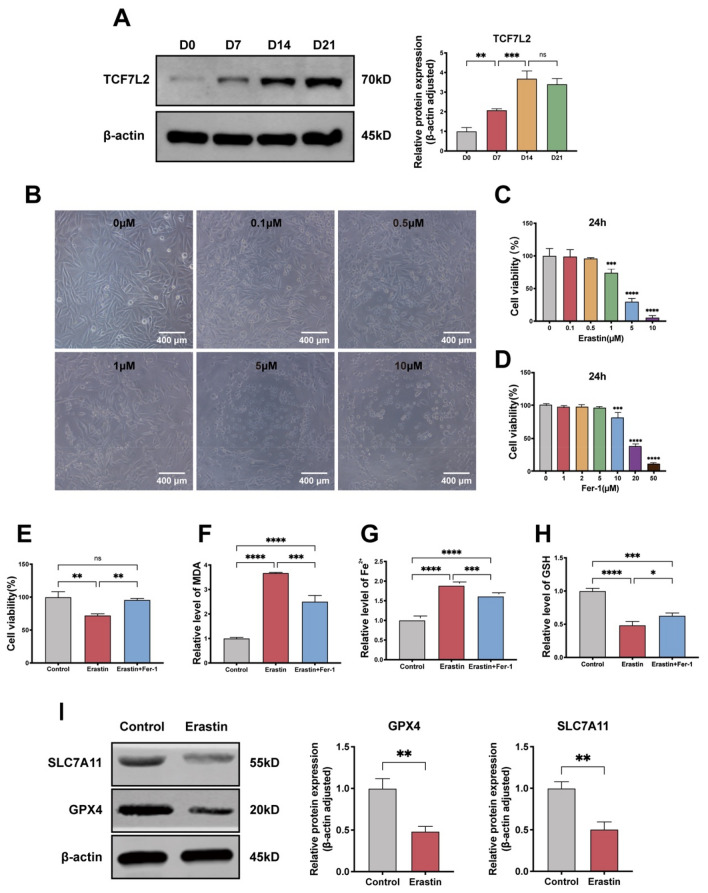
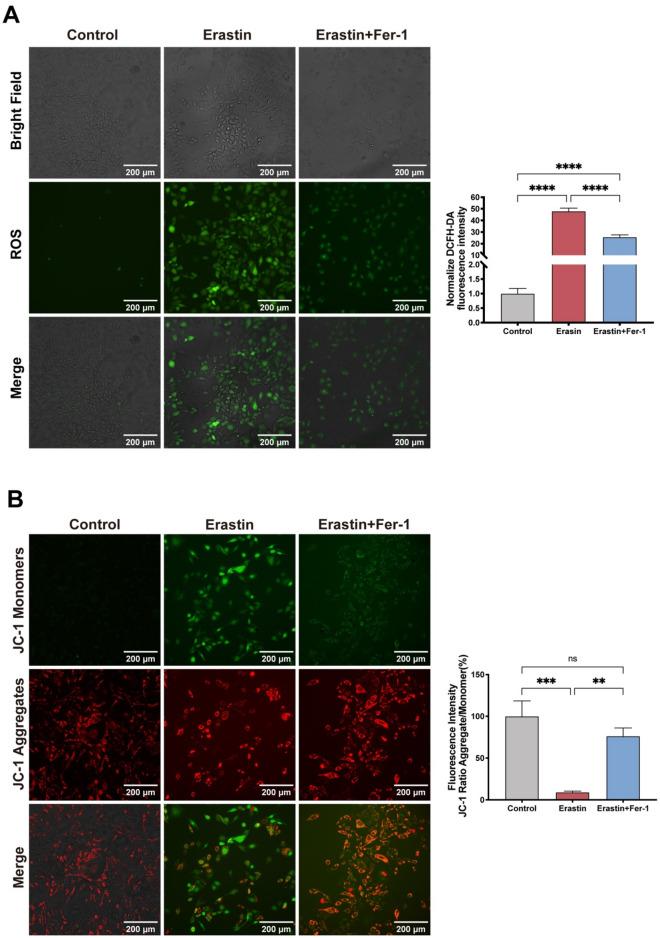
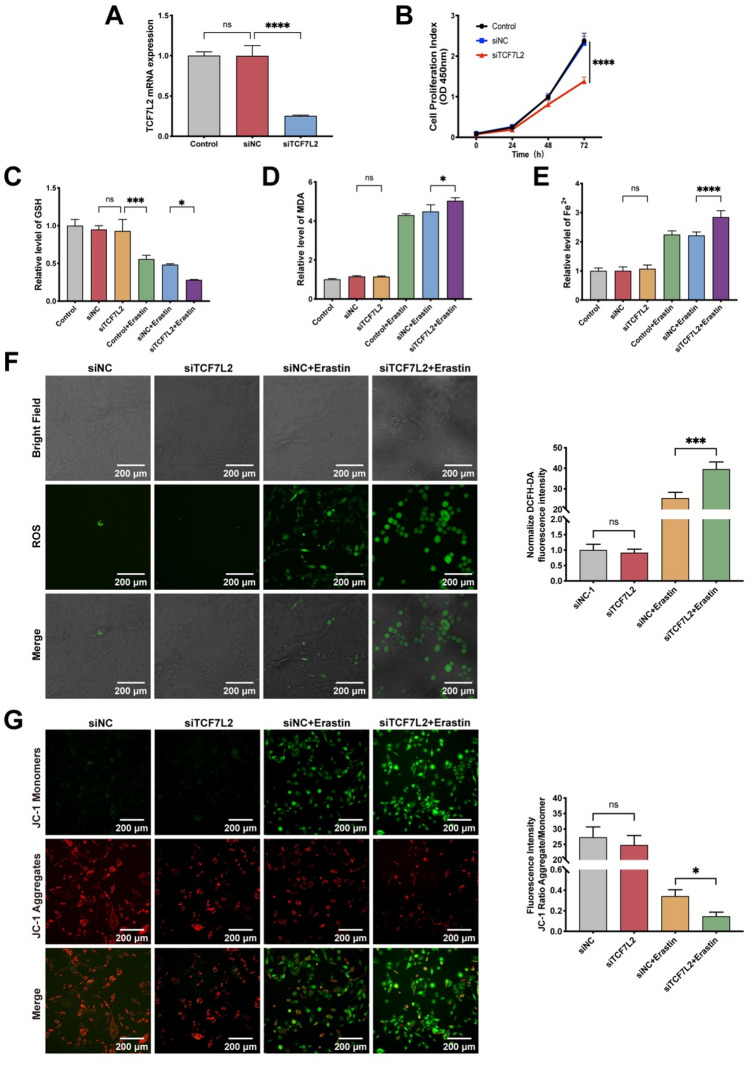
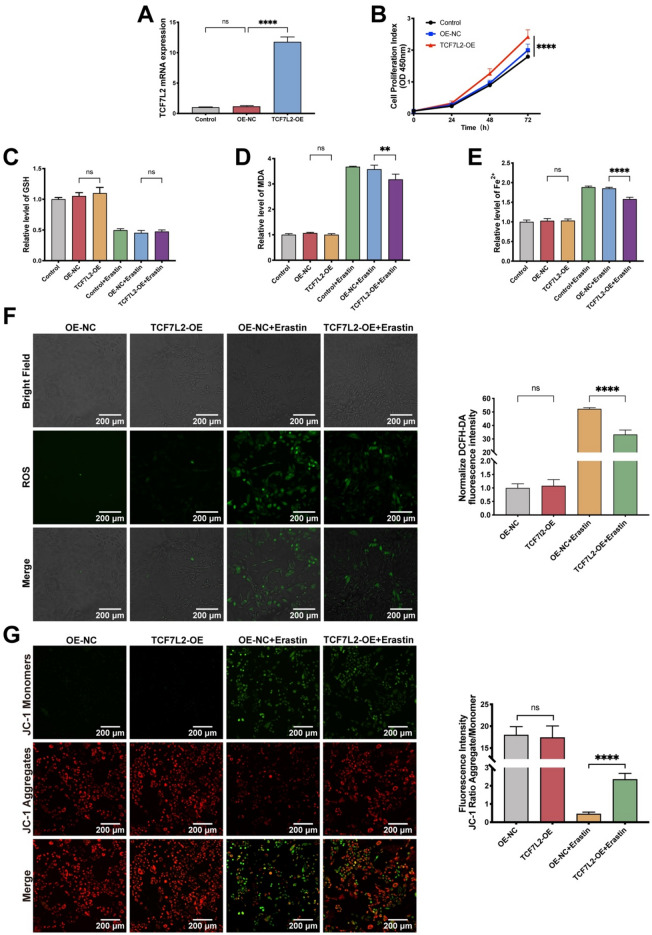
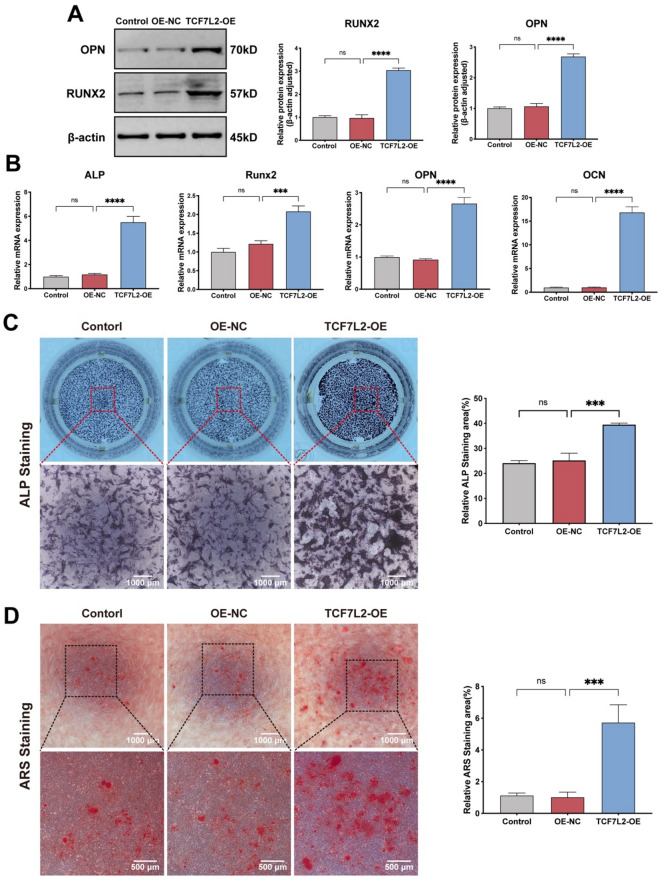
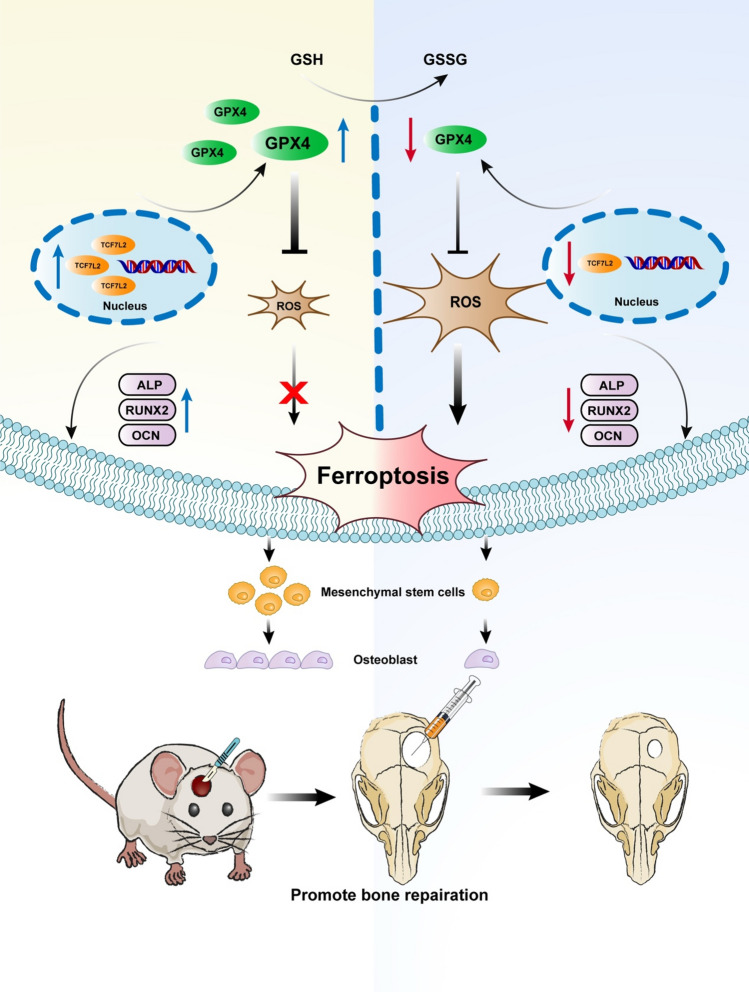
Critical-sized bone defects, characterized by poor spontaneous healing capacity, remain a common clinical challenge, and stem cell and gene therapies are key strategies for bone repair and regeneration. Transcription factor 7-like 2 (TCF7L2) is a key regulator of the Wnt signaling pathway, with potential applications in gene editing. However, the role of TCF7L2 in the osteogenic differentiation of bone marrow mesenchymal stem cells (BMSCs) remains poorly understood. We knocked down or overexpressed TCF7L2 to evaluate its effect on erastin-induced ferroptosis in BMSCs. Simultaneously, we assessed the impact of TCF7L2 overexpression on the osteogenic capacity of BMSCs. To confirm the involvement of glutathione peroxidase 4 (GPX4), we conducted rescue experiments by knocking down GPX4 expression. A mouse cranial defect model was established to analyze the effect of TCF7L2 overexpression on cranial bone healing. The results showed that TCF7L2 knockdown promoted, while TCF7L2 overexpression inhibited, erastin-induced ferroptosis in BMSCs. Mechanistic studies revealed that TCF7L2 knockdown reduced, while TCF7L2 overexpression enhanced, GPX4 expression, thereby regulating ferroptosis. Conversely, GPX4 knockdown significantly attenuated the regulatory effects of TCF7L2 overexpression on cell proliferation and ferroptosis inhibition. Furthermore, TCF7L2 overexpression promoted cell proliferation, osteogenic differentiation, and mineralization in vitro, while enhancing cranial defect healing in vivo. This study is the first to reveal the dual role of TCF7L2: regulating ferroptosis in BMSCs via GPX4, while promoting BMSC proliferation and osteogenic differentiation. These findings provide novel molecular targets and theoretical foundations for the treatment of bone defects.
Keywords: BMSCs; Ferroptosis; GPX4; Osteogenesis; Osteogenic differentiation; TCF7L2.
© 2025. The Author(s).
Conflict of interest statement
Declarations. Ethics approval and consent to participate: The animal study was reviewed and approved by the Animal Ethics Committee of Guangxi Medical University (No. 202212013). Consent for publication: Not applicable. Competing interests: The authors declare no competing interests.
Figures


Similar articles
-
MiR-370-3p regulate TLR4/SLC7A11/GPX4 to alleviate the progression of glucocorticoids-induced osteonecrosis of the femoral head by promoting osteogenesis and suppressing ferroptosis.J Orthop Translat. 2025 Feb 12;51:337-358. doi: 10.1016/j.jot.2024.10.014. eCollection 2025 Mar. J Orthop Translat. 2025. PMID: 40584015 Free PMC article.
-
Targeting PRMT1-mediated methylation of TAF15 to protect against myocardial infarction by inhibiting ferroptosis via the GPX4/NRF2 pathway.Clin Epigenetics. 2025 Jul 22;17(1):129. doi: 10.1186/s13148-025-01935-8. Clin Epigenetics. 2025. PMID: 40696470 Free PMC article.
-
Family with sequence similarity 20 member B regulates osteogenic differentiation of bone marrow mesenchymal stem cells on titanium surfaces.Acta Biomater. 2023 Apr 15;161:298-308. doi: 10.1016/j.actbio.2023.02.035. Epub 2023 Mar 4. Acta Biomater. 2023. PMID: 36871775
-
Selenium and selenoproteins: key regulators of ferroptosis and therapeutic targets in cancer.J Mol Med (Berl). 2025 Aug;103(8):899-911. doi: 10.1007/s00109-025-02563-8. Epub 2025 Jun 17. J Mol Med (Berl). 2025. PMID: 40527925 Review.
-
Targeting GPX4 in ferroptosis and cancer: chemical strategies and challenges.Trends Pharmacol Sci. 2024 Aug;45(8):666-670. doi: 10.1016/j.tips.2024.05.006. Epub 2024 Jun 11. Trends Pharmacol Sci. 2024. PMID: 38866667 Review.
References
-
- Xie C, Ye J, Liang R, Yao X, Wu X, Koh Y, et al. Advanced strategies of biomimetic tissue-engineered grafts for bone regeneration. Adv Healthc Mater. 2021. 10.1002/adhm.202100408. - PubMed
-
- Duda GN, Geissler S, Checa S, Tsitsilonis S, Petersen A, Schmidt-Bleek K. The decisive early phase of bone regeneration. Nat Rev Rheumatol. 2023;19(2):78–95. - PubMed
-
- Cerqueni G, Scalzone A, Licini C, Gentile P, Mattioli-Belmonte M. Insights into oxidative stress in bone tissue and novel challenges for biomaterials. Mater Sci Eng, C. 2021;130: 112433. - PubMed
MeSH terms
Substances
Grants and funding
- No. GuiKeAD23026324/Specific Research Project of Guangxi for Research Bases and Talents
- No. GuiKeAD23026324/Specific Research Project of Guangxi for Research Bases and Talents
- No. GuiKeAD23026324/Specific Research Project of Guangxi for Research Bases and Talents
- No. GuiKeAD23026324/Specific Research Project of Guangxi for Research Bases and Talents
- No. GuiKeAD23026324/Specific Research Project of Guangxi for Research Bases and Talents
LinkOut - more resources
Full Text Sources
