. 2025 Aug 5;15(1):28503.
doi: 10.1038/s41598-025-14409-x.

Role of T cell exhaustion and tissue-resident memory T cells in the expression and prognosis of colorectal cancer

Affiliations

Role of T cell exhaustion and tissue-resident memory T cells in the expression and prognosis of colorectal cancer

Han Wu et al. Sci Rep. .

Abstract

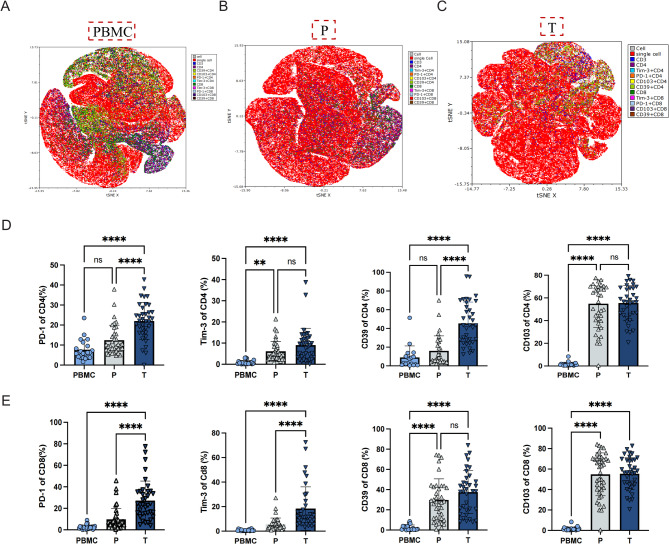
The tumour microenvironment (TME) is complex and dynamic, and changes significantly with tumour progression. Studying the evolving state of T cells, especially tumour-specific subsets, has become feasible. However, the roles of exhausted T cells (Tex) and pre-exhausted tissue-resident memory T cells (pf-Trm), which emerge after prolonged antigen stimulation, remain unclear. Using single-cell sequencing data, we analyzed the immune landscape of patients with colorectal cancer (CRC) across clinical stages to quantify the abundance of T cell subtypes. Functional enrichment analysis revealed that early stage Tex cells retained some functionality, whereas advanced stage Tex cells showed a significant functional loss. Early stage pf-Trm cells actively participate in immune surveillance and antigen presentation, whereas advanced stage pf-Trm cells exhibit reduced functions. Flow cytometry analysis of clinical cohorts was used to measure the proportions of Tex and pf-Trm. Elevated levels of PD-1 and Tim-3 have been detected in TILs from CRC patients. Data from The Cancer Genome Atlas (TCGA) linked high Tex levels to poor prognosis in CRC, while pf-Trm correlated with better outcomes in early CRC but worse outcomes in advanced CRC due to functional exhaustion. Thus, Tex and pf-Trm cells may serve as prognostic biomarkers, and Tim-3 and CD103 may be promising targets for immune checkpoint inhibitors.

Keywords: Clinical prognosis; Colorectal cancer; Pre-failure tissue-resident memory T cells; T-cell exhaustion; Tumour microenvironment.


Conflict of interest statement

Declarations. Competing interests: The authors declare no competing interests. Ethical approval: Approval of the research protocol by an Institutional Reviewer Board. Informed consent: Informed consents were provided by all the participants.

Figures

Fig. 1
Fig. 1
Identification of Seven TME-Associated Cell Subsets in Colorectal Cancer by scRNA-seq. (A) UMAP plot displaying the major cell types identified. (B) Dot plot showing key marker gene expression across cell types; dot size indicates cell proportion, and colour intensity indicates average expression. (C) UMAP plot of immune cell distribution across the TME from Stage I to Stage IV. (D–E) Bar plots illustrating dynamic changes and relative proportions of cell populations and T cell subsets across Stages I to IV. (F) Interaction strength among TME-associated cell subsets in early-stage CRC (Stages I–II). (G) Interaction strength among TME-associated cell subsets in advanced-stage CRC (Stages III–IV).TME, tumour microenvironment; scRNA-seq, single-cell RNA sequencing; UMAP, Uniform Manifold Approximation and Projection; T, T cells; NK, natural killer cells; PD−1, programmed cell death protein 1; Tim−3, T cell immunoglobulin and mucin-domain containing−3; CD39, ectonucleoside triphosphate diphosphohydrolase−1; CD103, integrin alpha E; TIL, tumour-infiltrating lymphocyte; TPM, transcripts per million.
Fig. 2
Fig. 2
Characterisation of PD−1, Tim−3, CD39 and CD103 Expression in T/NK Cell Subsets (A) UMAP visualisation of T/NK cell subsets.(B) Dot plot displaying expression levels and frequencies of key genes across T/NK cell subtypes. (C) UMAP plots showing T/NK cell distribution and transcriptomic profiles across Stages I–IV. (D–E) Bar plots illustrating dynamic changes and relative proportions of T cell subsets across Stages I to IV.(F) UMAP plots showing expression patterns of PDCD1, HAVCR2, ENTPD1, and ITGAE.(G–H) Differentiation trajectory of CD8⁺ T cells visualised by cluster identity (G) and pseudotime (H).UMAP, Uniform Manifold Approximation and Projection; T, T cells; NK, natural killer cells; PDCD1, programmed cell death protein 1; HAVCR2, hepatitis A virus cellular receptor 2; ENTPD1, ectonucleoside triphosphate diphosphohydrolase 1; ITGAE, integrin alpha E.
Fig. 3
Fig. 3
PDCD1, HAVCR2, ENTPD1, and ITGAE Expression in MSS and MSI Colorectal Cancer: Clinical and Prognostic Insights. (A) UMAP visualisation of PDCD1, HAVCR2, ENTPD1, and ITGAE expression in CRC patients. (B) Expression levels of PDCD1, HAVCR2, ENTPD1, and ITGAE across CD4⁺ T cells, CD8⁺ T cells, and NK cell subsets. (C) Hierarchical clustering heatmap showing the expression profiles of PDCD1, HAVCR2, ENTPD1, and ITGAE, with row-wise Z-score normalisation. (D) Comparative expression of PDCD1, HAVCR2, ENTPD1, and ITGAE between MMRp and MMRd CRC patients.two-tailed unpaired Student’s t-testswas used in D, *p < 0.05, **p < 0.01, ***p < 0.001.CRC, colorectal cancer; PDCD1, programmed cell death protein 1; HAVCR2, hepatitis A virus cellular receptor 2; ENTPD1, ectonucleoside triphosphate diphosphohydrolase 1; ITGAE, integrin alpha E; MSS, microsatellite stable; MSI, microsatellite instability; MMRp, mismatch repair proficient; MMRd, mismatch repair deficient; UMAP, Uniform Manifold Approximation and Projection; NK, natural killer; Z-score, standard score.
Fig. 4
Fig. 4
Flow Cytometry Analysis of Different T Cell Phenotypes. (A-C) t-SNE visualization of CD4 + T and CD8 + T cells in immune compartments, categorized by source. (D) Frequencies of PD-1, Tim-3, CD39 and CD103 on CD4 + T cells from PBMC, P, and T samples. (E) Frequencies of PD-1, Tim-3, CD39 and CD103 on CD8 + T cells from PBMC, P, and T samples. (Data are presented as mean ± SD). t-SNE: t-distributed Stochastic Neighbor Embedding.Depending on data normality and variance homogeneity, ANOVA, Welch’s ANOVA, or Kruskal–Wallis test with appropriate post hoc comparisons was used in D and E. *p < 0.05, **p < 0.01, ***p < 0.001.t-SNE, t-distributed stochastic neighbour embedding; PBMC, peripheral blood mononuclear cells; P, peritumoural tissue; T, tumour tissue; CD4, cluster of differentiation 4; CD8, cluster of differentiation 8; PD-1, programmed cell death protein 1; Tim-3, T cell immunoglobulin and mucin-domain containing-3; CD39, ectonucleoside triphosphate diphosphohydrolase-1; CD103, integrin αE.
Fig. 5
Fig. 5
Cell Dynamics of tex, pf-Trm, tumour-reactive CD8⁺ T cells and bystander CD8⁺ T cells in Tumour Tissues During CRC Progression. (A) t-SNE plots illustrating the distribution of CD8⁺ T cells across Stage I to IV CRC, stratified by TIL enrichment based on PD-1, Tim-3, CD39, and CD103 expression. Tex, pf-Trm, Tumour-reactive CD8⁺ T cells and bystander CD8⁺ T cells populations are highlighted. (B) Frequency of PD-1, Tim-3, and CD39 within CD103⁺CD4⁺ subsets. (C) Frequency of PD-1, Tim-3, and CD39 within CD103⁺CD8⁺ subsets. (D) PD-1, Tim-3, and CD103 expression in CD8⁺ T cells in early (Stages I–II) vs. advanced (Stages III–IV) CRC.(E) Expression levels of Tim-3⁻PD-1⁺, Tim-3⁺PD-1⁺, Tim-3⁺PD-1⁻, and Tim-3⁻PD-1⁻ subsets within CD103⁺CD4⁺ T cells, and pf-Trm (Tim-3⁻PD-1⁺), Tex (Tim-3⁺PD-1⁺), Tim-3⁺PD-1⁻ within CD103⁺CD8⁺ T cells in CRC patients. (F) Expression levels of PD-1 and Tim-3 in tumour-reactive CD8⁺ T cells and bystander CD8⁺ T cells in CRC patients.(G) Expression levels of PD-1, Tim-3, CD39, and CD103 across CRC Stages II, III, and IV. (H) Proportions of Tex (PD-1⁺Tim-3⁺CD103⁺) and pf-Trm (PD-1⁺Tim-3⁺CD103⁻) among CD8⁺ T cells.(I) Proportions of tumour-reactive CD8⁺ T cells (CD39⁺CD103⁺ and CD39⁺CD103⁻) and bystander CD8⁺ T cells (CD39⁻CD103⁺ and CD39⁻CD103⁻).CRC, colorectal cancer; Tex, terminally exhausted T cells; pf-Trm, precursor exhausted tissue-resident memory T cells; Trm, tissue-resident memory T cells; TIL, tumour-infiltrating lymphocyte; PD-1, programmed cell death protein 1; Tim-3, T cell immunoglobulin and mucin-domain containing-3; CD39, ectonucleoside triphosphate diphosphohydrolase-1; t-SNE, t-distributed stochastic neighbor embedding. Data shown as mean ± SD. Depending on data normality and variance homogeneity, ANOVA, Welch’s ANOVA, or Kruskal–Wallis test with appropriate post hoc comparisons was used in B, C and E. Two-tailed unpaired Student’s t-tests was used in D, *P < 0.05, **P < 0.01, ***P < 0.001.
Fig. 6
Fig. 6
Functional Changes in Tex and pf-Trm in Early and Advanced Stages. (A)UMAP visualization and transcriptomes of CD8 Tex, CD8 pf-Trm, and proliferating CD8 T cells. (B) Dynamic changes in CD8 Tex, CD8 pf-Trm, and proliferating CD8 T cells from Stage I to IV. (C) BP enriched by upregulated genes in Tex and pf-Trm cells. (D) KEGG pathways enriched by upregulated genes in Tex and pf-Trm cells. (E-F) Survival curves for Tex in early (E) and advanced (F) CRC stages. (G-H) Survival curves for pf-Trm in early (G) and advanced (H) CRC stages.Tex, terminally exhausted T cells; pf-Trm, precursor exhausted tissue-resident memory T cells; t-SNE, t-distributed stochastic neighbor embedding; TIL, tumour-infiltrating lymphocyte; PD-1, programmed cell death protein 1; KEGG, Kyoto Encyclopedia of Genes and Genomes; BP, biological process; CRC, colorectal cancer.

Similar articles

References

    1. Siegel, R. L., Miller, K. D., Wagle, N. S. & Jemal, A. Cancer statistics, 2023. CA Cancer J. Clin.73, 17–48 (2023). - PubMed
    1. Bray, F. et al. Global cancer statistics 2022: GLOBOCAN estimates of incidence and mortality worldwide for 36 cancers in 185 countries. CA Cancer J. Clin.74, 229–263 (2024). - PubMed
    1. Sadeghi, M., Dehnavi, S., Sharifat, M., Amiri, A. M. & Khodadadi, A. Innate immune cells: key players of orchestra in modulating tumor microenvironment (TME). Heliyon10, e27480 (2024). - PMC - PubMed
    1. Gajewski, T. F., Schreiber, H. & Fu, Y. X. Innate and adaptive immune cells in the tumor microenvironment. Nat. Immunol.14, 1014–1022 (2013). - PMC - PubMed
    1. Binnewies, M. et al. Understanding the tumor immune microenvironment (TIME) for effective therapy. Nat. Med.24, 541–550 (2018). - PMC - PubMed

MeSH terms

Substances