. 2025 Sep;5(9):754-768.
doi: 10.1038/s43588-025-00841-6. Epub 2025 Aug 5.

Virtual brain twins for stimulation in epilepsy

Affiliations

Virtual brain twins for stimulation in epilepsy

Huifang E Wang et al. Nat Comput Sci. 2025 Sep.

Abstract

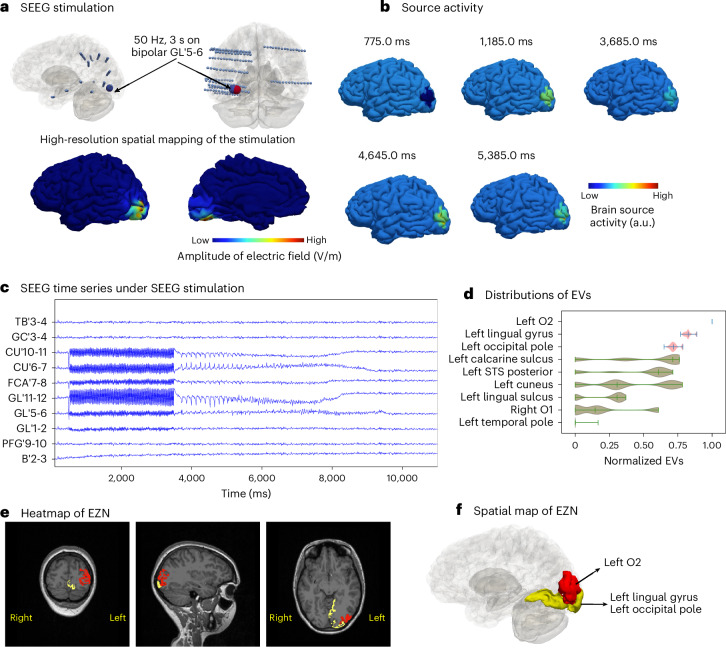
Estimating the epileptogenic zone network (EZN) is an important part of the diagnosis of drug-resistant focal epilepsy and has a pivotal role in treatment and intervention. Virtual brain twins provide a modeling method for personalized diagnosis and treatment. They integrate patient-specific brain topography with structural connectivity from anatomical neuroimaging such as magnetic resonance imaging, and dynamic activity from functional recordings such as electroencephalography (EEG) and stereo-EEG (SEEG). Seizures show rich spatial and temporal features in functional recordings, which can be exploited to estimate the EZN. Stimulation-induced seizures can provide important and complementary information. Here we consider invasive SEEG stimulation and non-invasive temporal interference stimulation as a complementary approach. This paper offers a high-resolution virtual brain twin framework for EZN diagnosis based on stimulation-induced seizures. It provides an important methodological and conceptual basis to make the transition from invasive to non-invasive diagnosis and treatment of drug-resistant focal epilepsy.


Conflict of interest statement

Competing interests: V.J., B.D., P.T., H.E.W. and A.W. hold a patent related to the technology and methods discussed in this article: A method and system for estimating an epileptogenic zone network: European Patent EP23169009.0.

Figures

Fig. 1
Fig. 1. The workflow of the virtual brain twin for estimating the EZN using stimulation techniques.
a,b, A personalized high-resolution model (a) is based on individual brain geometry extracted from T1-weighted MRI and structural connectivity from tractography on diffusion-weighted MRI data (b). High-resolution virtual brain models simulate neural source activity with spatial resolutions of about 10 mm2. The modeling parameters are inferred from the spontaneous SEEG recordings (b). c,d, We illustrate two types of stimulation: SEEG and TI, to induce seizure activity. c, SEEG stimulation uses bipolar stimulation in which two electrodes are used: one serves as the cathode and the other as the anode. The electric current flows between two electrodes, which is parameterized by current amplitude, pulse width and frequency. d, TI stimulation applies two current sources (I) simultaneously via electrically isolated pairs of scalp electrodes (green and pink) at kliohertz frequencies f and f + Δf. The currents generate oscillating electric fields, which results in an envelope amplitude that is modulated periodically at Δf. The electric field influences the brain activity that can be generated by the high-resolution personalized whole-brain model (a). The red and blue dots represent SEEG and scalp-EEG electrodes, respectively. e, The simulated source activity can be mapped onto the corresponding SEEG and scalp-EEG signals, through the gain matrices, which are constructed based on the locations of SEEG and scalp-EEG electrodes relative to the source vertices. The red curves on the scalp-EEG recordings are plotted using a different scale to visualize the signals following the high-amplitude signals induced by TI stimulation. f, By utilizing data features extracted from SEEG and scalp-EEG signals, Bayesian inference methods can estimate a posterior distribution of EVs, suggesting the potential EZN.
Fig. 2
Fig. 2. VEP diagnostic mapping for spontaneous seizures (empirical data).
a, SEEG recordings from one seizure in a 23-year-old female patient. The left axis shows the names of the selected electrode channels. b, Posterior distribution of the EVs (higher value indicates higher probability of seizure) for ten selected regions obtained from the HMC pipeline. Each violin plot shows the distribution of the entire data range using a kernel density estimate. The three bars represent the 25th percentile, the median and the 75th percentile, respectively. All violin plots in this paper follow the same format. c, Heatmap of the left O2 identified by VEP (in red) shown in a preoperative T1-MRI. d, Heatmap of the left O2 identified by VEP (in red) shown in a postoperative T1-MRI. e, The left O2 (in red) was projected on the patient’s 3D meshes. Source data
Fig. 3
Fig. 3. Estimating EZN from a SEEG-stimulation-induced seizure (synthetic data).
a, Top: GL’5-6 (large blue/red sphere) is the stimulated contact in the left occipital lobe, using a bipolar pulse stimulation (50 Hz for a duration of 3.5 s with pulse duration 1 ms). Bottom: spatial map showing the amplitude of electric field (indicated by the color bar) at each brain vertex, induced by SEEG stimulation from contact pair GL’5-6. b, Neural source activity in arbitrary units (a.u.) is shown on the cortical mesh at five different time points, with values indicated by color. The seizures are located around the left O2 region of the VEP atlas. c, Selected simulated SEEG time series from a SEEG-stimulation-induced seizure. d, Posterior distribution of the EVs (higher value indicates higher chance for seizure) of nine selected regions obtained from HMC sampling. Each violin plot shows the distribution of the entire data range using a kernel density estimate. The three bars represent the 25th percentile, the median and the 75th percentile, respectively. Red regions indicate highest chance of being the EZN; the other areas are in green. e,f, The region of the highest EV posterior distribution is the left O2 in red shown in T1-MRI (e) and the 3D brain (f). The two regions (the left lingual gyrus and the left occipital pole) are shown in yellow. Source data
Fig. 4
Fig. 4. Estimating EZN from TI-stimulation-induced seizure (synthetic data).
a, The electric field of TI stimulation by two pairs of scalp-EEG electrodes (shown in red and orange) based on the 10-5 international reference system, using an extended scalp-EEG cap from SIMNIBS. We applied stimulation at 1,000 Hz and 1,005 Hz through the first (PPO3, P5h) and second (PPO5, PO5h) scalp electrode pairs, respectively. The electrodes PPO3, P5h, PPO5 and PO5h are part of the extended 10–5 EEG system and correspond to intermediate scalp locations over the parietal and parieto-occipital regions. The spatial distribution of the amplitude of the TI electric field is colored in the 3D brain. b, Seizure dynamics were simulated using the Epileptor-Stimulation model through the TI stimulation. Neural activity is shown in color on the cortical mesh at six different time points. The seizures are located around the left O2 regions of the VEP atlas. c, Simulated scalp-EEG time series from TI-stimulation-induced seizure. The y-axis shows the names of selected scalp-EEG channels. The scaled-up time series during the seizure period is shown in red. d, Posterior distribution of the EVs (higher value indicates higher chance for seizure) for ten selected regions obtained from the HMC sampling. Red regions indicate highest chance of being the EZN; the others are in green. e,f, The region of the highest EV posterior distribution is the left O2 in red shown in T1-MRI (e) and the 3D brain (f). The second region (left O1) is shown in yellow. Source data
Fig. 5
Fig. 5. Multimodal inference for EZN estimation from simultaneous SEEG and scalp-EEG recordings (synthetic data).
a, We combined ictal recordings from SEEG (middle top) and scalp-EEG (middle bottom) induced by SEEG stimulation (left), using multimodal inference to obtain the distribution of EVs (right top). The results were mapped in the 3D brain. In this case, we obtained the ground-truth left O2 in red. The spatial distribution of source activity at 4,634 ms is shown at the bottom left. b, We combined ictal recordings from SEEG (middle top) and scalp-EEG (middle bottom) induced by TI stimulation (left), using multimodal inference to obtain the distribution of EVs (right top). The results were mapped in three dimensions. In this case, we obtained the ground-truth left O2 in red and additional brain region as left STS posterior in yellow. The spatial distribution of source activity at 9,980 ms is shown at the bottom left. Source data
Fig. 6
Fig. 6. Estimating EZN from SEEG stimulation for a second patient with frontal lobe epilepsy (synthetic data).
a, Top: PM’3-4 (large blue/red sphere) is the stimulated contact in the left frontal lobe, using a bipolar pulse stimulation (50 Hz for a duration of 3 s with pulse duration 1 ms). Bottom: spatial map showing the amplitude of electric field (shown in the color bar from low (left) to high (right) values) at each brain vertex, induced by SEEG stimulation (from sensor PM’3-4). b, Seizure dynamics were simulated using the Epileptor-Stimulation model and induced through SEEG stimulation. Neural source activity in arbitrary units (a.u.) is shown on the cortical mesh at five different time points, with values indicated by color. c, Selected simulated SEEG time series (top) and EEG time series (bottom) from SEEG-stimulation-induced seizure. The scaled-up time series during the seizure period are shown in red. d, Posterior distribution of EVs (higher value indicates higher chance for seizure) for eight selected regions obtained from the HMC sampling when analyzing simultaneously SEEG and scalp-EEG. SMA, supplementary motor area. e, The highest chance of being the EZN as left F1 lateral prefrontal in red mapped in the 3D brain and left F1 mesial prefrontal cortex and left-middle frontal sulcus in yellow. Source data
Extended Data Fig. 1
Extended Data Fig. 1. Estimating EZN from TI stimulation for a second patient with frontal lobe epilepsy (synthetic data).
a The electric field of TI stimulation by two pairs of scalp-EEG electrodes (shown in red and orange). We applied a frequency of 1000 and 1005 Hz for the first and second electrode pairs, respectively. The Spatial distribution of the peak activity of the TI envelope is colored on the 3D brain. b Seizure dynamics were simulated using the Epileptor-Stimulation model through the TI stimulation. Neural activity is shown on the cortical mesh at 4 different time points. c Selected synthetic SEEG time-series (top) and scalp-EEG time-series (bottom) from TI stimulation-induced seizure. The scaled-up time series during the seizure period are shown in red. d Posterior distribution of the EV (higher value indicates higher chance for seizure) for 8 selected regions the same as Fig. 6d. e The highest chance of being the EZN as left-middle-frontal-sulcus in red mapped in 3D brain and left-F1-lateral-prefrontal and left-orbito-frontal-cortex in yellow. Source data.
Extended Data Fig. 2
Extended Data Fig. 2. The effect of increasing local connectivity within EZNs under SEEG stimulation as shown in Fig. 6.
a Snapshot of source activity (corresponding videos available in the Supplementary Information) at two specified time instants for comparison when the local connectivity within EZN γlcEZ is r times the local connectivity γlc of other brain regions with r = 2, 3, 4, 5. b. When γlcEZ=2γlc, selected simulated SEEG time-series (top) and EEG time-series (middle) from SEEG stimulation-induced seizure. The scaled-up time series during the seizure period are shown in red. Posterior distribution of EVs (bottom) from the HMC sampling are shown when analyzing simultaneously SEEG and scalp-EEG. c Same as b, but under the condition γlcEZ=5γlc. Source data.

References

    1. Bartolomei, F. et al. Defining epileptogenic networks: contribution of SEEG and signal analysis. Epilepsia58, 1131–1147 (2017). - PubMed
    1. Katz, J. S. & Abel, T. J. Stereoelectroencephalography versus subdural electrodes for localization of the epileptogenic zone: what is the evidence? Neurotherapeutics16, 59–66 (2019). - PMC - PubMed
    1. Isnard, J. et al. French guidelines on stereoelectroencephalography (SEEG). Neurophysiol. Clin.48, 5–13 (2018). - PubMed
    1. Jehi, L. et al. Comparative effectiveness of stereotactic electroencephalography versus subdural grids in epilepsy surgery. Ann. Neurol.90, 927–939 (2021). - PMC - PubMed
    1. Bartolomei, F., Chauvel, P. & Wendling, F. Epileptogenicity of brain structures in human temporal lobe epilepsy: a quantified study from intracerebral EEG. Brain131, 1818–1830 (2008). - PubMed