. 2025 Aug 5;8(1):1158.
doi: 10.1038/s42003-025-08598-4.

GABAergic neurons in the dorsal raphe nucleus regulate social hierarchy in mice

Affiliations

GABAergic neurons in the dorsal raphe nucleus regulate social hierarchy in mice

Yanzhu Fan et al. Commun Biol. .

Abstract

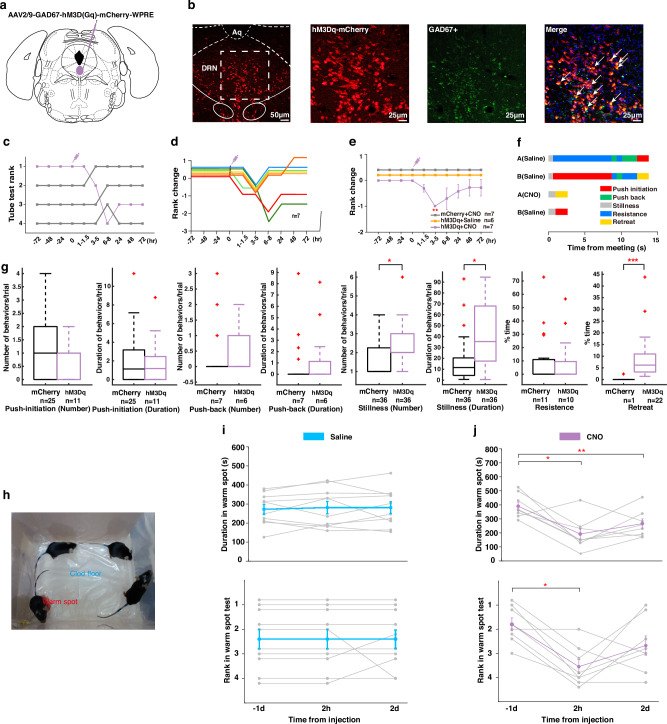
Social hierarchy serves as a fundamental organizational mechanism within most animal societies, however, the neural mechanisms governing dominance hierarchies remain inadequately understood. Considering that GABAergic neurons in the dorsal raphe nucleus (DRN) exert substantial inhibitory control over brain activity, we hypothesized that these neurons play a pivotal role in regulating social hierarchy. To test this, we employed a combination of optogenetics, chemogenetics, fiber photometry, and behavioral assays in mice to elucidate the functional contributions of these neurons. Our results revealed a biphasic activity pattern of DRN GABAergic neurons, characterized by increased firing during retreats and decreased firing during the initiation of effortful behaviors in the tube test. Furthermore, activation of these neurons led to an increase in the number of retreats and a reduction in social rank, while inhibition of these neurons produced the opposite effects. These findings elucidate the bidirectional regulatory role of DRN GABAergic neurons in social hierarchy.


Conflict of interest statement

Competing interests: The authors declare no competing interests.

Figures

Fig. 1
Fig. 1. DRN GABAergic neurons demonstrated activation during retreat but inactivation during push-initiation in the tube test.
a Schematic representation of the viral injection site in the DRN utilizing AAV2/9-GAD67-GCaMP6s-3xFLAG. b Representative photomicrographs of the DRN showing GCaMP6s (green, left) with the enlarged pictures for the boxed area illustrating GCaMP6s expression (green, second subplot), GAD67+ (red, third subplot), and their co-localization with DAPI (right). c Schematic of the fiber photometry setup (left) and a simplified diagram of the tube test procedure (right). d Ca2+ signals were aligned to the onset of retreats when DRN-GCaMp6s mice meet with their cage mates during the tube test. Upper panel, mean (blue trace) ± SEM (gray shading) showing the average Ca2+ signal transients for all trials (n = 6 mice). The red segment indicates a statistically significant increase from baseline (p < 0.05; permutation test). Middle panel, the heatmap of Ca2+ signals for all trials with each row representing an individual trial (n = 70 trials from 6 mice). Lower panel, the heatmap of Ca2+ signals averaged across all trials for each animal (n = 6 mice). e Ca2+ signals were aligned to the onset of retreats in DRN-EGFP mice meeting with their cage mates in the tube test (n = 124 trials from 7 mice). The three panels exhibit similarities to those in panels (d). f Ca2+ signals were aligned to the onset of push-initiations in DRN-GCaMp6s mice meeting with their cage mates in the tube test (n = 57 trials from 6 mice). The red segment indicates a statistically significant decrease from baseline (p < 0.05; permutation test). The three panels show resemblance to those depicted in panels (d). g Ca2+ signals were aligned to the onset of push-initiations in DRN-EGFP mice meeting with their cage mates in the tube test (n = 133 trials from 6 mice). The three panels exhibit similarities to those in panels (d).
Fig. 2
Fig. 2. Optogenetic activation of DRN GABAergic neurons led to loss in the tube test.
a Schematic depiction of the injection site in the DRN for the virus AAV2/9-GAD67-hChR2(H134R)-EGFP-3xFLAG-WPRE. b Representative photomicrographs of the DRN depicting ChR2 (green, left) with the enlarged pictures for the boxed area showing ChR2 expression (green, second subplot), GAD67+ (red, third subplot), and their co-localization with DAPI (right). c Example of the rank positions of a single cohort of mice tested daily over 7 days, indicating that the first-ranked mouse injected with the ChR2 virus fell to the third place following photostimulation. d Summary of rank changes in DRN-ChR2 mice before and after the optogenetic activation of DRN GABAergic neurons. Each line represents an individual animal. e No rank changes were observed in control mice before and after photostimulation. f Comparison of average rank changes in DRN-ChR2 mice following the optogenetic activation of DRN GABAergic neurons delivered throughout the tube test on Day 0 (Wilcoxon signed rank test; Day 0: Z6 = -2.640, p = 0.008; Day 1: Z6 = -2.070, p = 0.038; Day 2: Z6 = -1.633, p = 0.102; Day 3: Z6 = -1.633, p = 0.102). g Optogenetic activation of DRN GABAergic neurons significantly increased the number (Mann-Whitney U-test: U = 432, p = 0.038) and duration (U = 432, p = 0.039) of push-back, as well as the number (U = 223.5, p < 0.001) and duration (U = 362, p = 0.044) of stillness, and the percentage of time spent retreating (U = 60, p < 0.001). However, no significant differences were observed in the number (U = 445, p = 0.307) and duration (U = 415.5, p = 0.186) of push-initiation or the percentage of time spent resisting (U = 424, p = 0.108). “n” refers to the number of occurrences of the specific fine behaviors being measured. *p < 0.05, **p < 0.01, ***p < 0.001.
Fig. 3
Fig. 3. Chemogenetic activation of DRN GABAergic neurons resulted in a loss in both the tube test and the warm spot test.
a Schematic representation of the injection site in the DRN for the virus AAV2/9-GAD67-hM3D(Gq)-mCherry-WPRE. b Representative photomicrographs of the DRN depicting hM3Dq (red, left) with the enlarged pictures for the boxed area showing hM3Dq expression (red, second subplot), GAD67+ (green, third subplot), and their co-localization with DAPI (right). c Example of the ranking positions for a cage of mice tested daily over a period of 7 days, indicating that the first-ranked mouse injected with the hM3Dq virus was relegated to the last position at 6-8 h post-CNO injection. d Summary of rank changes in DRN-hM3Dq mice before and after CNO injection. Each line represents an individual animal. e Difference in average rank change for DRN-hM3Dq mice following CNO injection (Wilcoxon signed rank test; at 1-1.5 h: Z5 = -1.414, p = 0.157; at 3-5 h: Z5 = -2.646, p = 0.008; at 6-8 h: Z5 = -1.342, p = 0.180; at 24 h: Z5 = -1.342, p = 0.180; at 48 h: Z5 = -0.816, p = 0.414; at 72 h: Z5 = -0.816, p = 0.414). f Behavioral annotations of two tube test trials between the same pair of mice before and after CNO injection. g Chemogenetic activation of DRN GABAergic neurons significantly increased both the number (Mann-Whitney U-test: U = 90, p = 0.043) and duration (U = 86, p = 0.040) of stillness, as well as the percentage of time spent retreating (U = 2, p < 0.001). However, no significant changes were observed in the number (U = 129, p = 0.512) and duration (U = 142, p = 0.864) of push-initiation, the number (U = 134, p = 0.551) and duration (U = 133, p = 0.522) of push-back, or the percentage of time for resistance (U = 146, p = 0.968). “n” refers to the number of occurrences of the specific fine behaviors being measured. h Picture for the warm spot test, wherein four mice competed for occupancy of a warm corner situated on an ice-cold floor. i Duration of warm spot occupancy (top; One-way repeated measures ANOVA with Bonferroni correction: F2,18 = 0.142; p = 0.868; n = 10) and rank in the warm spot test (bottom; Friedman test with Wilcoxon signed-rank test for multiple comparisons: χ2 = 0.677; p = 0.717; n = 10) for DRN-hM3Dq mice are reported for 1 day before, 2 h after, and 2 days after saline injection. Each gray folded line represents an individual animal, while the colored line indicates the mean. Animals of the same rank are arranged in parallel to facilitate the presentation of results. j Duration of warm spot occupancy (top; F2,14 = 11.785; p = 0.007; n = 8) and rank in the warm spot test (bottom; χ2 = 8.538; p = 0.014; n = 8) for DRN-hM3Dq mice are presented for 1 day before, 2 h after, and 2 days after CNO injection. *p < 0.05, **p < 0.01, ***p < 0.001.
Fig. 4
Fig. 4. Optogenetic inhibition of DRN GABAergic neurons induced winning in the tube test.
a Schematic representation of the injection site in the DRN for the virus AAV2/9-GAD67-eNpHR3.0-EGFP-WPREs. b Representative photomicrographs of the DRN depicting eNpHR (green, left) with the enlarged pictures for the boxed area showing eNpHR expression (green, second subplot), GAD67+ (red, third subplot), and their co-localization with DAPI (right). c Example of the ranking positions of a cohort of mice tested daily over 7 days, demonstrating that the mouse initially ranked lowest, which received the eNpHR virus injection, subsequently ascended to the highest rank following photostimulation. d Summary of rank changes in DRN-eNpHR mice before and after photostimulation. Each line represents an individual animal. e No rank changes were observed in DRN-mCherry mice before and after photostimulation. f The average rank change for DRN-eNpHR mice following optogenetic inhibition of DRN GABAergic neurons, administered on Day 0 (Wilcoxon signed rank test; Day 0: Z6 = -2.636, p = 0.008; Day 1: Z6 = -1.414, p = 0.157; Day 2: Z6 = 0, p = 1; Day 3: Z6 = -1.732, p = 0.083). g Optogenetic inhibition of DRN GABAergic neurons significantly increased the number (Mann-Whitney U test: U = 301.5, p = 0.001) and duration (U = 166, p < 0.001) of stillness, along with the percentage of time dedicated retreat (U = 17, p < 0.001). In contrast, there were no significant changes observed in the number (U = 457, p = 0.168) and duration (U = 506.5, p = 0.463) of push-initiation, the number (U = 529.5, p = 0.520) and duration (U = 532, p = 0.551) of push-back, or the percentage of time spent in resistance (U = 428.5, p = 0.089). “n” refers to the number of occurrences of the specific fine behaviors being measured. **p < 0.01, ***p < 0.001.
Fig. 5
Fig. 5. Chemogenetic inhibition of DRN GABAergic neurons produced a win in both the tube test and the warm spot test.
a Schematic representation of the injection site in the DRN for the virus AAV2/9-GAD67-hM4D(Gi)-mCherry-WPREs. b Representative photomicrographs of the DRN depicting hM4Di (red, left) with the enlarged pictures for the boxed area showing hM4Di expression (red, second subplot), GAD67+ (green, third subplot), and their co-localization with DAPI (right). c Example of the ranking positions of a cohort of mice tested daily over 7 days, demonstrating that the last-ranked mouse injected with the hM4Di virus ascended to third place following CNO administration. d Summary of rank changes in DRN-hM4Di mice before and after CNO injection. Each line represents an individual animal. e Statistical analysis of mean rank change in DRN-hM4Di mice following CNO injection at 0 h (Wilcoxon Signed Rank Test; at 3-5 h: Z6 = -2.530, p = 0.011; at 6-8 h: Z6 = -2.070, p = 0.038). f Behavioral annotations of two tube test trials between the same pair of mice before and after CNO injection. g Chemogenetic inhibition of DRN GABAergic neurons significantly increased the number (Mann-Whitney U-test: U = 64.5, p < 0.001) and duration (U = 41.5, p < 0.001) of push-initiation, the number (U = 84, p < 0.001) and duration (U = 84, p < 0.001) of push-back, the percentage of time spent in resistance (U = 51, p < 0.001), and the number (U = 117, p = 0.011) but not the duration (U = 135, p = 0.050) of stillness. Moreover, the percentage of time spent in retreat was significantly decreased by chemogenetic inhibition (U = 18, p < 0.001). “n” refers to the number of occurrences of the specific fine behaviors being measured. h Duration of occupying the warm spot (left; one-way repeated measures ANOVA with Bonferroni correction: F2,14 = 0.769; p = 0.482; n = 8) and rank in the warm spot test (right; Friedman test with Wilcoxon signed-rank test for multiple comparison: χ2 = 0; p = 1; n = 8) for DRN-hM4Di mice assessed at 1 day before, 2 h after, and 2 days after saline injection. Each gray folded line represents an individual animal, while the colored line represents the average. Mice with the same rank are arranged in parallel to facilitate result presentation. i Duration of occupying the warm spot (left; F2,12 = 20.018; p < 0.001; n = 7) and rank in the warm spot test (right; χ2 = 9.579; p = 0.008; n = 7) for DRN-hM4Di mice at 1 day before, 2 h after, and 2 days after CNO injection. *p < 0.05, **p < 0.01, ***p < 0.001.

Similar articles

References

    1. Strauss, E. D., Curley, J. P., Shizuka, D. & Hobson, E. A. The centennial of the pecking order: current state and future prospects for the study of dominance hierarchies. Philos. Trans. R. Soc. B377, 20200432 (2022). - PMC - PubMed
    1. Yin, Y. Y. et al. The interaction between social hierarchy and depression/anxiety: Involvement of glutamatergic pyramidal neurons in the medial prefrontal cortex (mPFC). Neurobiol. Stress24, 100536 (2023). - PMC - PubMed
    1. Bartolomucci, A. et al. Social status in mice: Behavioral, endocrine and immune changes are context dependent. Physiol. Behav.73, 401–410 (2001). - PubMed
    1. Sandi, C. & Haller, J. Stress and the social brain: Behavioural effects and neurobiological mechanisms. Nat. Rev. Neurosci.16, 290–304 (2015). - PubMed
    1. LeClair, K. B. & Russo, S. J. Using social rank as the lens to focus on the neural circuitry driving stress coping styles. Curr. Opin. Neurobiol.68, 167–180 (2021). - PMC - PubMed

LinkOut - more resources