. 2025 Aug 5;8(1):1157.
doi: 10.1038/s42003-025-08573-z.

Profiling brain morphology for autism spectrum disorder with two cross-culture large-scale consortia

Collaborators, Affiliations

Profiling brain morphology for autism spectrum disorder with two cross-culture large-scale consortia

Xue-Ru Fan et al. Commun Biol. .

Abstract

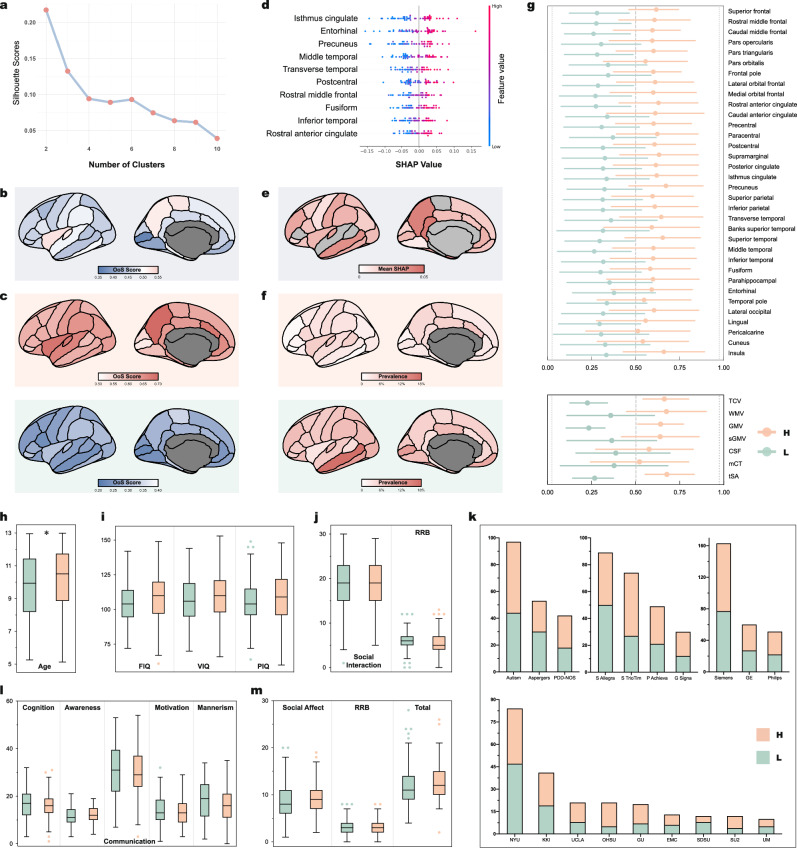
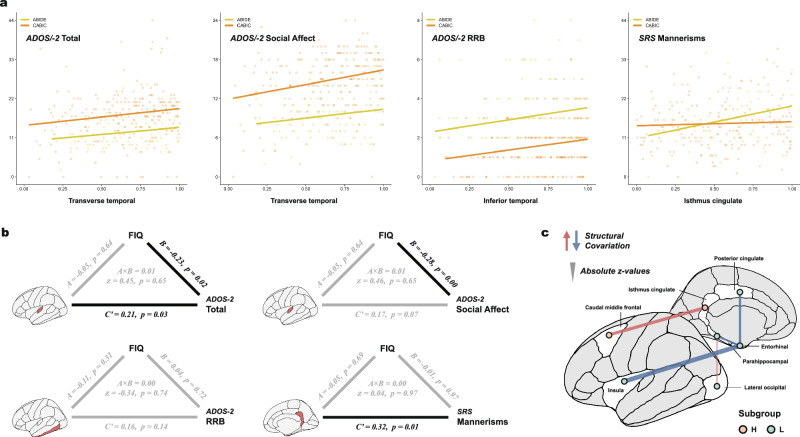
We explore neurodevelopmental heterogeneity in Autism Spectrum Disorder (ASD) through normative modeling of cross-cultural cohorts. By leveraging large-scale datasets from Autism Brain Imaging Data Exchange (ABIDE) and China Autism Brain Imaging Consortium (CABIC), our model identifies two ASD subgroups with distinct brain morphological abnormalities: subgroup "L" is characterized by generally smaller brain region volumes and higher rates of abnormality, while subgroup "H" exhibits larger volumes with less pronounced deviations in specific areas. Key areas, such as the isthmus cingulate and transverse temporal gyrus, were identified as critical for subgroup differentiation and ASD trait correlations. In subgroup H, the regional volume of the isthmus cingulate cortex showed a direct correlation with individuals' autistic mannerisms, potentially corresponding to its slower post-peak volumetric declines during development. These findings offer insights into the biological mechanisms underlying ASD and support the advancement of subgroup-driven precision clinical practices.


Conflict of interest statement

Competing interests: The authors declare no competing interests.

Figures

Fig. 1
Fig. 1. Clustering-derived subgroups reveal distinct brain morphological patterns in ASD from ABIDE dataset.
a Silhouette scores across different clustering solutions (2 to 10 clusters). The highest silhouette score indicates two distinct subgroups. b Median OoS scores of 34 cortical regions before clustering. c Median OoS scores of ASD subgroup H (top) and L (bottom). d SHAP summary plot displaying the top 10 brain regions with the highest contributions to the SVM model’s predictions. e The mean SHAP values across the 29 selected cortical regions contributed to the classification. f Prevalence maps depicting the proportion of participants with extreme (2.5% for subgroup L, 97.5% for subgroup H) structural anomalies. g OoS scores across 34 cortical regions (top) and global measures (bottom) for subgroup H (orange) and L (green). TCV total cortical volume, WMV total white matter volume, GMV total cortical gray matter volume, sGMV total subcortical gray matter volume, CSF total ventricular cerebrospinal fluid volume, mCT mean cortical thickness, tSA total surface area, Dots indicate the mean value of OoS scores, bars indicate the standard deviation. See Supplementary Information Supplementary Fig. 1b and Supplementary Fig. 1d for detailed density plots. Distribution of participant ages (h); IQ scales (i); ADI-R (j); PDD category (k, top left), MRI scanner model (k, top middle), manufacturer (k, top right), and data collection site (k, bottom); SRS (l); and ADOS (m) across the two subgroups, with subgroup L participants being significantly younger than those in subgroup H (p = 0.02). Note, the left hemispheres are plotted in (b, c, e, and f) just for visualization purposes. For plots h–j, l, and m, the center line shows the median; the box limits represent the 25th and 75th percentiles; the whiskers show the minimum and maximum values; and the dots represent potential outliers.
Fig. 2
Fig. 2. Brain-behavior correlations and structural covariations of Out-of-Sample scores.
a Reproducible correlations between brain region volumes, measured as Out-of-Sample (OoS) scores, and clinical measures across ABIDE and CABIC datasets (subgroup H only). b Mediation models for significant brain-behavior associations identified in subgroup H (ABIDE cohort only). Black solid arrows represent significant effects, while gray arrows indicate non-significant ones. Top: transverse temporal; bottom left: inferior temporal; bottom right: isthmus cingulate. c Significant structural covariations across ABIDE and CABIC datasets. Positive z-values (red lines) indicate stronger covariance in ASD participants compared to controls, while negative z-values (blue lines) reflect weaker covariance.
Fig. 3
Fig. 3. The theoretical brain functional network impairment model of two ASD subgroups.
a A brain map combining the 34 Desikan regions with the latest 15 large-scale brain functional networks estimated from individuals. a, precuneus; b, isthmus cingulate; c, entorhinal; d, middle temporal; e, inferior temporal gyrus; f, pericalcarine; g, frontal pole; h, caudal anterior cingulate; i, transverse temporal; and j, insula. b A schematic of the potential spatial distributions of distinct functional impairment networks inferred from 34 cortical regions with high abnormal prevalence for two subgroups. VIS Visual (C Central, P Peripheral), SMOT Somatomotor, AUD Auditory, dATN Dorsal Attention, PM-PPr Premotor-Posterior Parietal Rostral, AN Action-mode network, SAL/PMN Salience/Parietal Memory Network, FPN Frontoparietal Network, LANG Language, DN Default-mode Network.
Fig. 4
Fig. 4. General analytic flow in this study.
Brain charts pictures are updated from Bethlehem et al..

References

    1. Lord, C., Elsabbagh, M., Baird, G. & Veenstra-Vanderweele, J. Autism spectrum disorder. Lancet392, 508–520 (2018). - PMC - PubMed
    1. Hirota, T. & King, B. H. Autism spectrum disorder a review. JAMA329, 157–168 (2023). - PubMed
    1. Zeidan, J. et al. Global prevalence of autism: A systematic review update. Autism Res.15, 778–790 (2022). - PMC - PubMed
    1. Maenner, M. J. et al. Prevalence and characteristics of autism spectrum disorder among children aged 8 years - autism and developmental disabilities monitoring network, 11 Sites, United States, 2020. MMWR Surveill. Summaries72, 1–14 (2023). - PMC - PubMed
    1. Zhou, H. et al. Prevalence of autism spectrum disorder in China: A nationwide multi-center population-based study among children aged 6 to 12 years. Neurosci. Bull.36, 961–971 (2020). - PMC - PubMed