. 2025 Sep;24(9):1465-1475.
doi: 10.1038/s41563-025-02300-z. Epub 2025 Aug 5.

Adaptive peptide dispersions enable drying-induced biomolecule encapsulation

Affiliations

Adaptive peptide dispersions enable drying-induced biomolecule encapsulation

Dhwanit R Dave et al. Nat Mater. 2025 Sep.

Abstract

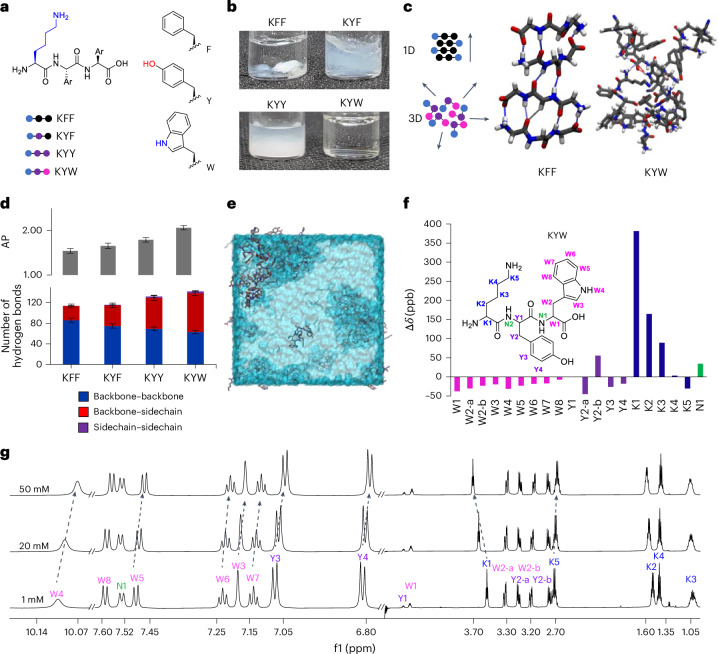
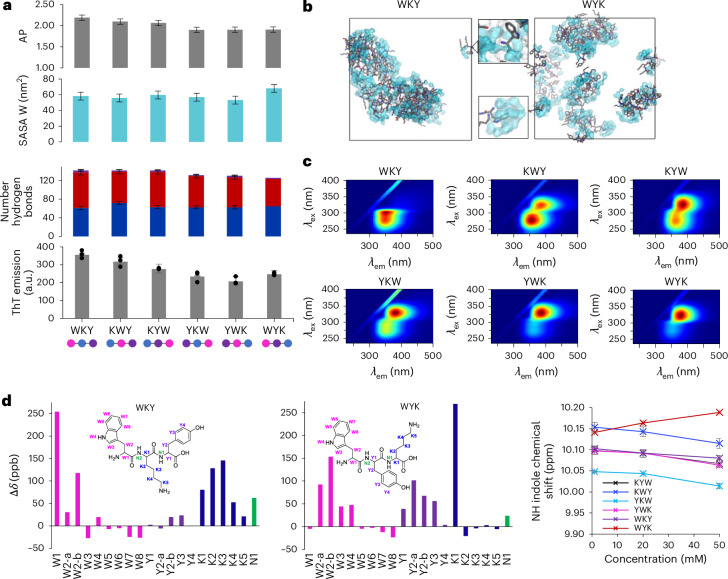
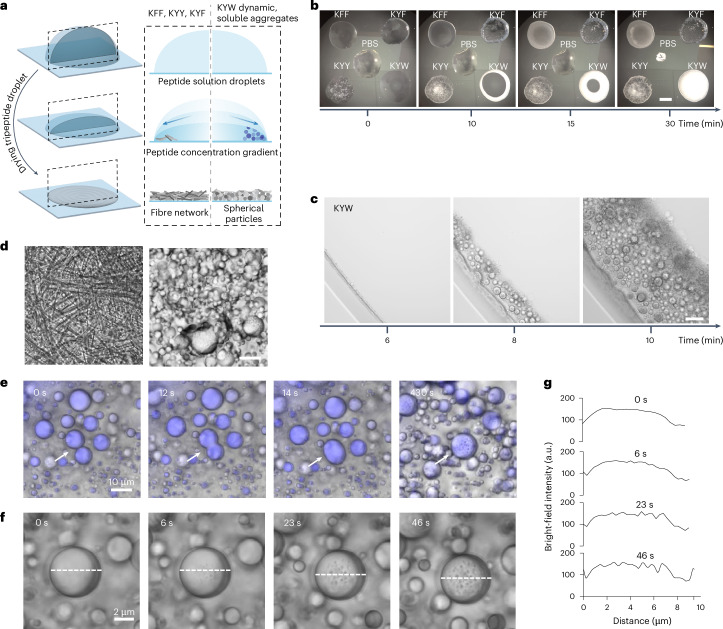
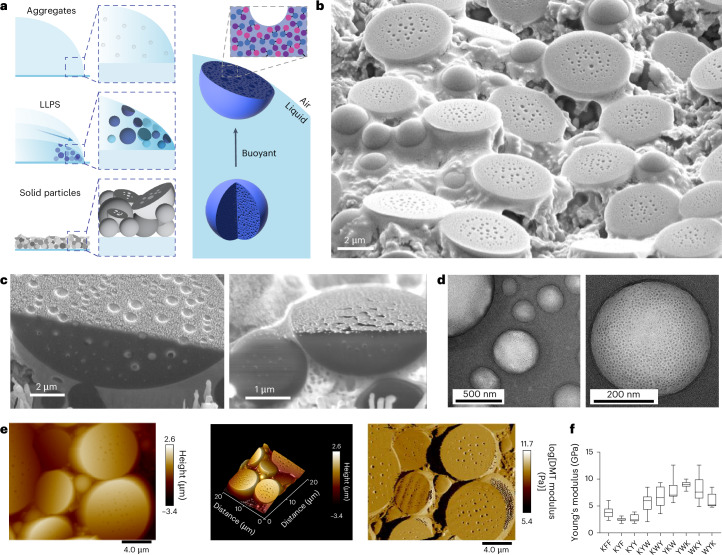
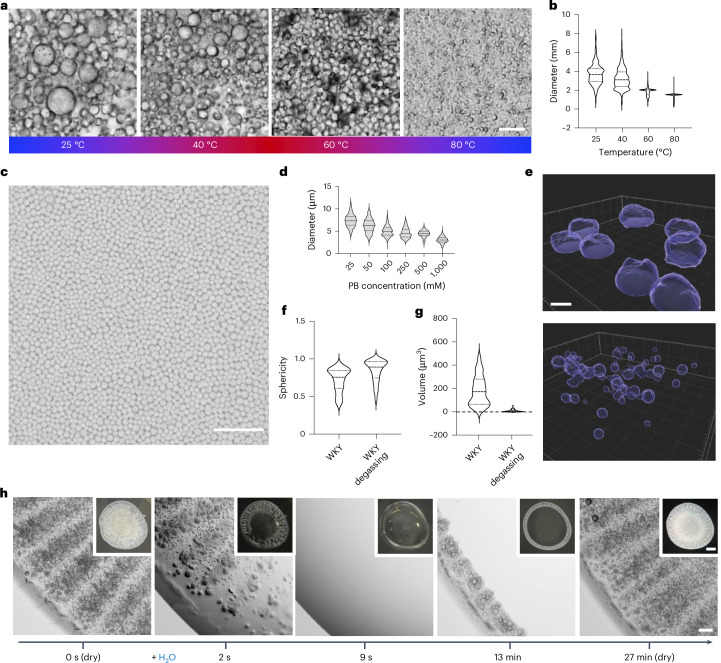
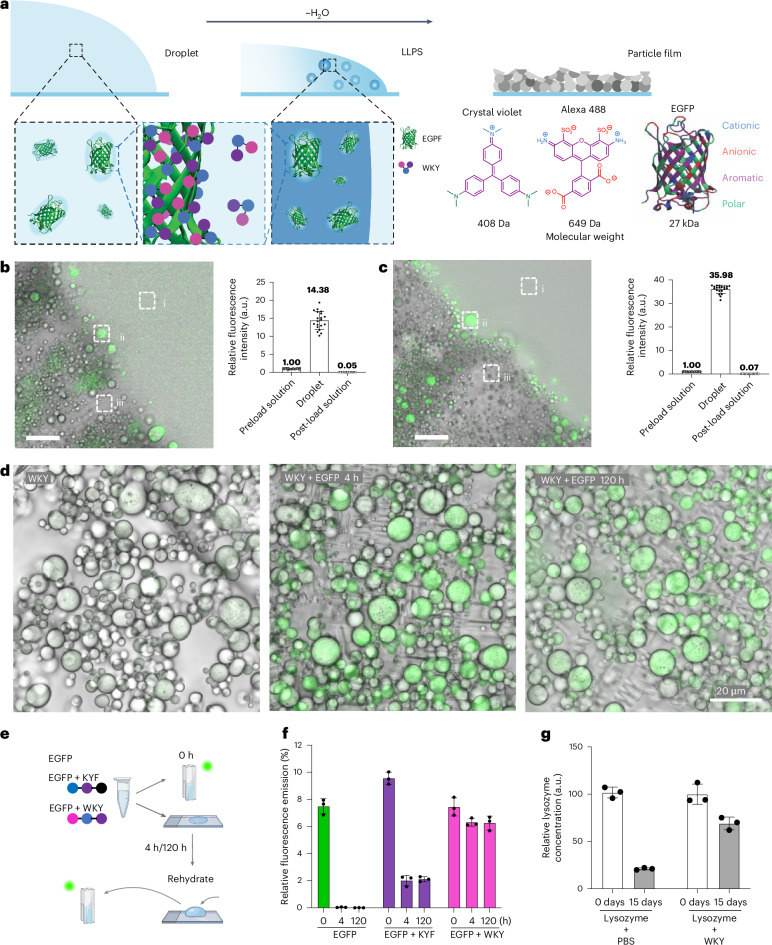
Peptides are promising building blocks of designer materials with wide-ranging applications. These materials are stabilized by directional hydrogen-bonding patterns, giving rise to one-dimensional or two-dimensional assembly. It remains a challenge to mimic biology's context-adaptive and flexible structures. Here we introduce minimalistic tripeptide sequences that form highly soluble dynamic ensembles through multivalent side-chain interactions. We observe these supramolecular dispersions undergo drying-induced sequential liquid-liquid phase separation followed by solidification, resulting in the formation of films of stiff, densely packed and porous peptide microparticles that can be instantaneously redispersed upon the re-introduction of water. Air-drying of peptide dispersions in the presence of proteins or small-molecule payloads results in efficient encapsulation and the retention of protein stability after redispersion, showing promise for the emulsification, encapsulation, protection and storage of biomacromolecules. The mechanism resembles the protective strategies in natural systems during desiccation, which rely on liquid-liquid phase separation to survive extreme conditions.


Conflict of interest statement

Competing interests: R.V.U., Y.H., M.C., L.X., D.R.D., S.K. and M.T.-N. have submitted a patent application related to the phase separation, encapsulation and preservation technology described in this work. R.V.U. and M.C. are cofounders of BioWraptor, a company with a potential interest in licensing this technology.

Figures

Fig. 1
Fig. 1. Directionality and dispersibility in peptide self-assembly.
a, Chemical structures of tripeptides KFF, KYF, KYY and KYW. b, Macroscopic images of KFF, KYF, KYY and KYW peptides at 20 mM in phosphate buffer (PB) at pH 7.5. c, Selected snapshots of simulations for KFF (only backbone shown for clarity) and KYW, with predominant hydrogen-bond interactions highlighted. d, Sequence-dependent AP = SASAinitial/SASAequil (top) and distribution of hydrogen-bond interactions (bottom) between simulated peptides from MD trajectories for KFF, KYF, KYY and KYW. The backbone and side chain indicate the directionality of the self-assembly. Average and s.d. error bars were measured from three replicate simulations using 250 data points (the last 50 ns) of each analysis set. e, Snapshot from MD trajectory of KYW showing assembly inside a water box. f, Chemical shift perturbation (Δδ in parts per billion) for KYW between 50 mM and 1 mM concentrations. This figure highlights the evolving chemical environment for each KYW’s protons (colour-coded accordingly) during concentration-driven assembly. Downfield shifts are represented as positive values and upfield shifts as negative values, reflecting the strengthening or weakening of hydrogen bonding and π-type interactions, respectively. Each bar represents the average of three independent experiments, with s.d. error bars from three replicates. g, The 1H NMR spectra of KYW at concentrations of 1 mM, 20 mM and 50 mM in 99:1 D2O/H2O with 100 mM Na/PB at pH 7.5, illustrating concentration-dependent shifts in f1 (frequencies) that reveal key interactions in the formation of dynamic soluble ensembles. Source data
Fig. 2
Fig. 2. Sequence dependence in tripeptide dispersions.
a, From top to bottom, the AP score, tryptophan SASA and hydrogen-bonding interaction distribution analyses for K/Y/W sequence isomer MD trajectories. Averages and s.d. error bars were measured from three replicate simulations using 250 data points (last 50 ns) of each analysis set. Below is the ThT fluorescence emission intensity (50 µM) in the presence of peptide at 20 mM. Averages and s.d. error bars from three replicates. Data represent mean ± s.d. (n = 3). b, Snapshots for WKY and WYK showing non-directional self-assembly resulting in differential tryptophan environments and water binding (shown in blue) with zoomed-in areas showing a dry (top) and water-bound (bottom) tryptophan. c, The 3D fluorescence spectra showing the differential polarity and water interactions of tryptophan residues in solution. λem, emission wavelength. d, Chemical shift perturbation (Δδ in parts per billion) for WKY and WYK between concentrations of 50 mM and 1 mM. Each plot corresponds to a different sequence, with downfield shifts represented as positive values and upfield shifts as negative values. Each bar represents the average of three independent experiments, with s.d. error bars from three replicates. e, Concentration-dependent chemical shifts of the indole NH proton in K/Y/W sequence isomers, highlighting variations in the chemical environment and intermolecular interactions as concentration increases (1, 20 and 50 mM). Averages and s.d. error bars from triplicates. Source data
Fig. 3
Fig. 3. Evaporation-driven assembly.
a, Representation of evaporation-driven self-assembly in sessile droplets. b, Evaporation patterns over time, with the differential assembly of KYW clearly visible. Scale bar, 1 mm. PBS, phosphate-buffered saline. c, Microscopy time course for evaporation-driven assembly of KYW. Scale bar, 50 µm. d, Bright-field microscopy images showing 1D assembly for KYY (left) and the formation of spherical particles upon drying for KYW (right). Scale bar, 10 µm. e, The dynamic droplet fusion process of WKY is recorded by time-lapse confocal microscopy. From 0 s to 14 s, a transient fusion of two liquid–liquid phase separation droplets is seen. By 430 s, the rigidification of the droplets and appearance of pores on the surface are seen. f,g, Time-lapse confocal analysis (f) revealed the onset of pore formation upon solidification. The moment that the droplet stationized was set as 0 s. The spectrum of bright-field images across the particle (white dashed lines) during the solidification process were profiled (g) for quantitative visualization. Source data
Fig. 4
Fig. 4. Formation of buoyant droplets and porous particles.
a, Schematic representation of evaporation-driven assembly of buoyant liquid droplets that settle at the droplet interface and, upon drying, form half-dome-shaped particles. LLPS, liquid–liquid phase separation. b, SEM image showing a mixture of porous spheres and half-dome particles at the interface and also showing surface pores. c, FIB-SEM analysis confirming the half-dome shape and revealing the porous structure inside the dried particles. Note that the fine granular structures on the surface are from sputter-coated gold. d, TEM analysis of glutaraldehyde-crosslinked dissociated KWY particles reveals that non-surface particles are highly porous spheres. e, AFM analysis showing porous half-dome particles. f, The plot of Young’s modulus showing the stiffness of fibres or particles formed by the indicated peptides. A total of 15–36 particles or fibres were profiled for each sequence. In the box plots, the centre line shows the median, the box edges delineate the first and third quartiles and the whiskers show the range of values. Source data
Fig. 5
Fig. 5. Size control, shape control and reversibility.
a,b, Temperature dictates the size distribution of the dried peptide particles. KWY shows a reduction in particle size and more homogeneous size distribution as temperature increases during evaporation. Scale bar, 10 µm. A total of 368–1,456 particles at each temperature were analysed. c, The 20 mM WKY peptide was dissolved in Na/PB at concentrations of 25, 50, 100, 250, 500 and 1,000 mM. A bright-field image of dried WKY in 500 mM PB is shown. Scale bar, 50 µm. d, Plot of 296–662 Imaris-3D-rendered particles at each concentration demonstrates the reduction in particle size and increase in homogeneity with the increase of salt concentration. eg, The peptide solution was degassed, followed by the evaporation assay; the example of WKY is shown (e). Imaris 3D rendering demonstrated a reduction in particle size and increase in sphericity, as plotted in f and g, respectively. Scale bar, 5 µm. h, Fully reversible formation of porous peptide particles upon addition of water and re-evaporation. Representative time-lapse images of KWY are shown. Scale bar, 50 µm. The macroscopic images of 5 µl peptide solution drops at each stage are shown in the insets. Scale bar in the insert, 500 µm. In the violin plots, the horizontal lines show the median as well as the 25th and 75th percentiles. Source data
Fig. 6
Fig. 6. Drying-induced encapsulation and protection.
a, Proposed mechanism for payload uptake involving dynamic complexation of payload molecules through dynamic side-chain interactions, followed by the molecules being surrounded to form droplets upon liquid–liquid phase separation. b, Confocal live imaging (left) of KWY peptide particles incorporating Alexa 488 shows efficient enrichment of the dye in peptide droplets. Scale bar, 20 µm. Fluorescence intensity analysis (right) of the preload solution (i), the droplet (ii) and the post-load solution (iii) at the frontier of emulsification. A total of 20 regions of interest of each group from six time-lapse frames were quantified, and the average intensity of the preload solution was set as 100 arbitrarily. Data represent mean ± s.d. (n = 20). Error bars represent s.d. c, Encapsulation assay of the EGFP protein by the WKY peptide was performed as described in b. Data represent mean ± s.d. (n = 20). d, Confocal and bright-field imaging of dried peptide particles reveal that the green fluorescence signals of EGFP remain in WKY peptide particles under ambient conditions for five days after solidification. e,f, Experiment to test the storage and redispersion ability of WKY with a schematic representation (e) of the experiment and the fluorescence emission at 510 nm (λex = 488 nm) of the corresponding solution (EGFP, EGFP + KYF and EGFP + WKY) over time (f). Data represent mean ± s.d. (n = 3). Error bars represent s.d. from three replicate experiments. g, The amount of reactive lysozyme in the dried particles with PBS or WKY at day 0 and day 15 under ambient conditions were measured by enzyme-linked immunosorbent assay (ELISA). Data represent mean ± s.d. (n = 3). Source data
Extended Data Fig. 1
Extended Data Fig. 1. Chemical shift for each proton in various peptide sequence isomers.
Chemical shift perturbation (Δδ in ppb) between 50 mM and 1 mM concentrations for each proton in various peptide sequence isomers. Each plot corresponds to a different sequence, with downfield shifts represented as positive values and upfield shifts as negative values. Each bar represents the average of three independent experiments, with s.d. error bars from 3 replicates. Source data
Extended Data Fig. 2
Extended Data Fig. 2. Spherical particles upon drying.
a.Bright field microscopy images showing formation of spherical particles upon drying for KYW, KWY, YKW, YWK, WKY, and WYK. Scale bar = 10 µm; b. Bright field microscopy images of the time course of KWY, WKY, WYK, YWK and YKW evaporation process; c-f. Streaks formation during the evaporation-driven peptide solution drying. The moving tracks of the KYW droplets during the drying process were reconstructed using Imaris; d-e. based on the timelapsing confocal images. (a). The sum of the tracks in (e) shows the streaks formed at the edge as observed in (f). Scale bar, 50 µm in c, d, e and 500 µm in f. Color scale bar in (e) represents time. Source data
Extended Data Fig. 3
Extended Data Fig. 3. Cryo-EM micrographs of early stages of drying-induced assembly.
a. Drop of 2 µl WYK solution was applied onto the TEM grid and went through evaporation under ambient conditions for indicated time and proceeded with cryo-EM. Cryo-EM images illustrate the structural transformations from random aggregates and short fibers to spherical assemblies. Scale bar = 500 nm; b. Cryo-EM micrographs of different resolutions captured at 5’03” show the process of evaporation-driven porous droplet formation, and the temporal information could be decoded from spatial information; c. Different stages of the assembly process are captured. 1. early stage formation of nanosized spherical assembly; 2-4. nano-sized air pockets inside spherical peptide assemblies; 5-7. larger spheres with multiple pores; 8. fusion of larger spheres with multiple pores. Scale bar = 200 nm. Source data
Extended Data Fig. 4
Extended Data Fig. 4. SEM and AFM micrographs of KFF, KYF, KYY, KYW, KWY, YKW, YWK, WKY, WYK.
The first column shows SEM images of all nine tripeptides. KFF, KYF and KYY show similar linear fiber-like structures. The other six tripeptides show sphere structures of various sizes, each of such spheres containing hollow bubbles. The second, third, and forth columns show the height, 3D topography, and stiffness (Young’s Modulus) AFM images. Source data
Extended Data Fig. 5
Extended Data Fig. 5. Control of particle size and shape.
a. The effect of temperature on the size of porous peptide particles formed by tripeptides, and KWY was shown. For Imaris 3D Rendering, traceable blue fluorescence signals excited by 405 nm were captured by confocal coupling with bright-field imaging. Spot rendering was employed to analyze the diameter of the particle; b. while the actual shape was revealed by surface rendering in high transparency mode; c-d. The Sphericity of approximately 200 particles at 40 °C and 1000 particles at 80 °C were profiled, indicating that at high temperature, droplets are not given sufficient time to accumulate at the interface and consequently remain rounded. In violin plot, the horizontal lines display the median as well as 25th and 75th percentiles.); e. Buffer concentration regulates the dynamics of tripeptide particle formation. 20 mM WKY peptide was dissolved in phosphate buffer at the concentrations of 25, 50, 100, 250, 500, 1000 mM. Imaris 3D rendering of the dried particles at each concentration demonstrated reduction in particle size and increase in homogeneity with the increase of salt concentration. Color scale bar represents size, scale bar = 10 µm; f. The peptide solution was degassed followed by evaporation assay, and the example of WKY is shown. Time-lapse confocal imaging of bright field and 405 nm excitation demonstrated reduction in particle size. Scale bar = 50 µm; g. Further AFM analysis of WKY shows fewer and smaller pores in the dried particles of the degassed sample. Source data
Extended Data Fig. 6
Extended Data Fig. 6. Dye encapsulation.
a-b Tryptophan fluorescence spectra of WKY (20 mM in 100 mM PB pH 7.5) in the absence and presence of dye at increasing concentrations (10 µM, 100 µM, 500 µM): (a) Alexa 488, (b) Crystal Violet. c. Confocal live imaging of WKY peptide particles incorporating crystal violet shows substantial enrichment of the dye in peptide droplets, and the dried particles post-encapsulation were shown in d. Scale bar = 50 µm. e. Fluorescence intensity analysis of the pre-load solution, the peptide droplet, and the post-load solution at the frontier of emulsification. A total of 20 regions of interest of each group from 6 time-lapse frames were quantified, and the average intensity of pre-load solution was set as 1 arbitrarily. Error bar represents s.d.
Extended Data Fig. 7
Extended Data Fig. 7. Uniform Alexa 488 and EGFP encapsulation across all six K/Y/W sequence isomers.
The six sequence isomers of KYW, KWY, YKW, YWK, WKY, WYK demonstrated comparable encapsulation efficiency for both Alexa 488 dye; (a) and EGFP protein (c) analyzed using confocal microscopy. Scale bar = 10 µm. The quantification of green fluorescence intensity in 10 dried particles of Alexa 488 (b) and EGFP (d) were plotted. In box plots, the centre line shows the median, box edges delineate first and third quartiles, and whiskers show the range of values.
Extended Data Fig. 8
Extended Data Fig. 8. Proteins encapsulation.
Encapsulation of GFP with varied net charge. a. Engineered GFP proteins with net charge of −30, −18, 0, and +18 were pre-mixed with WKY solution individually followed by evaporation assay. b. The green fluorescence intensity of around 150 dried particles were profiled using confocal microscopy. c. The fluorescence intensity of the starting WKY + GFP mixture solution, which accounts for the variation in intrinsic fluorescence among this array of GFP proteins, were also measured and were used to normalize the raw green fluorescence intensity measured in b; d. The adjusted fluorescence intensity indicates greater encapsulation capacity with GFPs of higher charge, either positive or negative; e. Simultaneous encapsulation by tripeptide. Three fluorescent proteins of different colors and charges: miRFP682 (-6) (magenta), mScarlet-l (+5) (red) and GFP (0) (green) were pre-mixed with WKY solution together followed by evaporation assay; f. The fluorescence intensity of 30 dried particles were profiled using confocal microscopy with excitation at 633 nm, 561 nm, 488 nm laser respectively on both day 0 and day 6 under ambient conditions. Data represent mean ± s.d.
Extended Data Fig. 9
Extended Data Fig. 9. Scale up assays.
a. The volume of 20 µl WKY peptide solution was used and three different approaches were tested for scale up assays. While heating up the solution or vacuum condition could accelerate the drying process noticeably, the spray assay achieves the highest efficiency; b. Scheme of HXT M5 sprayer setup to spray large volume (20 µl) of WKY peptide solution into small drops onto microscope slides. Scale bar = 1 mm; c. Tested 80 µl/min spray rate achieved the best retention of micro-drop morphology, resulting in variable droplet sizes from tens to hundreds of microns. Scale bar = 50 µm; d. Further inspection by confocal microscopy demonstrated comparable particle formation with smaller size within sprayed micro-droplets, and (e) revealed efficient encapsulation of EGFP in this system. Scale bar = 10 µm.

References

    1. Aida, T., Meijer, E. W. & Stupp, S. I. Functional supramolecular polymers. Science335, 813–818 (2012). - PMC - PubMed
    1. Zhang, S. Fabrication of novel biomaterials through molecular self-assembly. Nat. Biotechnol.21, 1171–1178 (2003). - PubMed
    1. Ghadiri, M. R., Granja, J. R., Milligan, R. A., McRee, D. E. & Khazanovich, N. Correction: self-assembling organic nanotubes based on a cyclic peptide architecture. Nature366, 324–327 (1993). - PubMed
    1. Freeman, R. et al. Reversible self-assembly of superstructured networks. Science362, 808–813 (2018). - PMC - PubMed
    1. Kaygisiz, K. et al. Context dependence in assembly code for supramolecular peptide materials and systems. Nat. Rev. Mater.10, 449–472 (2025).

LinkOut - more resources