. 2025 Aug 5;22(1):199.
doi: 10.1186/s12974-025-03520-5.

Mitigating organophosphate nerve agent, soman (GD), induced long-term neurotoxicity: Saracatinib, a Src Tyrosine Kinase inhibitor, as a potential countermeasure

Affiliations

Mitigating organophosphate nerve agent, soman (GD), induced long-term neurotoxicity: Saracatinib, a Src Tyrosine Kinase inhibitor, as a potential countermeasure

Nyzil Massey et al. J Neuroinflammation. .

Abstract

Background: Acute exposure to soman (GD), an organophosphate nerve agent (OPNA), irreversibly inhibits acetylcholinesterase (AChE), induces seizures, and could be fatal if not treated immediately. Existing medical countermeasures (MCMs- atropine, oximes, and benzodiazepines) mitigate the acute life-threatening cholinergic symptoms but have limited protection against long-term neurological consequences in survivors. This indicates a need for an effective adjunct therapy to mitigate cognitive, behavioral, and brain pathology associated with OPNA exposure. Saracatinib (SAR), a selective Src tyrosine kinase inhibitor, has emerged as a potential candidate, given its protective properties in experimental models of excitotoxicity and neuroinflammation. Here, we evaluate the therapeutic efficacy of SAR in mitigating long-term neurological deficits triggered by acute exposure to soman in a rat model.

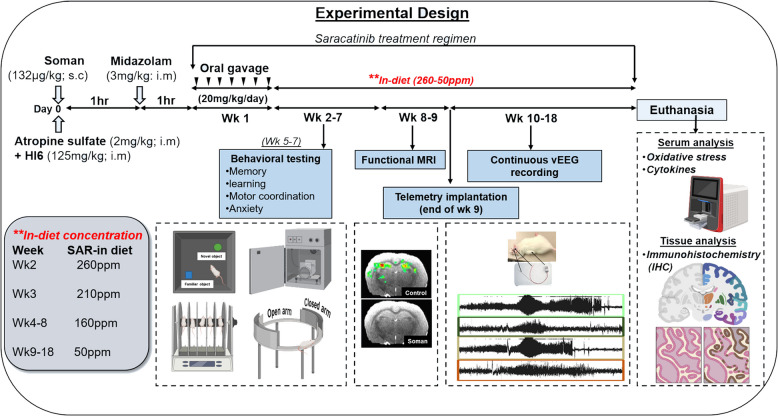
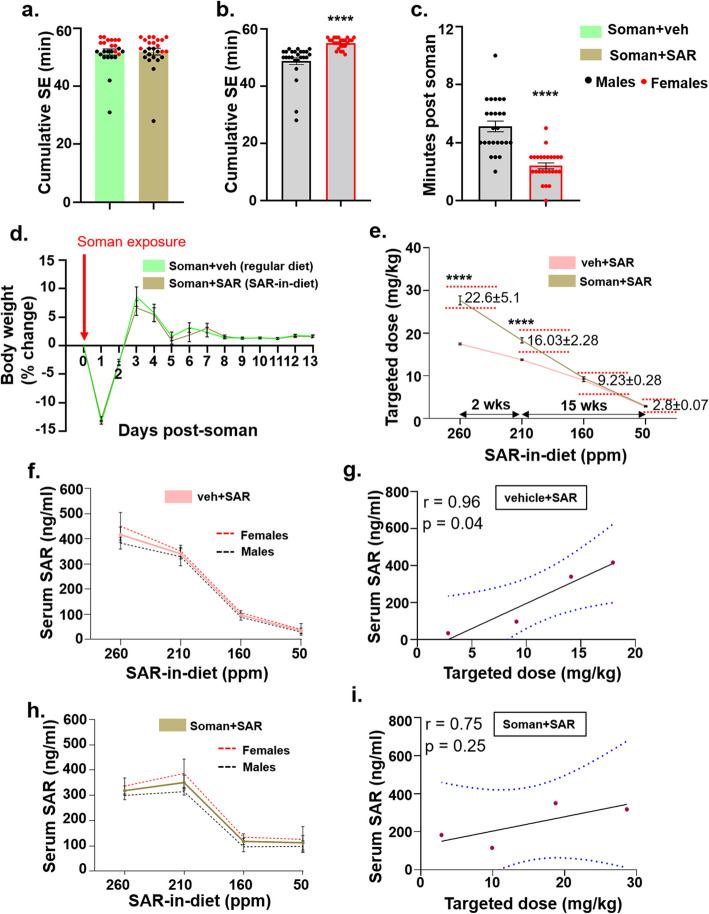
Methods: Mixed-sex adult Sprague Dawley rats were exposed to soman (132 μg/kg, s.c.) and immediately treated with atropine (2 mg/kg, i.m.) and HI-6 (125 mg/kg, i.m.). Seizure severity was quantified for an hour before administering midazolam (3 mg/kg, i.m.). One-hour post-midazolam, SAR/vehicle was administered orally for a week and in the diet for 17 weeks. After behavioral testing, brain MRI, and EEG acquisition, animals were perfused with 4% paraformaldehyde 18 weeks post-soman. Serum and cerebrospinal fluid were collected for nitrooxidative markers and proinflammatory cytokine. Brains were processed for neuroinflammation and neurodegeneration markers.

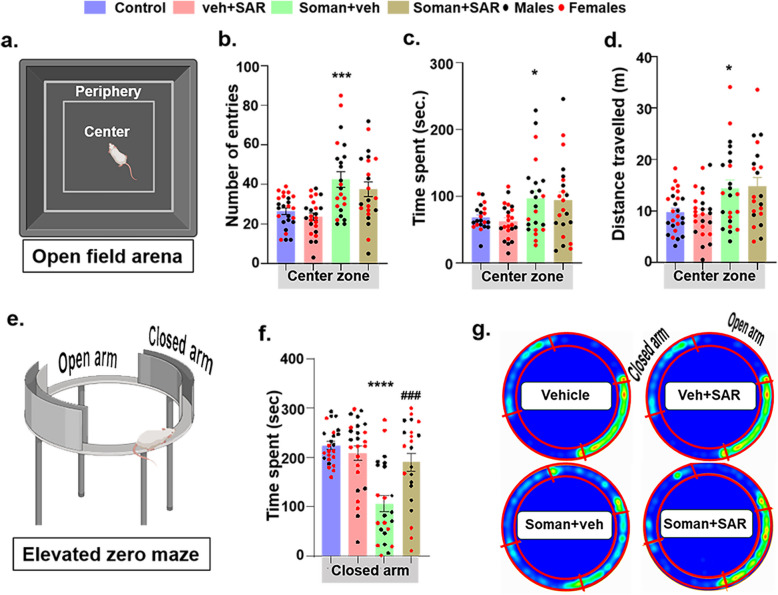
Results: SAR treatment attenuated the soman-induced anxiety/fear-like behavioral changes and motor impairment and modulated the severity of spontaneous seizures. Despite improved hippocampal functional connectivity (fMRI), SAR did not mitigate soman-induced cognitive deficits at 5-7 weeks. However, 18 weeks of SAR treatment demonstrated anti-inflammatory and antioxidant properties, mitigated reactive gliosis and neurodegeneration, and protected somatostatin inhibitory neurons. The glial scars in the amygdala were reduced in SAR-treated animals compared to the vehicle-treated group.

Conclusions: Long-term SAR treatment revealed disease-modifying effects by protecting the brain from soman induced neuroinflammation and neurodegeneration, while also reducing severity of spontaneous seizures. Furthermore, SAR mitigated some soman induced behavioral impairments and brain MRI. These findings highlight the therapeutic potential of Src tyrosine kinase inhibition in soman-induced chronic neurotoxicity.

Keywords: Epilepsy; Glial scar; Neurobehavior; Neuroinflammation; Neurotoxicity; Nitro-oxidative stress; Organophosphate nerve agents; Saracatinib; Soman (GD).


Conflict of interest statement

Declarations. Ethics approval and consent to participate: The experiments were conducted per the approved protocols by the Institutional Animal Care and Use Committees (IACUC protocol: 23–114) and complied with the NIH ARRIVE Guidelines for the Care and Use of Laboratory Animals. Consent for publication: All authors agreed to publish. Competing interests: The authors declare no competing interests.

Figures

Fig. 1
Fig. 1
Experimental design. The 18-week study illustrating various treatments, analyses in live animals, and sample collection after euthanasia
Fig. 2
Fig. 2
Development of SE and body weight recovery after acute soman exposure, and a correlational analysis between SAR-in-diet and serum SAR concentrations. Following acute soman exposure, rats were observed, and the initial SE severity was quantified. SE severity (minutes of convulsive seizures between soman exposure and midazolam treatment) is shown in both treatment groups as a mixed sex cohort (a) or as separate sexes (b). The SE severity grouping and comparison (in panel ‘a’) was done before the animals were coded/blinded and treated with SAR or vehicle. c Latency to the first convulsive seizure in all males and females after soman exposure is shown. d Body weight gain progression in rats following soman exposure (day 0) fed the diet with or without SAR is shown. e A comparative analysis of targeted SAR dose (mg/kg) achieved was based on SAR-in-diet consumption shown in different groups as mixed-sex cohorts. Frequent blood collection (retro-orbital) was performed to estimate serum SAR concentrations by LC–MS/MS. f-i Serum SAR concentrations (ng/ml), estimated by LC–MS/MS, compared with SAR-in-diet concentrations (ppm) in vehicle (f) and soman-exposed (h) animals, and their correlation analyses (g, i), respectively. Normality of the data was assessed with the Shapiro–Wilk test. Bars represent mean ± SEM, and each dot on the bar graphs represents a data point for each animal. f-i n = 25 (12–13/sex) (a-e) & n = 9–10 (4–5/sex). b ****p < 0.0001 by Unpaired t-test, (e) ****p < 0.0001 by two‐way ANOVA with Tukey’s multiple comparisons & (g) *p < 0.05, by Pearson correlation analysis. No sex differences were observed (except b and c), and the data from both sexes were pooled
Fig. 3
Fig. 3
Anxiety and exploratory behaviors (risk assessment) in rats at 5–6 weeks following soman exposure and the effects of SAR treatment. Results from the (a) open field test and (e) elevated zero maze at 5–6 weeks post-soman are presented. b-d The results from the open field test are plotted as the number of entries, the time spent, and the distance traveled in the central zone. f The quantified results from the elevated zero maze are plotted as the time spent in the closed arm. (g) Representative heatmaps of the time spent in each zone are shown. Normality was assessed with the Shapiro–Wilk test. *indicates the soman effect (soman vs control) and # represents SAR effect (soman + SAR vs soman + vehicle). Bars represent mean ± SEM, and each dot on the bar graphs represents a data point for each animal. n = 22–25 (10–13/sex). *p < 0.05, ***p < 0.001, ****p < 0.0001, and ####p < 0.0001 by two‐way ANOVA with Tukey’s multiple comparisons. No sex differences were observed; therefore, data from males and females were pooled. Created in BioRender. Thippeswamy, T. (2025) https://BioRender.com/i2psy97
Fig. 4
Fig. 4
Recognition memory profile in rats following soman exposure and the effects of SAR treatment. a An open field arena with objects of different shapes and colors was used to test the recognition memory in rats at 5–6 weeks post-soman. b-d The results are plotted as the time spent with the novel object, discrimination index, and recognition index. e Representative heatmaps of time spent in the arena. Normality was assessed with the Shapiro–Wilk test. The stars indicate soman effect (soman vs control). Bars represent mean ± SEM, and each dot on the bar graphs represents a data point for each animal. n = 22–25 (10–13/sex). **p < 0.01, and ****p < 0.0001 by two‐way ANOVA with Tukey’s multiple comparisons. No sex differences were observed; therefore, the data from males and females were pooled. Created in BioRender. Thippeswamy, T. (2025) https://BioRender.com/jw5fovv
Fig. 5
Fig. 5
Motor behavior and contextual memory profiles after soman exposure and the effects of SAR treatment. a Rotarod test was used to analyze the motor behavior in rats at 6–7 weeks post-soman exposure. b Results from different treatment groups are plotted as latency to fall, which is the time the rat takes to fall from an accelerating rotating rod. c Fear conditioning test was carried out to examine contextual memory in rats. The experimental paradigm for the test is illustrated in panel ‘d’. On day 1, animals were conditioned with four consecutive 20 s tones (T1-T4), each with an 80 s interval between trials. f On the test day 2, after habituation, all four tones were repeated with similar intervals but without electric shock. eg The data from the conditioning and testing/probe sessions are plotted as freezing duration (in seconds) for each animal during the 20-s tone. The results were analyzed as the percent change in freezing time from day 1 to day 2 for each tone, and the average percent change was calculated for each animal. Normality was assessed with the Shapiro–Wilk test. The stars indicate soman effect (soman vs control) and # represents SAR effect (soman + SAR vs. Soman + vehicle). Bars represent mean ± SEM and each dot on the bar graphs represents a data point for each animal. b n = 22–25 (10–13/sex). ****p < 0.0001, and ####p < 0.0001 by two‐way ANOVA with Tukey’s multiple comparisons. f-g *p < 0.05, **p < 0.01, and ***p < 0.001 by two‐way ANOVA with Tukey’s multiple comparisons. No sex differences were observed; therefore, the data from males and females were pooled. Created in BioRender. Thippeswamy, T. (2025) https://BioRender.com/4fbwf49
Fig. 6
Fig. 6
SAR treatment restored the hippocampal functional connectivity, measured by resting state fMRI, and prevented neurodegeneration induced by soman exposure. a Resting state functional connectivity (rsFC) of the hippocampal network, measured by fMRI, is presented as color overlay activation maps across each experimental group along with the anatomical MRI underlay (the scale bar represents the correlation strength of the active voxels with the hippocampal seed region). b The number of active voxels in the hippocampal functional connectivity map derived from each animal is displayed in different treatment groups. Correlation analyses between hippocampal fMRI and fear conditioning (c) and the zero maze (d) are shown as Pearson correlation coefficient ‘r’ with a corresponding p-value for each graph. e Representative immunohistochemistry (IHC) images from the hippocampus with FJB-positive cells (green/yellow, degenerating neuronal marker) and NeuN (red, neuronal marker) are shown. f-i Quantification of FJB & NeuN positive cells from the hippocampus, thalamus, cortex, and amygdala. *indicates soman effect (soman vs control) and # represents SAR effect (soman + SAR vs Soman + vehicle). Normality was assessed with the Shapiro–Wilk test. Bars represent mean ± SEM, and each dot on the bar graphs represents a data point for each animal. a The color of the voxels represents the correlation strength of that voxel with the location. a-b n = 8–16 (4–8/sex) *p < 0.05 by two-way ANOVA with Tukey’s multiple comparisons. e-i n = 10 (5/sex). */#p < 0.05, **/##p < 0.01, ***/###p < 0.001, ****/.####p < 0.0001 by two-way ANOVA (mixed effects model) with Tukey’s multiple comparisons, scalebar = 100 μm. No sex differences were observed; therefore, the data were pooled. Individual analysis from Dentate gyrus + Hilus (DG + H), CA1, CA3, Subiculum (SUB), medial dorsal thalamus (MDT), motor cortex (MC), Somatosensory cortex (SSC), and Piriform Cortex (PC) can be found in Supplementary Fig. 3. Created in BioRender. Thippeswamy, T. (2025) https://BioRender.com/2coee0a
Fig. 7
Fig. 7
SAR treatment reduced the severity of spontaneously recurring seizures post-soman. Rats exposed to soman were implanted with telemetry devices for continuous video EEG recording. (a-b) Trends of convulsive seizures (CS) and non-convulsive seizures (NCS) within each treatment group with their representative EEG traces are shown. A comparative analysis of the total number of seizures is presented as heatmaps (c.i, d.i) to illustrate relative differences between groups, and (c.ii, d.ii) line graphs showing weekly progression over time. (c.iii, d.iii) Breakdown of total seizure numbers into non-convulsive and convulsive seizures. Number of epileptiform spikes is shown as weekly progression (e) and cumulative bar graph (f) for all weeks. (g) The weekly average seizure stage representing seizure severity for each group is presented. Normality was assessed with the Shapiro–Wilk test. # represents SAR effect (soman + SAR vs Soman). Bars represent mean ± SEM and each dot on the bar graphs represent a data point for each animal. n = 8–12 (3–6/sex), #p < 0.05, ##p < 0.01 by two-way ANOVA (mixed effects model) with Sidak’s multiple comparisons. Color in the heatmap represents the number (c) and duration of average seizures (d) per week. No sex differences were observed; therefore, the data were pooled
Fg. 8
Fg. 8
SAR treatment effects on soman-induced loss of somatostatin and parvalbumin inhibitory neurons. Representative images of (a) somatostatin (red, inhibitory neuronal marker) and (c) parvalbumin (red, inhibitory neuronal marker) with DAPI (blue, nuclear stain) from the dentate gyrus (DG) + hilus, a part of the hippocampus, are shown. Cell quantification for (b) somatostatin and (d) parvalbumin positive neurons from the hippocampus, cortex, and amygdala is shown. Normality was assessed with the Shapiro–Wilk test. *indicates soman effect (soman vs control) and # represents SAR effect (soman + SAR vs Soman). Bars represent mean ± SEM, and each dot on the bar graphs represents a data point for each animal. n = 10 (5/sex). */#p < 0.05, **/##p < 0.01, ***/###p < 0.001, ****/.####p < 0.0001 by two-way ANOVA (mixed effects model) with Tukey’s multiple comparisons (B-E), scalebar = 100 μm. No sex differences were observed; therefore, the data were pooled. Individual analysis from Dentate gyrus + Hilus (DG + H), CA1, CA3, Subiculum (SUB), motor cortex (MC), Somatosensory cortex (SSC), and Piriform Cortex (PC) can be found in Supplementary Fig. 4. Created in BioRender. Thippeswamy, T. (2025) https://BioRender.com/2coee0a
Fig. 9
Fig. 9
Glial scar quantification in the amygdala of soman-exposed rats treated with or without SAR. a Representative images of Glial scars from the amygdala. The brain sections were co-labeled for GFAP (astrocyte marker) and C3 (complement component 3 marker for reactive astrocyte) and counterstained with DAPI (blue, nuclear stain). b-c The total number of rats (males and females) positive for glial scars and the number of glial scar-positive sections for each animal are shown in the bar graph. d-e Cavalieri (Trapezoidal) Approximation was used for volumetric analysis on sequential sections, and Cohen’s d estimation for effect size estimation between treatment groups. Normality was assessed with the Shapiro–Wilk test. # represents SAR effect (soman + SAR vs Soman). Each dot on the bar graphs represents a data point for each animal. n = 10 (5/sex), #p < 0.05 by Mann Whitney U test (c), effect size by Cohen’s d analysis (e), Scalebar = 100 μm. No sex differences were observed; therefore, the data were pooled
Fig. 10
Fig. 10
Reactive gliosis following soman exposure and mitigation by SAR. a Reactive microgliosis, representative images of IBA1 (red, microglia marker) and CD68 (green, phagocytic marker) positive cells and DAPI (blue, nuclear stain) immunostaining from the amygdala are shown. c Cell quantification for IBA1 + CD68 co-labeled cells from the hippocampus, thalamus, cortex, and amygdala are shown. b Reactive astrogliosis representative images of GFAP (green, astrocyte marker) and C3 (red, complement component 3 marker) positive cells and DAPI (blue, nuclear stain) immunostaining from the amygdala are shown. d Cell quantification for GFAP + C3 co-labeled cells from the hippocampus, thalamus, cortex, and amygdala is shown. Normality was assessed with the Shapiro–Wilk test. *indicates soman effect (soman vs control) and # represents SAR effect (soman + SAR vs Soman). Bars represent mean ± SEM, and each dot on the bar graphs represents a data point for each animal. (c-d) n = 10 (5/sex). */#p < 0.05, **/##p < 0.01, ***/###p < 0.001, ****/.####p < 0.0001 by two-way ANOVA (mixed effects model) with Tukey’s multiple comparisons. No sex differences were observed. Scalebar = 100 μm. Individual analysis from the dentate gyrus + hilus (DG + H), CA1, CA3, Subiculum (SUB), lateral dorsal thalamus (LDT), medial dorsal thalamus (MDT), Ventral posteromedial thalamus (VPM) motor cortex (MC), Somatosensory cortex (SSC), and Piriform Cortex (PC), can be found in Supplementary Fig. 5. Created in BioRender. Thippeswamy, T. (2025) https://BioRender.com/2coee0a
Fig. 11
Fig. 11
Nitro-oxidative stress markers, and glutathione antioxidant levels in the serum at 18 weeks post-exposure, and the effects of SAR. Griess nitrite assay kit, ROS assay kit, and Glutathione assay kit were used to determine the concentrations of nitrite, ROS, and GSH/GSSG levels in the serum. The results are plotted as (a) µM for serum nitrite, (b) relative fluorescence units (RFU) for ROS, and (c-e) as pg/mL or as a ratio for serum glutathione (GSH/GSSG). f Fold changes in these markers, compared to the control (at 1), are displayed as a heatmap. g-i Simple linear regression and correlation analysis between the combined rsFC (fMRI) of brain regions (amygdala, cortex, hippocampus, and thalamus) and (g) reactive nitrogen species (RNS), (h) Reactive oxygen species (ROS), and (i) GSH are shown with Pearson correlation coefficient ‘r’ and corresponding p-value for each graph. Normality was assessed with the Shapiro–Wilk test. Stars indicate soman effect (soman vs control) and # represents SAR effect (soman + SAR vs Soman + vehicle). Bars represent mean ± SEM, and each dot on the bar graphs represents a data point for each animal. n = 10 (5/sex). ****/####p < 0.0001 by two-way ANOVA with Tukey’s multiple comparisons. No sex differences were observed; therefore, the data from both sexes were pooled
Fig. 12
Fig. 12
SAR treatment effects on serum and CSF proinflammatory cytokine/chemokines at 18 weeks post-soman exposure. A customized MILLIPLEX® Rat Cytokine/Chemokine kit was used to analyze cytokine/chemokine. The results are plotted as pg/mL for TNF-α, IL-6, IL-17A, MCP-1, IL-18, and IL-1α in (a-g) serum and CSF (i-o) and as (h and p) heatmaps to represent fold change, compared to the control (at 1), are displayed as a heatmap. Normality was assessed with the Shapiro–Wilk test. Stars indicate soman effect (soman vs control) and # represents SAR effect (soman + SAR vs Soman + vehicle). Bars represent mean ± SEM and each dot on the bar graphs represent a data point for each animal. n = 10 (5/sex). */#p < 0.05, **/##p < 0.01, ***/###p < 0.001, ****/####p < 0.0001 by two-way ANOVA with Tukey’s multiple comparisons. No sex differences were observed, therefore the data from both sexes were pooled

Update of

References

    1. Aleshin A, Finn R. SRC: A century of science brought to the clinic. Neoplasia. 2010;12(8):599–607. 10.1593/neo.10328. - PMC - PubMed
    1. Alsaleh O, Elsaeidy A, Saeed S, Alhallak A, Altelawi M, Van Berlaer G, Hubloue I. Acute Health Effects and Outcome Following Sarin Gas Attacks in Khan Shaykhun, Syria. CUREUS JOURNAL OF MEDICAL SCIENCE 2022;14(2). 10.7759/cureus.22188. - PMC - PubMed
    1. Apland J, Aroniadou-Anderjaska V, Figueiredo T, Green C, Swezey R, Yang C, Qashu F, Braga M. Efficacy of the GluK1/AMPA receptor antagonist LY293558 against seizures and neuropathology in a soman-exposure model without pretreatment and its pharmacokinetics after intramuscular administration. J Pharmacol Exp Ther. 2013;344(1):133–40. 10.1124/jpet.112.198689. - PMC - PubMed
    1. Aroniadou-Anderjaska V, Apland J, Figueiredo T, Furtado M, Braga M Acetylcholinesterase inhibitors (nerve agents) as weapons of mass destruction: History, mechanisms of action, and medical countermeasures. NEUROPHARMACOLOGY 2020;181. 10.1016/j.neuropharm.2020.108298. - PubMed
    1. Atta A, Ibrahim W, Mohamed A, Abdelkader N. Microglia polarization in nociplastic pain: mechanisms and perspectives. Inflammopharmacology. 2023;31(3):1053–67. 10.1007/s10787-023-01216-x. - PMC - PubMed

MeSH terms

LinkOut - more resources