

Critical evaluation of 3D-DXA and 3D-Shaper: methodological limitations and their implications
- PMID: 40765623
- PMCID: PMC12319322
- DOI: 10.1093/jbmrpl/ziaf075
Critical evaluation of 3D-DXA and 3D-Shaper: methodological limitations and their implications
Abstract
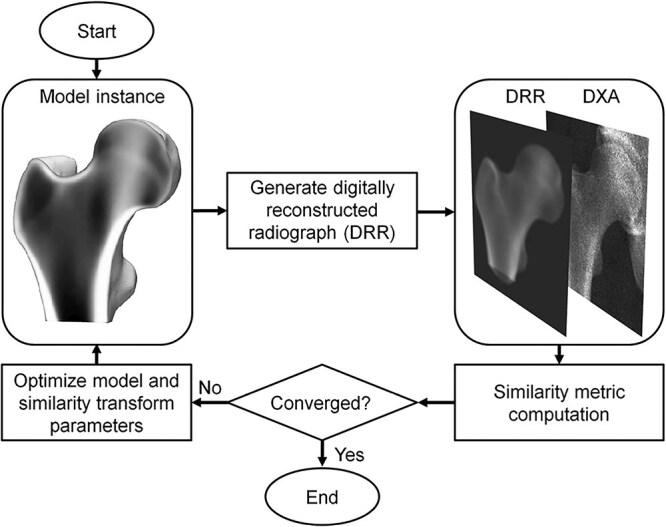
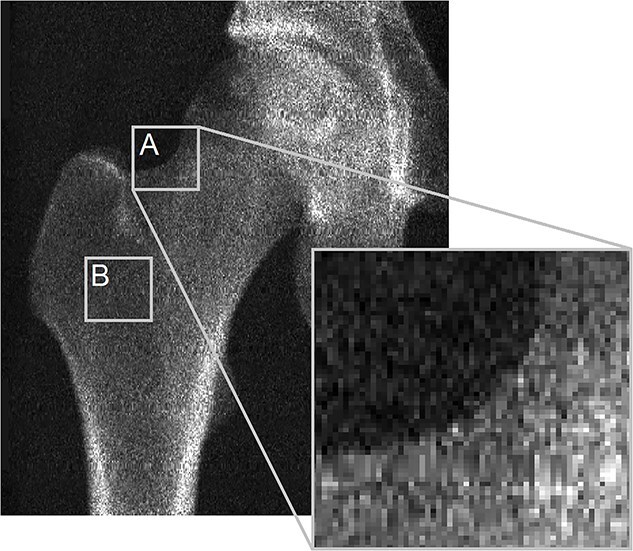
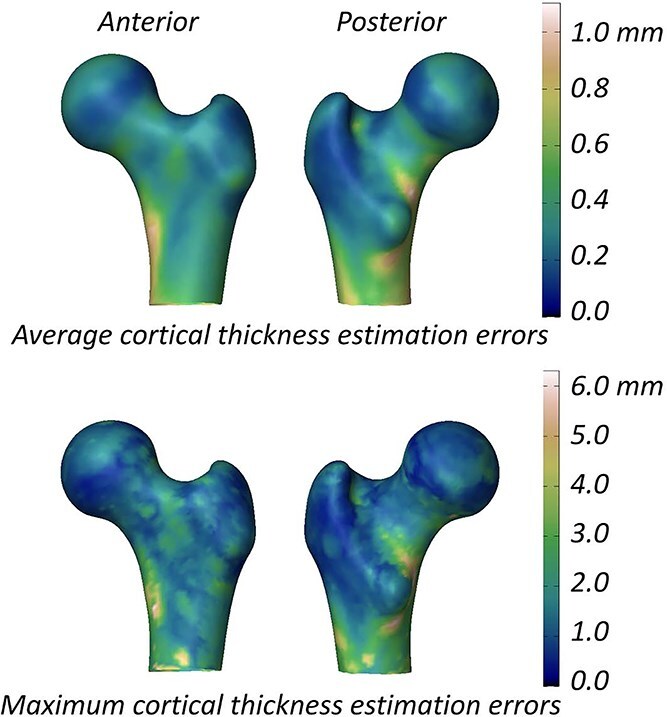
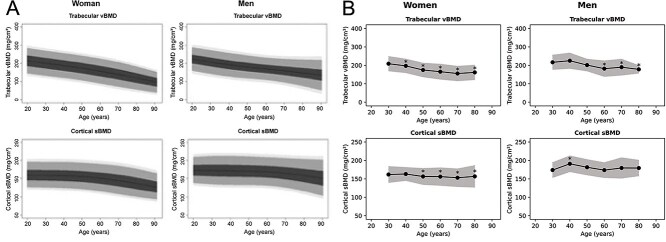
3D-DXA, as implemented in the software tool 3D-Shaper, is a software method that generates a 3D reconstruction of the proximal femur from a single 2D DXA image by registering a statistical model. Implementations of 3D-DXA aim to provide estimates of trabecular, cortical, and structural parameters, similar to those derived from quantitative computed tomography (QCT). As the inventor and developer of the software methods upon which 3D-DXA is built, I have been observing its adoption and widespread use with increasing concern. This article provides a critical evaluation of the methodological limitations inherent to 3D-DXA and discusses their implications for research and patient care. The primary issue is that the limited visibility of the cortex in a DXA image prevents 3D-DXA from accurately deriving cortical parameters. Instead, the software relies on predictions based on overall BMD rather than direct cortical measurements. This may lead to results that do not reflect actual cortical measurements. Additional concerns include the population bias due to the statistical model being derived from a specific demographic, and limited reconstruction accuracy by using single-view DXA images. These limitations have likely resulted in incorrect measurements and research outcomes, which have largely gone unrecognized due to the use of inappropriate performance assessment metrics and the absence of multiple comparison corrections in studies involving 3D-DXA. Despite these limitations, 3D-DXA has received regulatory approval in various countries, potentially compromising the accuracy of clinical diagnoses and treatment decisions. By highlighting these issues, this article aims to inform clinicians, researchers, and regulatory bodies about the significant limitations of 3D-DXA. It underscores the urgent need for a reevaluation of its use in research and clinical settings to prevent misinterpretation of results and to ensure patient safety.
Keywords: 3D-DXA; 3D-Shaper; bone mineral density; cortical parameter mapping; dual-energy X-ray absorptiometry; hip structure analsyis; quantitative computed tomography.
© The Author(s) 2025. Published by Oxford University Press on behalf of the American Society for Bone and Mineral Research.
Conflict of interest statement
The author is the co-inventor of a patent related to the methodology underlying the 3D-DXA software. The author has been involved in discussions regarding the intellectual property and origins of the commercial 3D-DXA software code, statistical models, and promotional material. The author is not affiliated with 3D-Shaper Medical or other companies involved in the commercial exploitation of 3D-DXA and has not received equity, royalties, or other financial compensation. The author has lectured for UCB in educational fora and received research grant support from Amgen Inc. and Lilly. The views expressed in this article are solely those of the author and are based on a critical evaluation of the methodology and available scientific evidence.
Figures
References
-
- Whitmarsh T. 3D Reconstruction of the Proximal Femur and Lumbar Vertebrae from Dual-Energy X-Ray Absorptiometry for Osteoporotic Risk Assessment PhD thesis. Universitat Pompeu Fabra; 2012.
Publication types
LinkOut - more resources
Full Text Sources
Research Materials
