. 2025 Aug 1:18:4589-4612.
doi: 10.2147/JMDH.S537507. eCollection 2025.

Integrated Bioinformatics and Experimental Validation Reveal Macrophage Polarization-Related Biomarkers for Osteoarthritis Diagnosis

Affiliations

Integrated Bioinformatics and Experimental Validation Reveal Macrophage Polarization-Related Biomarkers for Osteoarthritis Diagnosis

Qiwang He et al. J Multidiscip Healthc. .

Abstract

Purpose: Osteoarthritis (OA) is the most common type of arthritis and early detection is crucial to improving prognosis. In this study, we identified crucial genes associated with macrophage polarization in OA and constructed a diagnostic model to provide novel insights for diagnostic and therapeutic strategies.

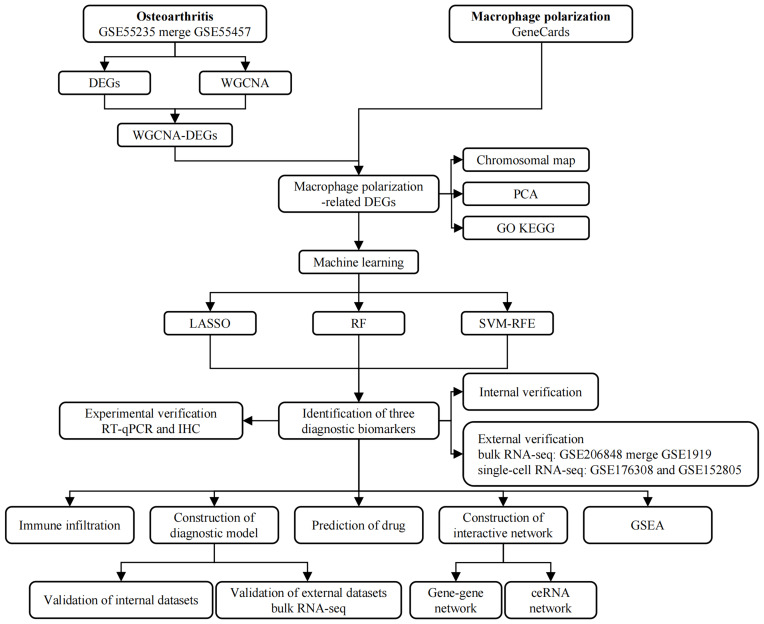
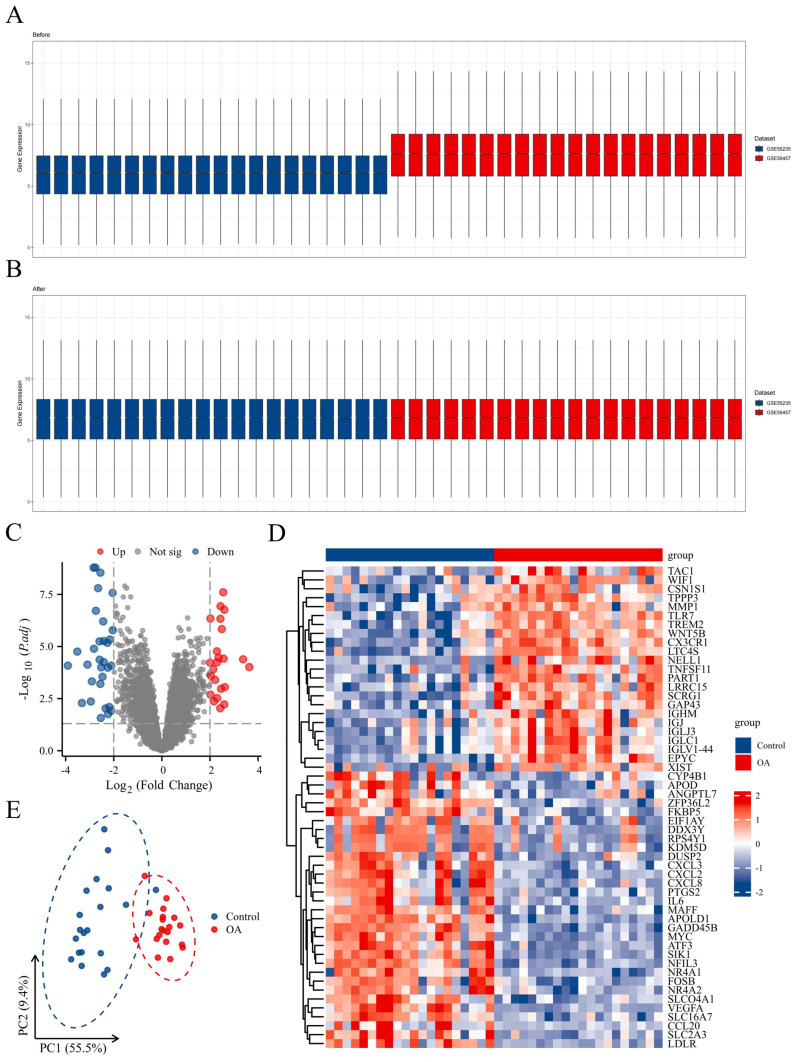
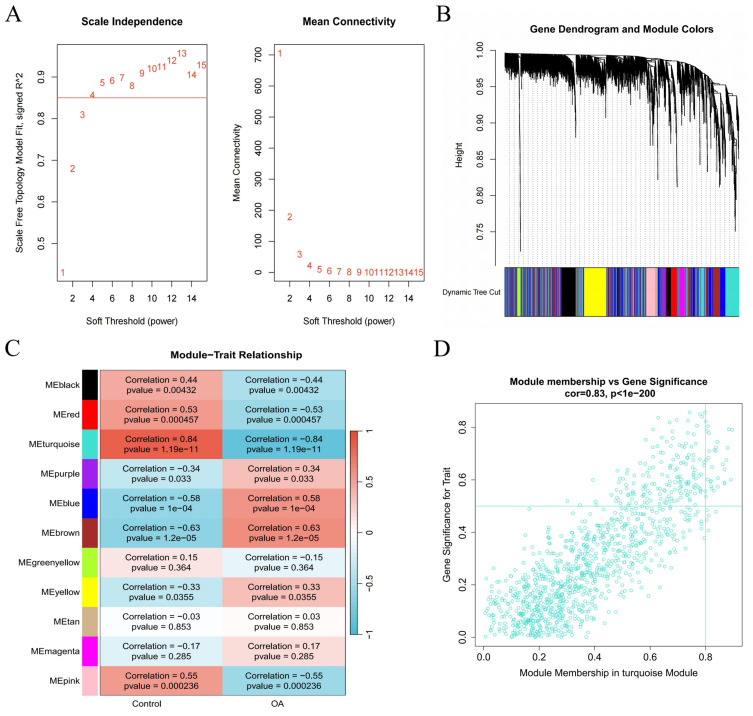
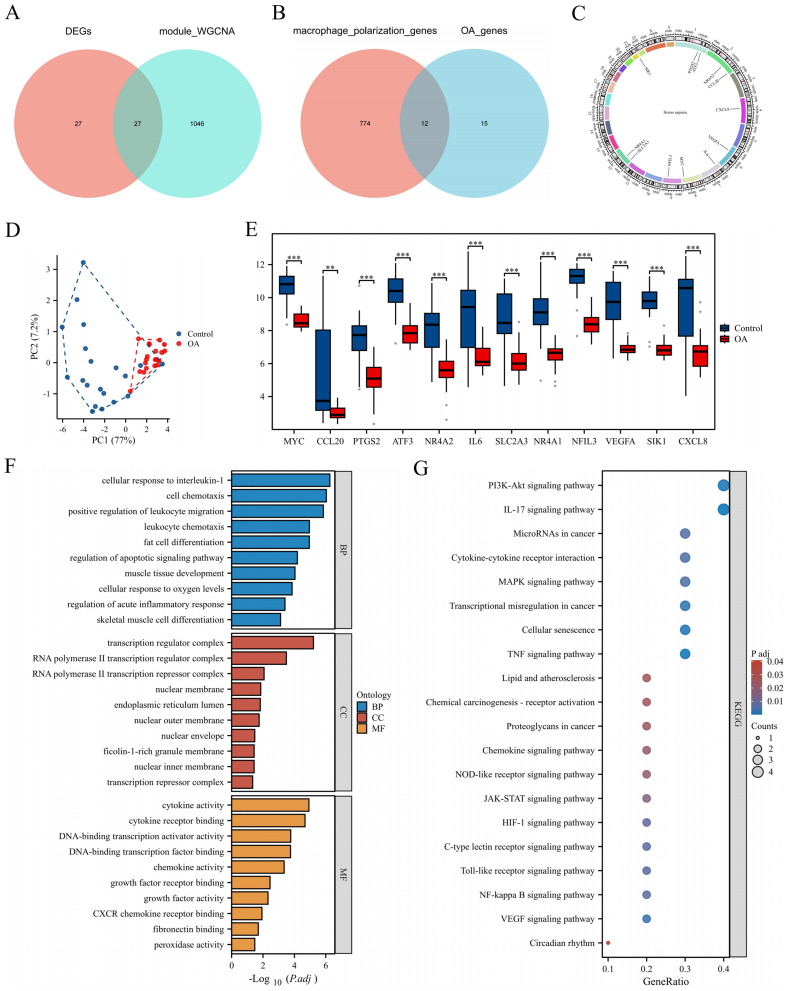
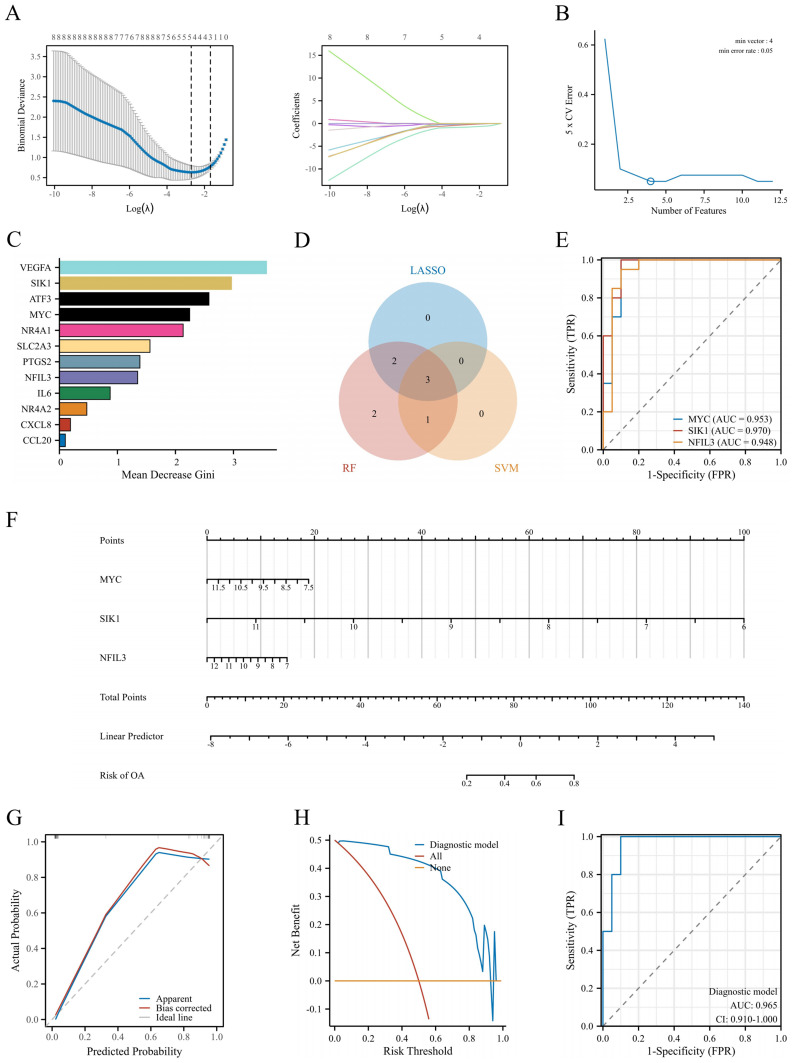
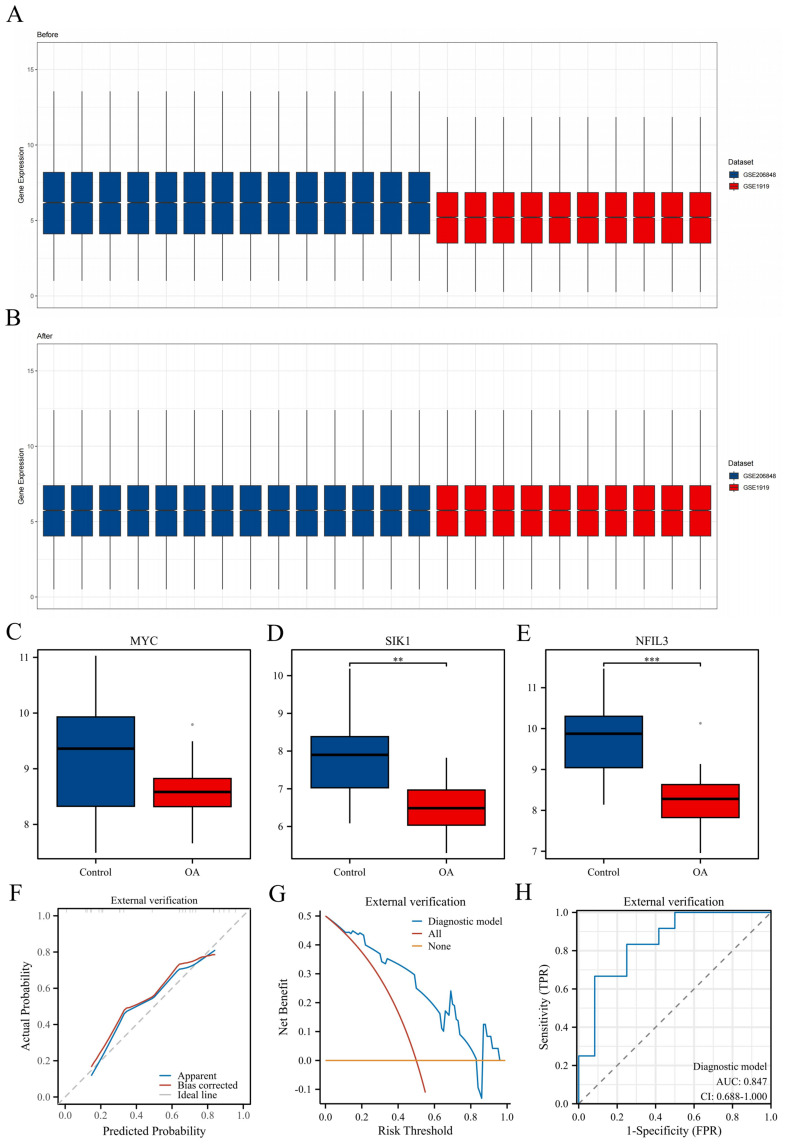
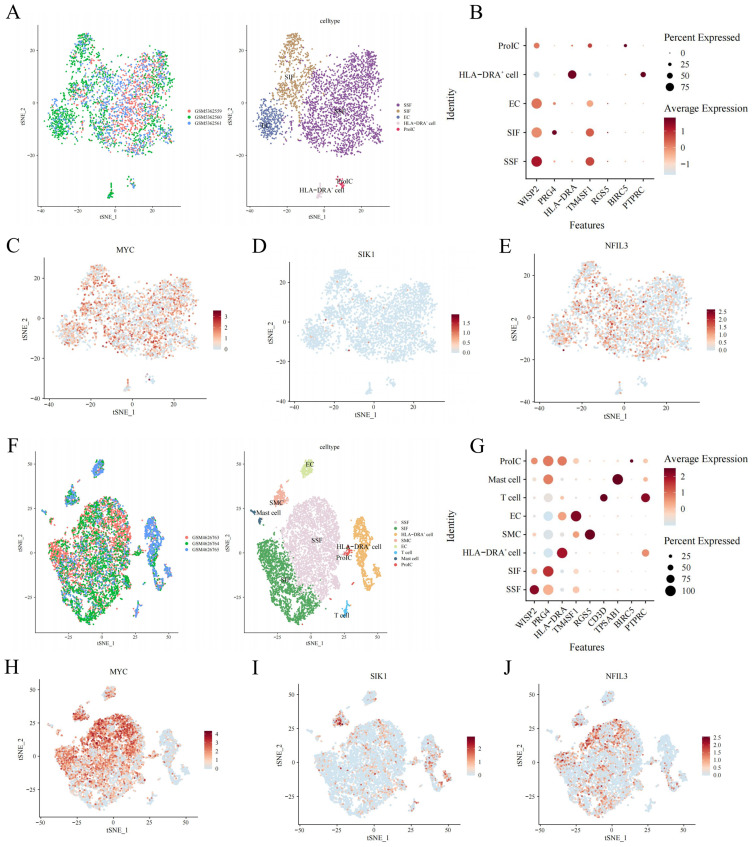
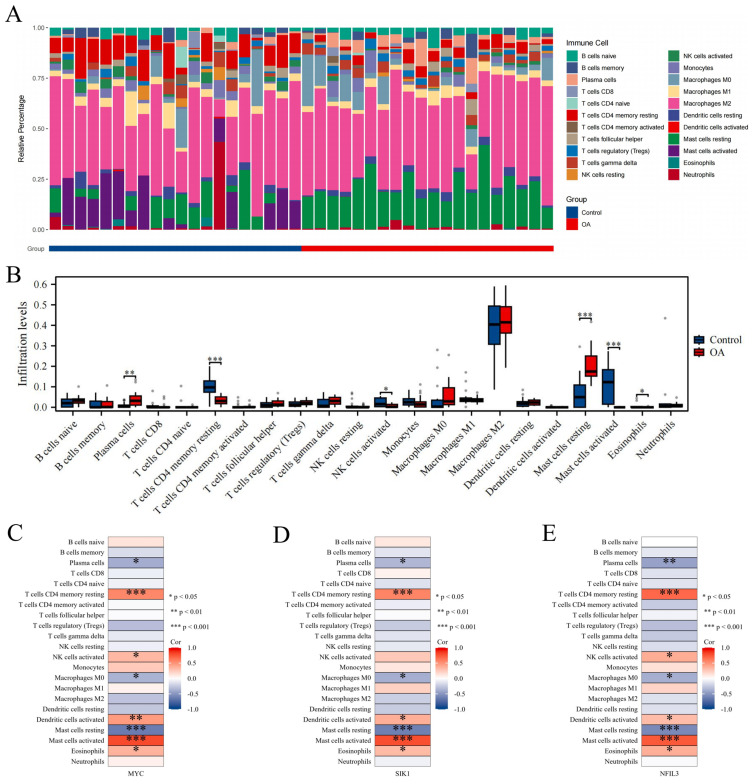
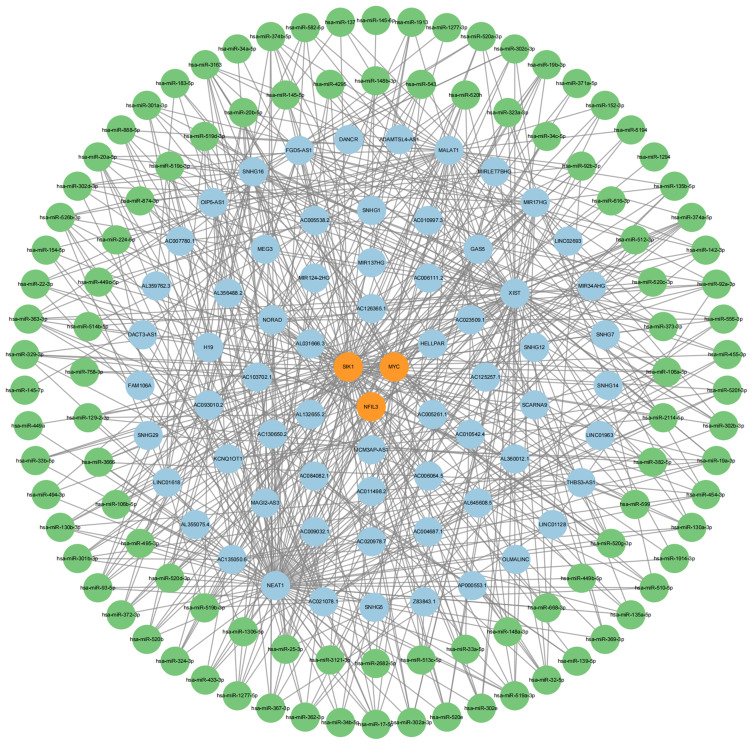
Methods: The GSE55235 and GSE55457 datasets were merged through the GEO database to identify genes related to macrophage polarization by conducting weighted gene co-expression network analysis (WGCNA) and differential expression analysis. Least absolute shrinkage and selection operator (LASSO), random forest (RF), and support vector machine recursive feature elimination (SVM-RFE) algorithms were used to identify hub genes and construct a diagnostic model validated through internal datasets and multiple external bulk RNA-seq and single-cell RNA-seq data. Additionally, various analyses, including immune infiltration, gene set enrichment analysis, competing endogenous RNA (ceRNA) construction, and drug prediction, were conducted. Finally, clinical samples were clinically validated through RT-qPCR (OA: Control = 10: 5) and IHC (6: 5) experiments.

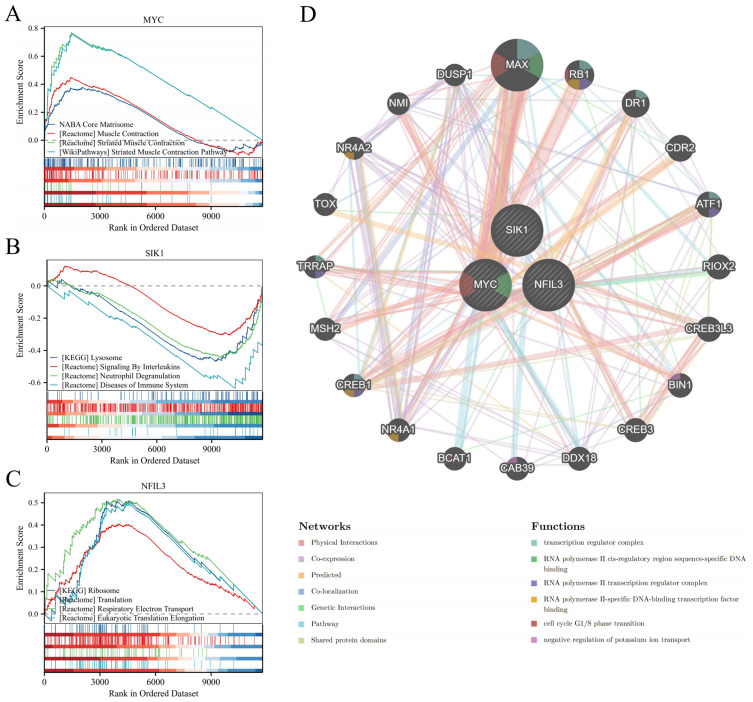
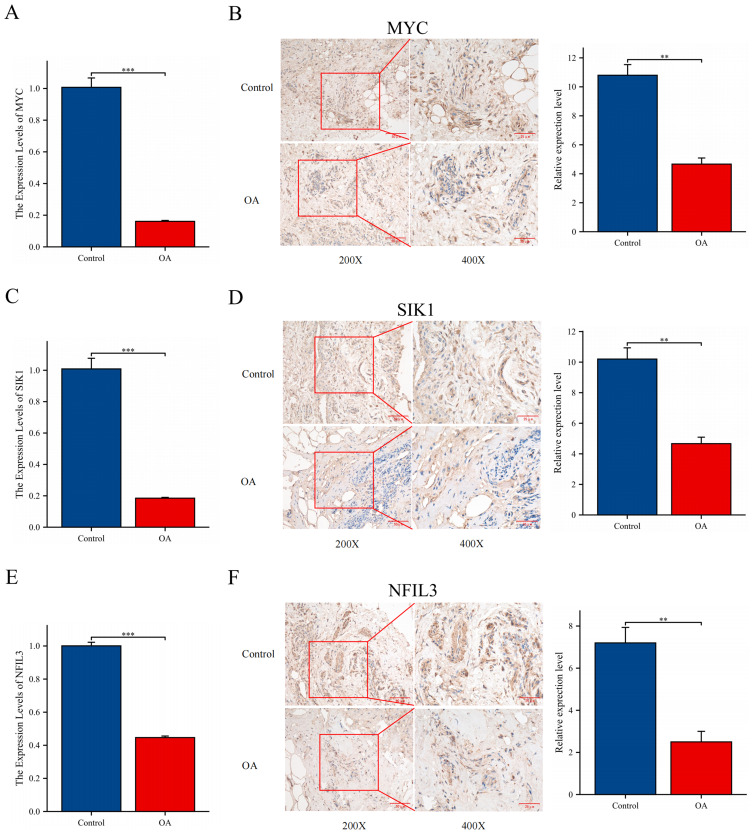
Results: Three hub genes (MYC, SIK1, and NFIL3) were identified, and the diagnostic model constructed using them demonstrated good diagnostic efficacy in both internal and external datasets (internal AUC = 0.965, external AUC = 0.847). In vitro experiments revealed that the hub genes in the synovial tissue of OA patients were significantly down-regulated (P < 0.01), confirming their potential as diagnostic biomarkers.

Conclusion: We constructed an OA diagnostic model related to macrophage polarization through comprehensive bioinformatics analysis, and the results indicated that these genes have high diagnostic value. However, further clinical studies and experimental assessments are needed to validate these findings.

Keywords: diagnostic model; machine learning; macrophage polarization; osteoarthritis.


Conflict of interest statement

The authors declare that the research was conducted in the absence of any commercial or financial relationships that could be construed as a potential conflict of interest.

Figures

Figure 1
Figure 1
The flowchart of this study.
Figure 2
Figure 2
Identification of DEGs. (A and B) Sample normalization before and after the datasets were merged. (CE) Volcano plot, heatmap, and PCA for OA.
Figure 3
Figure 3
Development of datasets associated with a weighted co-expression network in OA. (A) The network topology was examined across different soft threshold values (β). (B) Gene dendrograms were generated through average linkage hierarchical clustering. (C) Relationships between modules and traits were determined. (D) The scatterplot illustrates the significance of genes related to recurrence versus their membership within the turquoise module.
Figure 4
Figure 4
Identification of macrophage polarization-related DEGs. (A) Venn diagram of DEGs and the turquoise module. (B) Venn diagram of the data in A and macrophage polarization data. (CE) Chromosomal localization map, PCA plot, and group comparison chart of the intersection results of the results in B. (F and G) The results of the GO and KEGG enrichment analysis. **P < 0.01, and ***P < 0.001.
Figure 5
Figure 5
Screening and model construction of diagnostic biomarkers. (AC) LASSO, SVM-RFE, and RF were used to select hub genes using machine learning algorithms. (D) A Venn diagram of the three algorithms is shown. (E) ROC curve of the hub genes was made. (F) A nomogram was developed to predict the probability of OA. (GI) Calibration curve, DCA curve, and ROC curve were used for internal validation of the model.
Figure 6
Figure 6
External validation was performed based on transcriptome data. (A and B) Sample normalization was performed before and after dataset merging. (CE) The comparison chart illustrates the groups of MYC, SIK1, and NFIL3 hub genes. (FH) Calibration curve, DCA curve, and ROC curve were used for external validation of the model. **P < 0.01, and ***P < 0.001.
Figure 7
Figure 7
External validation was performed based on single-cell data. (A) The t-SNE distribution map shows cell annotation for GSE176308: the left image represents different samples with different colors, and the right image represents different cells with different colors. (B) cell annotation marker gene dot plot. (CE) The t-SNE plots illustrate MYC, SIK1, and NFIL3 gene expression. (F) The t-SNE distribution map of cell annotations for GSE152805. (G) Cell annotation marker gene dot plot. (HJ) t-SNE plots of MYC, SIK1, and NFIL3 gene expression.
Figure 8
Figure 8
Immune infiltration analysis. (A and B) Stacked bar chart and box plot showing the comparison of immune cell infiltration levels between the OA and control groups. (CE) The heatmap shows the associations of the hub genes MYC, SIK1, and NFIL3 with different immune cells. *P < 0.05, **P < 0.01, and ***P < 0.001.
Figure 9
Figure 9
GSEA of the hub genes and construction of gene interaction networks. (A–C) GSEA results for MYC, SIK1, and NFIL3. (D) Gene-gene interaction network.
Figure 10
Figure 10
A ceRNA network of mRNAs-miRNAs-lncRNAs; the Orange circles represent mRNAs, the green circles represent miRNAs, and the blue circles represent lncRNAs.
Figure 11
Figure 11
Experimental verification. (A, C and E) Relative expression levels of MYC, SIK1, and NFIL3 were analyzed by RT-qPCR. (B, D and F) Relative expression levels of MYC, SIK1, and NFIL3 were analyzed by IHC; 200X - Scale bar 50 μm, 400X - Scale bar 25 μm. **P < 0.01, and ***P < 0.001.

Similar articles

References

    1. Kloppenburg M, Namane M, Cicuttini F. Osteoarthritis. Lancet. 2025;405(10472):71–85. doi: 10.1016/S0140-6736(24)02322-5 - DOI - PubMed
    1. Kolasinski SL, Neogi T, Hochberg MC, et al. 2019 American College of Rheumatology/Arthritis Foundation guideline for the management of osteoarthritis of the hand, hip, and knee. Arthritis Rheumatol. 2020;72(2):220–233. doi: 10.1002/art.41142 - DOI - PMC - PubMed
    1. Hunter DJ, Bierma-Zeinstra S. Osteoarthritis. Lancet. 2019;393(10182):1745–1759. doi: 10.1016/S0140-6736(19)30417-9 - DOI - PubMed
    1. Steinmetz JD, Culbreth GT, Haile LM, et al. Global, regional, and national burden of osteoarthritis, 1990–2020 and projections to 2050: a systematic analysis for the global burden of disease study 2021. Lancet Rheumatol. 2023;5(9):e508–e522. doi: 10.1016/S2665-9913(23)00163-7 - DOI - PMC - PubMed
    1. Welhaven HD, Welfley AH, June RK. Osteoarthritis year in review 2024: molecular biomarkers of osteoarthritis. Osteoarthritis Cartilage. 2025;33(1):67–87. doi: 10.1016/j.joca.2024.10.003 - DOI - PMC - PubMed

LinkOut - more resources