. 2025 Jul 22:12:1597680.
doi: 10.3389/fnut.2025.1597680. eCollection 2025.

Effects of celery (Apium graveolens) on blood pressure, glycemic and lipid profile in adults: a systematic review and meta-analysis of randomized controlled trials

Affiliations

Effects of celery (Apium graveolens) on blood pressure, glycemic and lipid profile in adults: a systematic review and meta-analysis of randomized controlled trials

Dangzhen Liu et al. Front Nutr. .

Abstract

Background: Celery is commonly used as a diet intervention for hypertension, hyperglycemia, and hyperlipidemia. However, its precise therapeutic efficacy remains uncertain.

Objective: This study aims to comprehensively evaluate the efficacy of celery preparations in regulating blood pressure, blood glucose, and blood lipids profiles in adults.

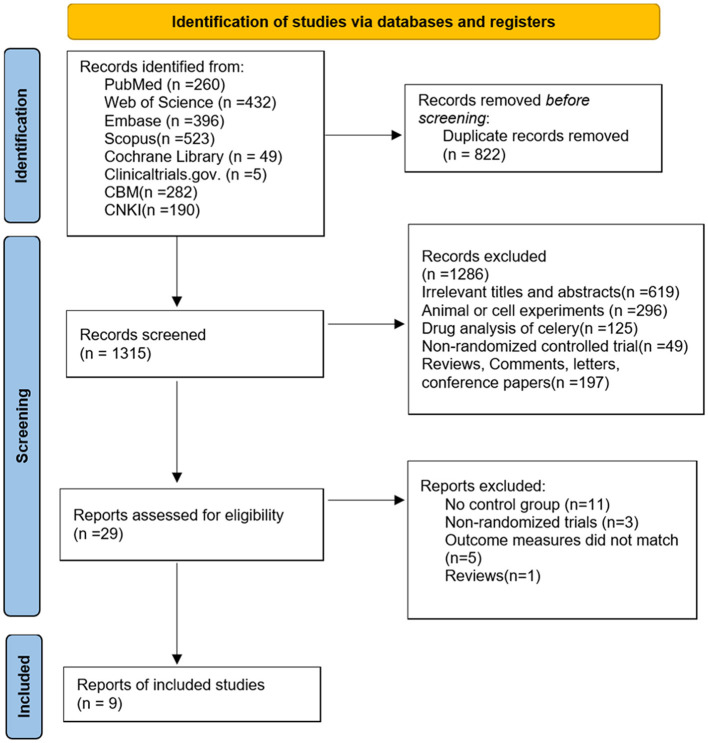
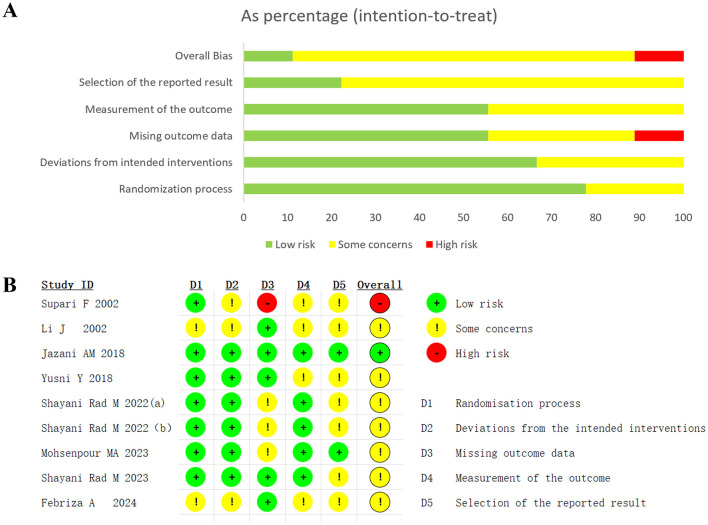
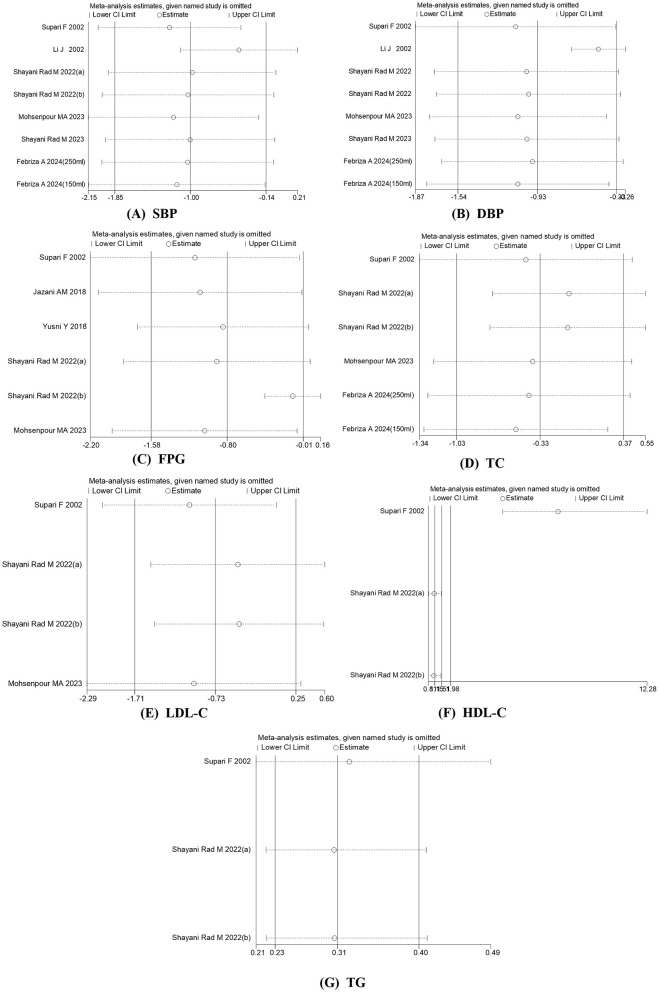
Methods: A systematic search was conducted in PubMed, Web of Science, EMBASE, Scopus, Cochrane Library, Clinicaltrials.gov, China Biology Medicine disc, and China National Knowledge Infrastructure. Randomized controlled trials of celery were included. Data were analyzed using either a random-effects model or a fixed-effects model, depending on heterogeneity, and were presented as standardized mean differences (SMDs) with corresponding 95% confidence intervals (CIs). All eligible studies were evaluated in terms of study characteristics, risk of bias, me-ta-analysis, sensitivity analysis, meta-regression, and publication bias.

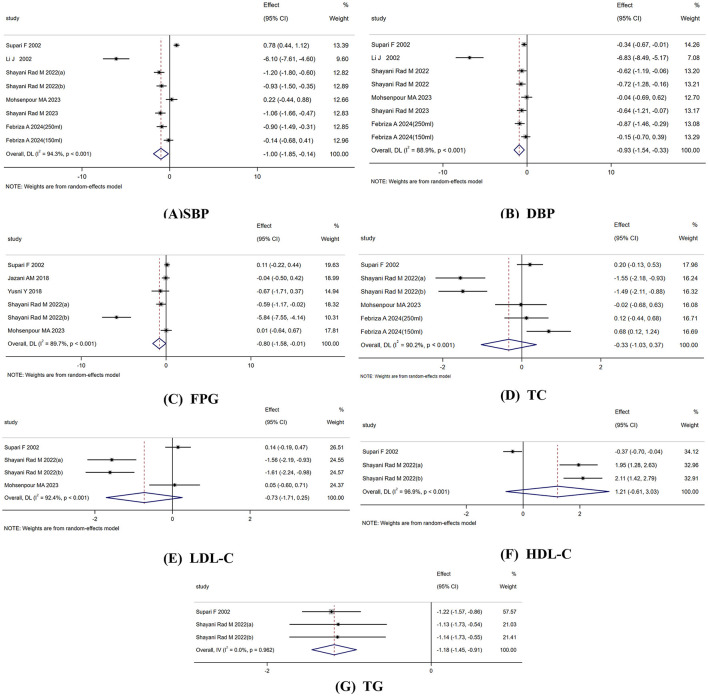
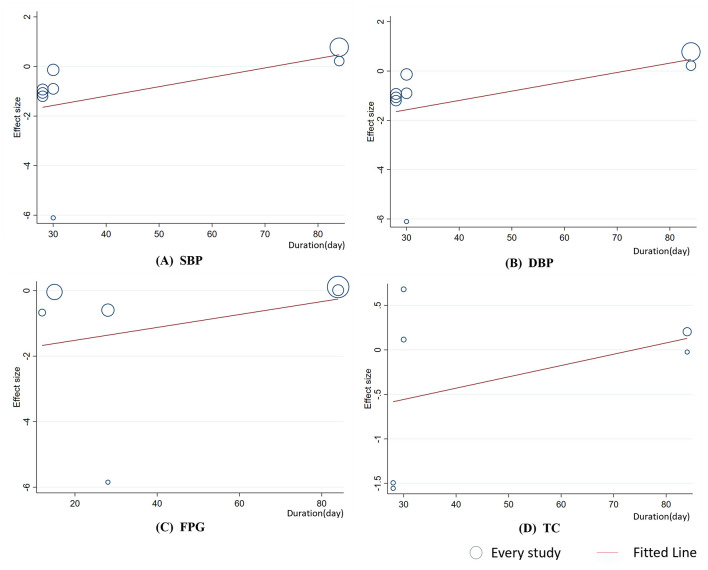
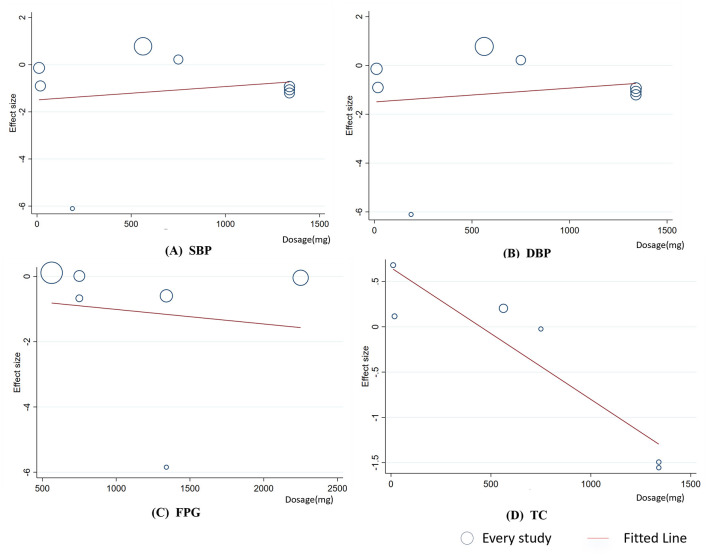
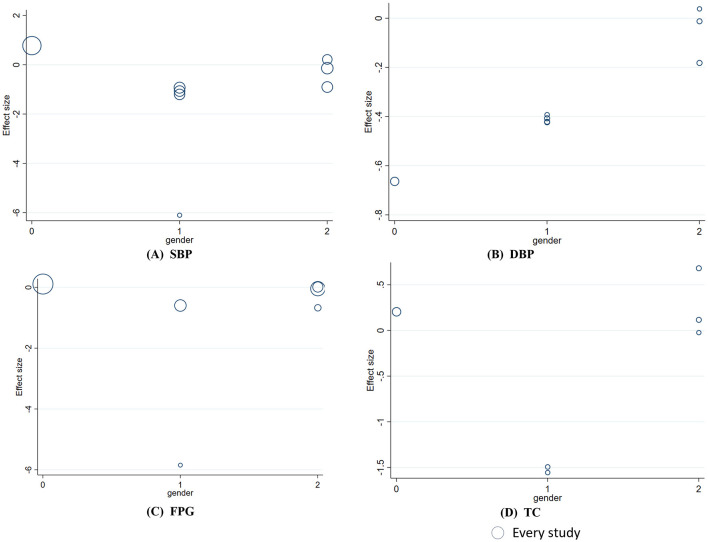
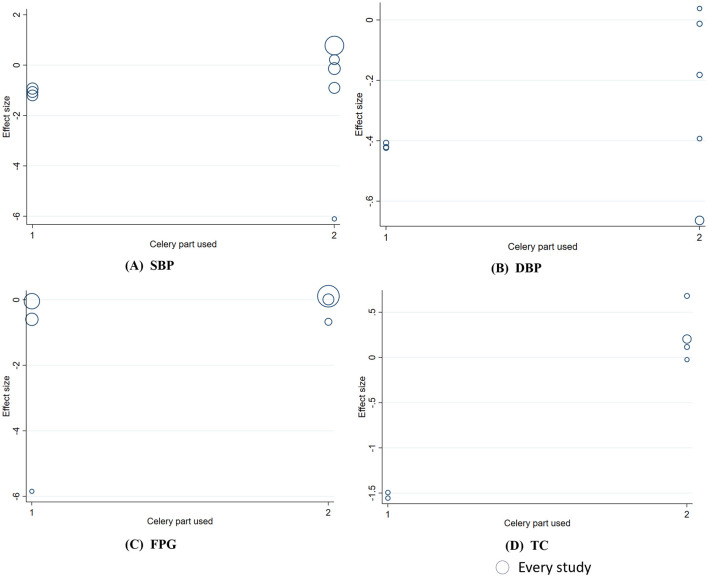
Results: Our meta-analysis included ten randomized controlled studies with a total of 511 participants. The results demonstrated significant therapeutic effects of celery on systolic blood pressure (SMD: -1.0; 95% CI: -1.85 to -0.14), diastolic blood pressure (SMD: -0.93; 95% CI: -1.54 to -0.33), fasting plasma glucose (SMD: -0.80; 95% CI: -1.58 to -0.01), and triglyceride (SMD: -1.18; 95% CI: -1.45 to -0.91). However, no overall effects were observed on total cholesterol, low-density lipoprotein, or high-density lipo-protein. Subgroup analysis revealed that celery seeds or celery preparations exceeding 1,000 mg/day were more effective than other parts of celery. Additionally, no significant difference in adverse events between celery and placebo.

Conclusion: This meta-analysis demonstrated that Celery preparations significantly improve hypertension, hyperglycemia, and hyperlipidemia, with a favorable safety profile. Celery seeds or celery preparations exceeding 1,000 mg/day will have better effect. These findings suggest that celery performs well as a potential dietary supplement for reducing hypertension, hyperglycemia, and hyperlipidemia. However, the substantial heterogeneity observed for most outcomes and limited sample sizes warrant further high-quality clinical trials with longer follow-up periods to confirm these effects and establish optimal dosing regimens.

Systematic review registration: https://www.crd.york.ac.uk/PROSPERO/view/CRD42025631143, PROSPERO: CRD42025631143.

Keywords: blood pressure; celery; glycemic; lipid profile; meta-analysis.


Conflict of interest statement

The authors declare that the research was conducted in the absence of any commercial or financial relationships that could be construed as a potential conflict of interest.

Figures

Flowchart of study identification and selection process. Initially, 1,582 records were identified from databases like PubMed, Web of Science, and others. After removing 822 duplicates, 1,315 records were screened. Of these, 1,286 were excluded due to irrelevance, non-randomized trials, or other criteria. Twenty-nine reports were assessed for eligibility, with 20 excluded for reasons such as lacking a control group. Finally, 9 reports were included.
Figure 1
PRISMA flow diagram of selecting studies.
Panel A shows a bar chart of various risk factors in studies. Categories include overall bias, selection of reported results, measurement of outcomes, missing data, deviations from interventions, participant recruitment timing, and randomization. Colors indicate levels of risk: green for low risk, yellow for some concerns, and red for high risk.Panel B presents a table listing study IDs with colored circles indicating risk levels for different categories. Categories include randomization, timing of recruitment, deviations from interventions, missing data, measurement of outcomes, and result selection. Symbols: green for low risk, yellow for some concerns, red for high risk.
Figure 2
Summary plot of Cochrane Collaboration's risk of bias tool 2 of (A) Risk of bias summary. (B) Risk of bias diagram.
Seven forest plots for different health metrics from various studies. Each plot includes study name, effect size with 95% confidence interval, and weight. Plots (A) SBP and (B) DBP show effects ranging across negative and positive values. (C) FPG and (D) TC exhibit variations with overlapping data points. (E) LDL-C, (F) HDL-C, and (G) TG display distinct effects differing across studies. Overall effect for each is represented by a diamond, indicating summary effect estimates. Plots specify random-effects model usage.
Figure 3
Forest plot reporting WMD and 95%CI for the effects of celery intake on (A) systolic blood pressure (SBP). (B) Diastolic blood pressure (DBP). (C) Fasting plasma glucose (FPG). (D) total cholesterol (TC). (E) Low-density lipoprotein cholesterol (LDL-c). (F) High-density lipoprotein cholesterol (HDL-c). (G) Triglycerides (TG).
Seven panel forest plots depict meta-analysis estimates for different studies. Each panel represents a specific health metric: (A) Systolic Blood Pressure (SBP), (B) Diastolic Blood Pressure (DBP), (C) Fasting Plasma Glucose (FPG), (D) Total Cholesterol (TC), (E) Low-Density Lipoprotein Cholesterol (LDL-C), (F) High-Density Lipoprotein Cholesterol (HDL-C), and (G) Triglycerides (TG). Each plot shows study names, confidence intervals, and estimates, indicating the effect of omitting specific studies. Plots demonstrate the statistical impact across a range of health parameters.
Figure 4
Sensitivity analysis was performed by removing each study in turn to determine the impact of each study on the overall effect size.
Four scatter plots depicting effect size versus duration in days, each with a fitted line. (A) SBP, (B) DBP, (C) FPG, and (D) TC show positive correlations. Circles represent individual study data points, with varied sizes indicating sample sizes.
Figure 5
Meta-regression analysis between celery duration and mean difference in (A) SBP; (B)DBP; (C) FPG; (D) TC.
Scatter plots showing the effect size versus dosage in milligrams for four variables: (A) SBP, (B) DBP, (C) FPG, and (D) TC. Each plot displays data points representing individual studies, with circle sizes indicating study weight, and a fitted line illustrating trend direction. SBP and DBP plots show a slight upward trend, FPG shows a slight downward trend, and TC shows a pronounced downward trend.
Figure 6
Meta-regression analysis between celery dosage and mean difference in (A) SBP; (B)DBP; (C) FPG; (D) TC.
Four scatterplots display the effect size by gender. (A) SBP shows clusters and some outliers. (B) DBP depicts a tighter cluster near the center. (C) FPG includes more spread out points with varying bubble sizes. (D) TC indicates minimal spread with points mostly around zero. Each plot represents data from different studies, indicated by bubble size.
Figure 7
Meta-regression analysis between gender and mean difference in (A) SBP; (B) DBP; (C) FPG; (D) TC. 0 indicates male-dominant studies, 1 indicates gender-balanced studies, and 2 indicates female-dominant studies.
Four scatter plots labeled A, B, C, and D compare effects of celery parts used on different health metrics. Plot A shows SBP, Plot B shows DBP, Plot C shows FPG, and Plot D shows TC. Each plot uses circles of varying sizes to represent individual studies' effect sizes. The x-axis represents celery parts used, categorized as 1 or 2.
Figure 8
Meta-regression analysis between celery part used and mean difference in (A) SBP; (B) DBP; (C) FPG; (D) TC.1 indicates celery seeds, and 2 indicates other parts of the celery plant.

Similar articles

References

    1. Krokstad S. Worldwide trends in hypertension prevalence and progress in treatment and control from 1990 to 2019: a pooled analysis of 1201 population-representative studies with 104 million participants (vol 398, pg 957, 2021). Lancet. (2022) 399:520–520. 10.1016/S0140-6736(21)01330-1 - DOI - PMC - PubMed
    1. Hisamatsu T, Miura K. Epidemiology and control of hypertension in Japan: a comparison with Western countries. J Hum Hypertens. (2024) 38:469–76. 10.1038/s41371-021-00534-3 - DOI - PubMed
    1. Rooney MR, Fang MC, Ogurtsova K, Ozkan B, Echouffo-Tcheugui JB, Boyko EJ, et al. Global prevalence of prediabetes. Diabetes Care. (2023) 46:1388–94. 10.2337/dc22-2376 - DOI - PMC - PubMed
    1. Lan JR, Zhao YY, Dong FX, Yan ZY, Zheng WJ, Fan JP, et al. Meta-analysis of the effect and safety of berberine in the treatment of type 2 diabetes mellitus, hyperlipemia and hypertension. J Ethnopharmacol. (2015) 161:69–81. 10.1016/j.jep.2014.09.049 - DOI - PubMed
    1. Liu J, Grundy SM, Wang W, Smith SC, Vega GL, Wu ZS, et al. Ten-year risk of cardiovascular incidence related to diabetes, prediabetes, and the metabolic syndrome. Am Heart J. (2007) 153:552–8. 10.1016/j.ahj.2007.01.003 - DOI - PubMed

Publication types

LinkOut - more resources