. 2025 Jul 11;21(10):4663-4682.
doi: 10.7150/ijbs.114510. eCollection 2025.

SIRT4-Mediated Deacetylation of PRDX3 Attenuates Liver Ischemia Reperfusion Injury by Suppressing Ferroptosis

Affiliations

SIRT4-Mediated Deacetylation of PRDX3 Attenuates Liver Ischemia Reperfusion Injury by Suppressing Ferroptosis

Qiwen Yu et al. Int J Biol Sci. .

Abstract

Liver ischemia-reperfusion injury (LIRI) is an important cause of the clinical prognosis of liver transplantation. Despite Sirtuin 4 (SIRT4) is involved in various post-translational modifications, its role in LIRI is unclear. This research aimed to investigate the influence of SIRT4 on the pathogenesis of LIRI. To this end, SIRT4 knockout (KO) and liver-specific overexpression mice, as well as alpha mouse liver 12 (AML12) cells, were employed. We showed that SIRT4 expression was downregulated in mice with LIRI or AML12 cells exposed to hypoxia-reoxygenation (H/R) injury, as well as in the liver tissue of liver transplant patients. SIRT4 KO exacerbated liver injury and ferroptosis; conversely, liver-specific SIRT4 overexpression in mice produced the opposite results. Furthermore, the ferroptosis inhibitor ferrostatin-1 mitigated the exacerbation of liver injury and ferroptosis caused by SIRT4 KO. Mechanistically, SIRT4 interacted with peroxiredoxins 3 (PRDX3) and deacetylated it at lysine 92, leading to the inhibition of ferroptosis. Furthermore, the protective effect of SIRT4 on LIRI was dependent on PRDX3 deacetylation at lysine 92. Additionally, liver-targeted lipid nanoparticles (LNPs)-sirt4 mRNA alleviated LIRI and ferroptosis in mice. Taken together, our findings highlight the SIRT4-PRDX3 axis as a key regulator and potential therapeutic target for LIRI.

Keywords: PRDX3; SIRT4; deacetylation; ferroptosis; liver ischemia reperfusion injury.


Conflict of interest statement

Competing Interests: The authors have declared that no competing interest exists.

Figures

Figure 1
Figure 1
LIRI decreases SIRT4 expression and enhances ferroptosis activation. (A) UMAP of total cells from sham group and IR group. (B) Expression of the indicated gene in different cell subsets. (C) SIRT4 protein expression in the livers of human liver transplantation (LT) patients (n=12/group). (D) Immunohistochemical staining of SIRT4 in liver sections from human LT patients. (E) Correlation analysis of postoperative serum AST and ALT levels and liver SIRT4 mRNA levels (n=64). (F-G) SIRT4 protein expression in mouse liver tissue after different durations of reperfusion (n=6/group). (H) SIRT4 mRNA expression in mouse liver tissue after 6 h of reperfusion (n=6/group). (I) Immunohistochemical staining of SIRT4 in liver sections from mouse liver tissue after 6 h of reperfusion. (J) SIRT4 protein expression in AML12 cells after different durations of reoxygenation (n=4/group). (K) SIRT4 mRNA expression in mouse AML12 cells after 6 h of reoxygenation (n=6/group). The data are presented as mean ± SD. *P<0.05; **P<0.01.
Figure 2
Figure 2
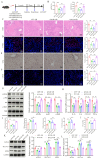
SIRT4 deficiency aggravates liver I/R injury. (A) Schematic diagram of the construction of SIRT4 KO mice. (B) SIRT4 protein expression in the liver tissues of WT and SIRT4 KO mice. (C) Serum ALT and AST levels in WT and SIRT4 KO mice subjected to different treatments (n=6/group). (D) H&E staining and necrotic area statistics of liver tissues in WT and KO mice subjected to sham or I/R treatment. (E) TUNEL staining and statistical analysis of liver tissue from WT and KO mice under different conditions (n=6/group). (F) Immunohistochemical staining and statistics of Ly6g positive inflammatory cells in liver tissue in WT and KO mice under different treatments (n=6/group). (G) Immunofluorescence staining and statistical analysis of CD11b positive inflammatory cells (red) in liver tissue from WT and KO mice (n=6/group). (H) NF-κB signaling protein detection and statistical analysis of liver tissues from WT and KO mice subjected to different treatments (n=6/group). (I) mRNA expression of the inflammatory cytokines IL-1β, IL-6, CXCL10 and TNF-α in the liver tissues of WT and SIRT4 KO mice subjected to different treatments (n=6/group). The data are presented as mean ± SD. *P<0.05; **P<0.01.
Figure 3
Figure 3
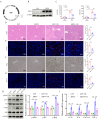
SIRT4 overexpression alleviates liver I/R injury. (A) Schematic diagram of the construction of AAV-SIRT4. (B) SIRT4 protein expression in the liver tissues of AAV-GFP and AAV-SIRT4 mice. (C) Serum ALT and AST levels in WT and SIRT4 KO mice subjected to different treatments (n=6/group). (D) H&E staining and necrotic area statistics of liver tissues from AAV-GFP and AAV-SIRT4 mice subjected to sham or I/R treatment (n=6/group). (E) TUNEL staining and statistical analysis of liver tissue from AAV-GFP and AAV-SIRT4 mice under different conditions (n=6/group). (F) Immunohistochemical staining and statistical analysis of Ly6g positive inflammatory cells in liver tissue from AAV-GFP and AAV-SIRT4 mice subjected to different treatments (n=6/group). (G) Immunofluorescence staining and statistical analysis of CD11b positive inflammatory cells (red) from AAV-GFP and AAV-SIRT4 mice subjected to different treatments (n=6/group). (H) NF-κB signaling protein detection and statistical analysis of liver tissues from WT and KO mice subjected to different treatments (n=6/group). (I) mRNA expression of the inflammatory cytokines IL-1β, IL-6, CXCL10 and TNF-α in liver tissues from AAV-GFP and AAV-SIRT4 treated mice (n=6/group). The data are presented as mean ± SD. *P<0.05; **P<0.01.
Figure 4
Figure 4
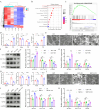
SIRT4 negatively regulates ferroptosis during liver I/R injury. (A) Heatmap analysis of liver samples from WT and SIRT4 KO mice after LIRI. (B) KEGG enrichment scatter plot analysis of liver samples from WT and SIRT4 KO mice after LIRI. (C) GSEA of ferroptosis signaling pathway components in WT and SIRT4 KO mice after LIRI. (D) MDA, GSH and Fe2+ contents in liver tissue from WT and SIRT4 KO mice subjected to different treatments (n=6/group). (E) Mitochondrial structure of WT and SIRT4 KO mice subjected to different treatments was observed via TEM (n=6/group). (F) Protein detection and statistical analysis of ACSL4, SLC7A11 and GPX4 in the liver tissues of WT and KO mice subjected to different treatments (n=6/group). (G) mRNA expression of ACSL4, SLC7A11 and GPX4 in the liver tissues of WT and KO mice subjected to different treatments (n=6/group). (H) MDA, GSH and Fe2+ contents in liver tissue from AAV-GFP and AAV-SIRT4 mice subjected to different treatments (n=6/group). (I) Mitochondrial structure of AAV-GFP and AAV-SIRT4 mice subjected to different treatments was observed via TEM. (J) Protein detection and statistical analysis of ACSL4, SLC7A11 and GPX4 in liver tissues from AAV-GFP and AAV-SIRT4 mice subjected to different treatments (n=6/group). (K) mRNA expression of ACSL4, SLC7A11 and GPX4 in liver tissue from AAV-GFP and AAV-SIRT4 mice subjected to different treatments (n=6/group). The data are presented as mean ± SD. *P<0.05; **P<0.01.
Figure 5
Figure 5
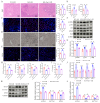
SIRT4 deficiency induces liver I/R injury through ferroptosis. (A) H&E staining and necrotic area statistics of liver tissue from WT and SIRT4 KO mice subjected to different treatments (n=6/group). (B) Serum ALT and AST levels in WT and SIRT4 KO mice subjected to different treatments (n=6/group). (C) TUNEL staining and statistical analysis of liver tissue from WT and SIRT4 KO mice subjected to different treatments (n=6/group). (D) Immunohistochemical staining and statistical analysis of Ly6g positive inflammatory cells in liver tissue from WT and KO mice subjected to different treatments (n=6/group). (E) Immunofluorescence staining and statistical analysis of CD11b positive inflammatory cells (red) in liver tissue from WT and KO mice subjected to different treatments (n=6/group). (F-G) NF-κB signaling protein detection and statistical analysis of liver tissue from WT and KO mice subjected to different treatments (n=6/group). (H) MDA, CAT, GSH and SOD levels or enzyme activities in liver tissue from WT and SIRT4 KO mice subjected to different treatments (n=6/group). (I) Liver Fe2+ content in WT and SIRT4 KO mice subjected to different treatments (n=6/group). (J) mRNA expression of the inflammatory cytokines IL-1β, IL-6, CXCL10 and TNF-α in liver tissue from WT and SIRT4 KO mice subjected to different treatments (n=6/group). (K) Protein detection and statistical analysis of ACSL4, SLC7A11 and GPX4 in liver tissue from WT and KO mice subjected to different treatments (n=6/group). (L) mRNA expression ACSL4, SLC7A11 and GPX4 in liver tissues from WT and KO mice subjected to different treatments (n=6/group). The data are presented as mean ± SD. *P<0.05; **P<0.01.
Figure 6
Figure 6
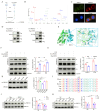
SIRT4 deacetylates PRDX3 at K92 in LIRI. (A) LC‒MS/MS analysis of the SIRT4-binding proteins from Flag and Flag-SIRT4 AML12 hepatocytes after H/R challenge. (B) LC‒MS/ MS spectrum of the PRDX3 protein. (C) Representative fluorescence images showing the colocalization of SIRT4 (green) and PRDX3 (red) in AML12 hepatocytes. (D) Flag-tagged SIRT4 and HA-tagged PRDX3 plasmids were cotransfected into HEK293T cells, Co-IP experiment analysis of the interaction between SIRT4 and PRDX3. (E) Molecular docking simulation of SIRT4 and PRDX3. (F) Expression and statistical analysis of acetylated PRDX3 protein in SIRT4 control and knockdown AML12 hepatocytes after H/R injury (n=3/group). (G) Expression and statistical analysis of acetylated PRDX3 protein in Flag and SIRT4 overexpressing AML12 hepatocytes after H/R injury (n=3/group). (H) Changes in the acetylation level, as determined by IP, in HEK293T cells transfected with HA-PRDX3, HA-PRDX3 (K84R), HA-PRDX3 (K92R), HA-PRDX3 (K197R), and HA-PRDX3 (K249R) plasmids (n=3/group). (I) The lysine K92 site of PRDX3 is highly conserved across different species. (J) Expression and statistical analysis of acetylated PRDX3 protein in Flag and SIRT4 overexpressing AML12 hepatocytes after transfection with HA-PRDX3 (WT), HA-PRDX3 (K92R), and HA-PRDX3 (K92Q) plasmids (n=3/group). (K) Expression and statistical analysis of acetylated PRDX3 protein in SIRT4 control and knockdown AML12 hepatocytes after transfection with HA-PRDX3 (WT), HA-PRDX3 (K92R), HA-PRDX3 (K92Q) plasmids (n=3/group). The data are presented as mean ± SD. *P<0.05; **P<0.01.
Figure 7
Figure 7
Acetylation of PRDX3 at K92 negates its protective effect on LIRI. (A) Schematic representation of adeno-associated virus intervention in mice and the I/R model. (B) Serum ALT and AST levels in different group of mice (n=6/group). (C) H&E staining and necrotic area statistics of liver tissue from different groups of mice (n=6/group). (D) TUNEL staining and statistical analysis of liver tissue from different groups of mice (n=6/group). (E) Immunohistochemical staining and statistical analysis of Ly6g positive inflammatory cells in liver tissue from different groups of mice (n=6/group). (F) Immunofluorescence staining and statistical analysis of CD11b positive inflammatory cells (red) in liver tissue from different groups of mice (n=6/group). (G) Detection and statistical analysis of NF-κB signaling proteins and statistical analysis in liver tissue from different groups of mice (n=6/group). (H) mRNA expression of the inflammatory cytokines IL-1β, IL-6, CXCL10 and TNF-α in liver tissues from the indicated groups (n=6/group). (I) MDA, GSH, SOD, CAT levels or enzyme activities in liver tissue from different groups of mice (n=6/group). (J) Liver Fe2+ levels in different groups of mice (n=6/group). (K) Protein detection and statistical analysis of ACSL4, SLC7A11 and GPX4 in liver tissues from different groups of mice (n=6/group). (L) mRNA expression of ACSL4, SLC7A11 and GPX4 in liver tissue from different groups of mice (n=6/group). The data are presented as mean ± SD. *P<0.05; **P<0.01.
Figure 8
Figure 8
The protective effect of SIRT4 against LIRI depends on the deacetylation of PRDX3 at K92. (A) Schematic representation of adeno-associated virus intervention in SIRT4 KO mice and the I/R model. (B) Serum ALT and AST levels in SIRT4 KO mice subjected to different treatments (n=6/group). (C) H&E staining and necrotic area statistics of liver tissue from SIRT4 KO mice subjected to different treatments (n=6/group). (D) TUNEL staining and statistical analysis of liver tissue from SIRT4 KO mice subjected to different treatments (n=6/group). (E) Immunohistochemical staining and statistical analysis of Ly6g positive inflammatory cells in liver tissue from SIRT4 KO mice subjected to different treatments (n=6/group). (F) Immunofluorescence staining and statistical analysis of CD11b positive inflammatory cells (red) in liver tissue from SIRT4 KO mice subjected to different treatments (n=6/group). (G) Detection of NF-κB signaling proteins and statistical analysis of liver tissue from SIRT4 KO mice subjected to different treatments (n=6/group). (H) mRNA expression of the inflammatory cytokines IL-1β, IL-6, CXCL10 and TNF-α in the liver tissue of SIRT4 KO mice subjected to different treatments (n=6/group). (I) MDA, GSH, SOD, CAT levels or enzyme activities in liver tissue from SIRT4 KO mice subjected to different treatments. (J) Liver Fe2+ levels in SIRT4 KO mice subjected to different treatments (n=6/group). (K) Protein detection and statistical analysis of ACSL4, SLC7A11 and GPX4 in liver tissue from SIRT4 KO mice subjected to different treatments (n=6/group). (L) mRNA expression of ACSL4, SLC7A11 and GPX4 in liver tissue from SIRT4 KO mice subjected to different treatments (n=6/group). The data are presented as mean ± SD. *P<0.05; **P<0.01.
Figure 9
Figure 9
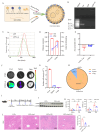
Liver-targeted LNPs-sirt4 mRNA alleviates liver I/R injury. (A) Schematic representation of the mRNA-loaded LNPs preparation. (B) The loading capacity of LNPs for Luc-mRNA was determined via agarose gel electrophoresis. (C and D) The particle size, (D) polydispersity index and (E) zeta potential of LNPs-based gene delivery systems was determined via dynamic light scattering. (F) Fluorescence imaging of organs isolated from C57BL/6 mice 24 h after the intravenous injection of LNPs loaded with Luc-mRNA. (G) Quantification of the fluorescence expression in the liver, spleen, and lung. (H) Percentage of fluorescence expression in the liver, spleen, and lung (n=3 independent samples). (I) Schematic representation of LNPs-sirt4 intervention in mice and I/R model. (J) Western blot analysis of SIRT4 protein expression in the livers of mice treated with LNP-sirt4 mRNA at 24 h postinjection (n=6/group). (K) Serum ALT and AST levels in different groups of mice (n=6/group). (L) H&E staining and necrotic area statistics of liver tissue from different mice in the indicated groups (n=6/group). The data are presented as mean ± SD. *P<0.05; **P<0.01.

References

    1. Paula Carolina Grande N, João Paulo V, Clarice Fleury F, Karina Dal Sasso M, Maria Cecília Jordani G, Paulo Roberto Barbosa E. et al. Liver ischemia and reperfusion injury. Pathophysiology and new horizons in preconditioning and therapy. Acta Cir Bras. 2018;33:723–35. - PubMed
    1. Kelly M Q, Phillip V B, Luis H T-P. Molecular responses to ischemia and reperfusion in the liver. Arch Toxicol. 2015;89:651–7. - PubMed
    1. Jiang L, Kwan M. Mechanistic Insight and Clinical Implications of Ischemia/Reperfusion Injury Post Liver Transplantation. Cell Mol Gastroenterol Hepatol. 2023;15:1463–74. - PMC - PubMed
    1. Rezà F S, Seyed Kamran Hejazi K. Liver ischemia/reperfusion injury: an overview. J Invest Surg. 2014;27:366–79.
    1. Constantinos N, Konstantinos K, Nikolaos P, Marios-Konstantinos T, Panagis M L, Kassiani T. et al. Global consequences of liver ischemia/reperfusion injury. Oxid Med Cell Longev. 2014;2014:906965.