. 2025 Jul 11;21(10):4529-4548.
doi: 10.7150/ijbs.115610. eCollection 2025.

The glucose sensor NSUN2-m5C modification regulates tumor-immune glucose metabolism reprogramming to drive hepatocellular carcinoma evolution

Affiliations

The glucose sensor NSUN2-m5C modification regulates tumor-immune glucose metabolism reprogramming to drive hepatocellular carcinoma evolution

Jing He et al. Int J Biol Sci. .

Abstract

Tumor heterogeneity and the dynamic evolution of tumor immune microenvironment (TIME) contribute to therapeutic resistance and poor clinical prognosis. To elucidate this mechanism, we first established a murine tumor evolution model (TEM) and systematically identified evolutionary core genes demonstrating progressive alterations during evolution. Subsequently, we developed a single-cell TEM through integrative analysis of hepatocellular carcinoma (HCC) clinical specimens (n=10) with external cohorts (n=11), enabling dynamic characterization of tumor-immune interactions during evolution, while addressing ethical challenges associated with obtaining tumor tissues from multiple stages in a single patient. Through TEMs analyses, we identified a contrasting glucose metabolism pattern between malignant cells and CD8+ T cells during tumor evolution. Mechanistically, glucose metabolic dominance triggers NSUN2 upregulation in tumor cells, where this functional RNA methyltransferase stabilizes key glycolytic transcripts (GLUT1, HK2, PFKM) through mRNA methylation. The NSUN2-mediated GLUT1 stabilization enhances the competitive advantage of tumor cells in glucose acquisition, creating a positive feedback loop that accelerates malignancy and exacerbates CD8+ T cell dysfunction. Building on these insights, we designed a dual-targeting strategy combining GLUT1/NSUN2 axis inhibitor WZB117 with PD-L1 blockade, which synergistically suppressed tumor evolution and reversed immunosuppression in preclinical models, suggesting a novel synergistic therapeutic strategy for treatment-resistant HCC.

Keywords: 5-methylcytosine modification; metabolic reprogramming; single-cell sequencing; tumor evolution; tumor immune microenvironment.


Conflict of interest statement

Competing Interests: The authors have declared that no competing interest exists.

Figures
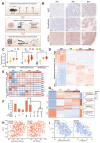
Figure 1
Figure 1
Identification of evolutionary core genes in murine tumor evolution model (TEM). A. Schematic diagram illustrating the workflow of study design and analysis. B. Immunohistochemical staining of Ki67, N-cadherin, and VEGFα in tumor tissues from an orthotopic hepatocellular carcinoma model established by the transplantation of Hepa1-6 cells into the livers of C57BL/6 mice (murine tumor evolution model, murine TEM). Tumor samples were collected at indicated time points post-transplantation, with brown signals indicating positive staining. C. Comparison of GSVA scores for pathways associated with tumor malignancy across distinct time points post-transplantation in murine TEM. Data are mean ± SD. *p < 0.05, **p < 0.01, ***p < 0.001, ****p < 0.0001, ns, non-significant by two-way ANOVA. D. Heatmap depicting the comparative gene expression profiles in tumor tissues harvested from the murine TEM at distinct time points post-transplantation, highlighting transcriptomic changes during tumor evolution. Differentially expressed genes (DEGs) were identified based on the criteria of p < 0.05 and |log2(Fold Change)| ≥ 1. E. Weighted Gene Co-Expression Network Analysis (WGCNA) identified a total of 12 merged modules. The heat map illustrates the expression level changes of co-expression modules across distinct time points post-transplantation in murine TEM. F. The intersection of DEGs with co-expression modules was further analyzed using Support Vector Machine-Recursive Feature Elimination (SVM-RFE) algorithm. The UpSet plot indicated this relationship. G. Genes clustered according to their expression patterns along tumor evolution, utilizing Mfuzz clustering analysis. H and I. Correlation between angiogenesis and cell migration GSVA enrichment scores with Mfuzz clusters: C1 & C4 (H), C3 (I) in the TCGA-LIHC cohort.
Figure 2
Figure 2
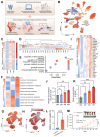
Glucose metabolic reprogramming is a crucial event during HCC evolution. A. Schematic diagram illustrating the workflow and study design for the TEM at single-cell resolution, including analytical strategies implemented in this research. B. Uniform Manifold Approximation and Projection (UMAP) plot showing cell type annotations within the HCC TIME, with corresponding color codes. C. Heatmap displaying the clustering of malignant cells based on the expression levels of evolutionary core genes in clusters C1 & C4 and C3. D. Heatmap presenting the clustering of HCC patient samples based on the proportions of tumor cells from different evolutionary stages (early, mid, and advanced) identified by the single-cell TEM. Samples labeled with “H” represent patients from the HCC cohort (n = 10), and those labeled with “G” are from the GEO dataset GSE151530 (n = 11). E. Gene Ontology (GO) enrichment analysis of characteristic genes associated with advanced stage malignant cells. F. Heatmap illustrating GSVA scores of metabolism-related pathways in malignant cells across early, mid, and advanced stages of HCC evolution. G. UMAP plot depicting the reconstructed evolutionary trajectory of malignant cells using the Slingshot algorithm. Cells from early, mid, and advanced stages are classified based on the TEM at single-cell resolution. H. UMAP plot demonstrating the GSVA scores for the glycolysis pathway along the Slingshot-inferred trajectory of malignant cells. I. Heatmap showing the expression levels of glycolysis pathway genes during HCC evolution in the murine TEM. J and K. The content of pyruvic acid (J) and lactate (K) in tumor cells or tissues derived from murine TEM at the indicated time after transplantation. L and M. Tumor weight (L) and volumes (M) were measured in an in vivo syngeneic tumorigenesis assay by subcutaneously injecting Hepa1-6 cells into C57BL/6 mice. The experimental group received drinking water supplemented with 15% glucose, while the control group received regular drinking water (n = 6 animals/group). Data are mean ± SD. *p < 0.05, **p < 0.01, ***p < 0.001, ****p < 0.0001, ns, non-significant by Student's t test (L and M) or by two-way ANOVA (J and K).
Figure 3
Figure 3
Malignant cells suppress CD8+ T cells glucose metabolism to promote immune evasion. A. Immunohistochemical staining of CD8 in the tumor samples from murine TEM, with brown signals indicating positive staining. M01-M03 represent three independent biological replicates (n=3). B. Quantification of CD8-positive areas was performed in the tumor samples from murine TEM. C. The heatmap illustrates the changes in cell-cell interaction strength between advanced and early/mid samples as assessed by CellChat analysis. Cell type annotations are indicated along the axes, with colors representing the relative strength of interactions. D. Gene Ontology (GO) enrichment analysis of characteristic genes associated with advanced stage CD8+ T cells. E. Heatmap depicting GSVA scores of metabolism-related pathways in CD8+ T cells across early, mid, and advanced stages of HCC evolution. F. UMAP plot showing the reconstructed evolutionary trajectory of CD8+ T cells using the Slingshot algorithm. Cells from early, mid, and advanced stages are classified according to the single-cell TEM. G. UMAP plot demonstrating GSVA scores for the glycolysis pathway along the Slingshot-inferred trajectory of CD8+ T cells. H. OT-1 CD8+ T cells were co-cultured with OVA-Hepa1-6 cells, while Jurkat cells were co-cultured with Huh7 cells (all at 1:1 ratio) for 48 hours in medium containing 5.5 mM glucose. Subsequently, intracellular glucose levels were measured separately in CD8+ T cells (left) and Jurkat cells (right). I. Glycolysis-related gene expression in OT-1 CD8+ T cells was compared between control (isolated) and OVA-Hepa1-6 co-cultured groups (1:1 ratio in 5.5 mM glucose medium). All expression levels were normalized to β-actin. J. Changes in glucose uptake capacity in OT-1 CD8+ T cells following 48 hours of co-culture with OVA-Hepa1-6 cells at a 1:1 ratio in the medium containing 5.5 mM glucose, measured using flow cytometry to detect fluorescence intensity of 2-NBDG. K and L. Following co-culture with OVA-Hepa1-6 cells at 1:1 or 1:10 ratios in 5.5 mM glucose medium for 48 hours, CD8+ T cells were analyzed for extracellular acidification rate (ECAR) using sequential exposure to 10 mM glucose, 1 μM oligomycin, and 50 mM 2-DG (K). Three replicate measurements were performed per condition. Glycolysis was calculated as ECAR increase post-glucose addition, while glycolytic capacity represented the difference between maximal ECAR (post-oligomycin) and ECAR following 2-DG inhibition (L). M and N. OT-1 CD8+ T cells were activated with the OVA-derived peptide SIINFEKL for five days. The culture medium was supplemented with either 10 mM or 20 mM of 2-DG and either 10 µM or 20 µM of BAY-876. Expression levels of TNF-α and IFN-γ were analyzed by flow cytometry, with percentages of TNF-α+ (M) and IFN-γ+ (N) cells represented as bar graphs. O. The upper panel shows basal death of OVA-Hepa1-6 cells cultured in 5.5 mM glucose medium ±10 µM WZB117 (without CD8+ T cells) as control. The lower panel demonstrates cytotoxic activity of activated OT-1 CD8+ T cells against OVA-Hepa1-6 cells after 24 hours co-culture in 5.5 mM glucose medium. Data are mean ± SD. *p < 0.05, **p < 0.01, ***p < 0.001, ****p < 0.0001, ns, non-significant by Student's t test (H and J) or by two-way ANOVA (B and L-N).
Figure 4
Figure 4
NSUN2-mediated m5C modification regulates metabolic reprogramming in a glucose-dependent manner. A. Through the intersection of publicly available data from biotin-labeled glucose pull-down, affinity chromatography, and click chemistry analyses, NSUN2, ADAR and IGF2BP3 were identified as candidate proteins that directly interact with glucose. B. The expression level of NSUN2 in the murine TEM. C. UMAP plot demonstrating the expression level of NSUN2 in the single-cell TEM. D. Real-time qPCR analysis of Huh7 and HCCLM3 cells starved with glucose and restoration at indicated concentrations (25, 11, and 5.5 mM) (n = 3 biological replicates). E and F. Immunoblotting analysis of Huh7 (E) and HCCLM3 (F) cells after 6 hours of glucose starvation followed by 2 hours of glucose restoration at indicated concentrations (25, 11, and 5.5 mM). G. Immunoblot analysis from subcutaneous tumor models established using Hepa1-6 cells in C57BL/6 mice. The experimental group was provided with drinking water containing 15% glucose, while the control group received regular drinking water (n = 6 animals per group). H. Transwell migration assays assessing the migratory capacity of shNC and shNSUN2 Huh7 cells (n = 3 biological replicates). I and J. Tumor weight (I) and volumes (J) were measured in the in vivo syngeneic tumorigenesis assay of shNC and shNSUN2 Hepa1-6 cells subcutaneously inoculated in C57BL/6 mice (n = 6 animals/group). K. Huh7 cells without or with glucose starvation for 4 hours and restored with glucose (5.5 mM) 2 hours before dot blot assay of m5C levels (total RNA) (n = 3 biological replicates). L. shNC and shNSUN2 Huh7 cells were glucose starved for 4 hours and restored with glucose (5.5 mM) 2 hours for dot blot assay (n = 3 biological replicates). M. GO enrichment analysis of the genes with differential m5C methylation levels between shNC and shNSUN2 cells. N. RNA-IP using anti-m5C antibody, followed by real-time qPCR analysis in shNC and shNSUN2 Huh7 cells with glucose (5.5 mM) (n = 3 biological replicates). O. RT-qPCR was applied for detection of endogenous GLUT1, HK2, PFKM mRNA immunoprecipitated with NSUN2 (1:100, 4 °C, overnight). P and Q. RNA decay assay in shNC and shNSUN2 Huh7 cells treated with actinomycin D (Act. D, 5 μg/mL), glucose starved and restored with glucose. Real-time qPCR against β-actin was performed to assess the half-life of GLUT1 (P) and HK2 (Q) mRNA (n = 3 biological replicates). R. Immunoblotting analysis of shNC and shNSUN2 Huh7 cells after 6 hours of glucose starvation and subsequent 2 hours of restoration with 5.5 mM glucose. S. The glucose uptake capacity in shNC and shNSUN2 Huh7 cells, measured using flow cytometry to detect fluorescence intensity of 2-NBDG (n = 3 biological replicates). T. Glucose content in the supernatant of shNC and shNSUN2 Huh7 cells after 48 hours of treatment with or without 5.5 mM 2-DG. U and V. Measurements were recorded over time, with exposure to glucose, oligomycin, and 2-DG for ECAR assessment. ECAR in shNC and shNSUN2 Huh7 cells was recorded three times per condition (U). Glycolysis (ECAR following glucose addition) and glycolytic capacity (maximal ECAR after subtracting the ECAR following 2-DG exposure) were calculated (V). W and X. Comparison of the relative pyruvic acid (W) and lactate (X) production between shNC and shNSUN2 Huh7 cells. Data are mean ± SD. *p < 0.05, **p < 0.01, ***p < 0.001, ****p < 0.0001, ns, non-significant by Student's t test (I-J, N-O, S and V-X) or by two-way ANOVA (B, D, P-Q and T).
Figure 5
Figure 5
The glucose-competition/NSUN2 axis drives tumor evolution and CD8+ T cells dysfunction. A. Proliferation of shNC and shNSUN2 Huh7 cells, evaluated by CCK-8 (Cell Counting Kit-8) assays (n = 3 biological replicates). Cells were cultured in media containing 5.5 mM or 25 mM glucose. B. Transwell migration assays assessing the migratory capacity of shNC and shNSUN2 Huh7 cells (n = 3 biological replicates). Cells were cultured in media containing 5.5 mM or 25 mM glucose. C-E. Tumor weight (C) and tumor volumes (D) were measured were measured in the in vivo syngeneic tumorigenesis assay of shNC and shNSUN2 Hepa1-6 cells subcutaneously inoculated in C57BL/6 mice (n = 6 animals/group). Immunoblot analysis (E) of key glycolysis proteins in harvested tumor tissues. Mice in the glucose-supplemented group received drinking water containing 15% glucose, while the control group was provided with regular drinking water. F. Immunohistochemical staining of Ki67, N-cadherin, VEGFα and CD8 was performed on the in vivo syngeneic tumorigenesis assay of shNC and shNSUN2 Hepa1-6 cells subcutaneously inoculated in C57BL/6 mice. Mice in the glucose-supplemented group received drinking water containing 15% glucose, while the control group was provided with regular drinking water. Brown signals indicate positive staining for the respective markers. G. Quantification of CD8-positive areas in the tumor samples as described in (F). H. Glucose uptake in OT-1 CD8+ T cells was measured by 2-NBDG fluorescence (flow cytometry) after 48 hours co-culture with shNC or shNSUN2 OVA-Hepa1-6 cells (1:1 ratio) in 5.5 mM glucose medium. I. Glycolysis-related gene expression (normalized to β-actin) in OT-1 CD8+ T cells following 48 hours co-culture with shNC/shNSUN2 OVA-Hepa1-6 cells (1:1 ratio) in 5.5 mM glucose medium ±10 µM WZB117. J and K. ECAR analysis of OT-1 CD8+ T cells after 48h co-culture with shNC/shNSUN2 OVA-Hepa1-6 (1:1 ratio) in 5.5 mM glucose medium. Measurements were recorded over time, with exposure to glucose, oligomycin, and 2-DG for ECAR assessment. ECAR was recorded three times per condition (J). Glycolysis (ECAR following glucose addition) and glycolytic capacity (maximal ECAR after subtracting the ECAR following 2-DG exposure) were calculated (K). L and M. OVA-specific TCR transgenic OT-1 CD8+ T cells were activated with the OVA-derived peptide SIINFEKL for five days. Subsequently, these activated OT-1 CD8+ T cells cells were co-cultured with shNC or shNSUN2 OVA-Hepa1-6 cells at ratios of 1:1 for 48 hours in 5.5 mM glucose medium, in the presence or absence of 10 µM WZB117. The expression levels of TNF-α and IFN-γ in OT-1 CD8+ T cells were analyzed by flow cytometry. Percentages of TNF-α+ (L) and IFN-γ+ cells (M) are shown as bar graphs. N. The upper panel illustrates the natural cell death of shNC and shNSUN2 OVA-Hepa1-6 cells cultured in 5.5 mM glucose medium in the absence of co-culture with OT-1 CD8+ T cells, serving as a control for baseline cell death. The lower panel demonstrates the cytotoxic activity of activated OT-1 CD8+ T cells toward shNC and shNSUN2 OVA-Hepa1-6 cells following 24 hours of co-culture in 5.5 mM glucose medium. Data are mean ± SD. *p < 0.05, **p < 0.01, ***p < 0.001, ****p < 0.0001, ns, non-significant by two-way ANOVA (A-D, G-H and K-M).
Figure 6
Figure 6
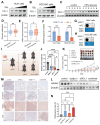
Immunometabolic therapy overcomes HCC resistance to immune checkpoint inhibitors. A and B. Immunoblotting analysis of Huh7 (A) and HCCLM3 (B) cells starved with glucose and restored with indicated concentrations of glucose (25 ,11 and 5.5 mM) (n = 3 biological replicates). C. Immunoblot analysis from subcutaneous tumor models established using Hepa1-6 cells in C57BL/6 mice. The experimental group was provided with drinking water containing 15% glucose, while the control group received regular drinking water (n = 6 animals per group). D and E. Comparison of mRNA methyltransferase activity (D) and glucose metabolism activity (E) between immune therapy responders and non-responders, as predicted by the TIDE algorithm in the TCGA-LIHC cohort. F. Intracellular glucose levels in Huh7 and HCCLM3 cells with or without 10 μM WZB117 treatment for 8 hours. G and H. m5C levels (total RNA) in Huh7 (G) and HCCLM3 (H) cells treated with or without 10 μM WZB117 for 8 hours, as measured by dot blot assay (n = 3 biological replicates). I. Schematic diagram illustrating the combined therapy regimen of WZB117 and anti-PD-L1 in the in vivo syngeneic tumorigenesis assay of Hepa1-6 cells subcutaneously inoculated in C57BL/6 mice (n = 6 animals per group). J and K. Tumor weight (J) and tumor volumes (K) were measured on the in vivo syngeneic tumorigenesis assay of Hepa1-6 cells subcutaneously inoculated in C57BL/6 mice (n = 6 animals per group). The groups included the control group, WZB117 monotherapy, anti-PD-L1 monotherapy, and the combined treatment group. L. Immunoblotting analysis was performed on the in vivo syngeneic tumorigenesis assay of Hepa1-6 cells subcutaneously inoculated in C57BL/6 mice. The experimental groups included the control group, WZB117 monotherapy, anti-PD-L1 monotherapy, and the combined treatment group. M. Immunohistochemical staining for Ki67, N-cadherin, VEGFα, and CD8 was performed on the in vivo syngeneic tumorigenesis assay of Hepa1-6 cells subcutaneously inoculated in C57BL/6 mice. The groups included the control group, WZB117 monotherapy, anti-PD-L1 monotherapy, and the combined treatment group. Brown staining indicates positive expression of the respective markers. N. Quantification of CD8-positive areas in the tumor samples as described in (M). Data are mean ± SD. *p < 0.05, **p < 0.01, ***p < 0.001, ****p < 0.0001, ns, non-significant by Student's t test (D-F) or by two-way ANOVA (J-K and N).

References

    1. Fleming BD, Urban DJ, Hall MD, Longerich T, Greten TF, Pastan I. et al. Engineered Anti-GPC3 Immunotoxin, HN3-ABD-T20, Produces Regression in Mouse Liver Cancer Xenografts Through Prolonged Serum Retention. Hepatology. 2020;71:1696–711. - PMC - PubMed
    1. Xu Q, Li Y, Gao X, Kang K, Williams JG, Tong L. et al. HNF4alpha regulates sulfur amino acid metabolism and confers sensitivity to methionine restriction in liver cancer. Nat Commun. 2020;11:3978. - PMC - PubMed
    1. Pan R, Ryan J, Pan D, Wucherpfennig KW, Letai A. Augmenting NK cell-based immunotherapy by targeting mitochondrial apoptosis. Cell. 2022;185:1521–38. e18. - PMC - PubMed
    1. Sharma P, Allison JP. Dissecting the mechanisms of immune checkpoint therapy. Nat Rev Immunol. 2020;20:75–6. - PubMed
    1. Li M, Bhoori S, Mehta N, Mazzaferro V. Immunotherapy for hepatocellular carcinoma: The next evolution in expanding access to liver transplantation. J Hepatol. 2024;81:743–55. - PubMed