. 2025 Jun 23;21(10):4293-4311.
doi: 10.7150/ijbs.117443. eCollection 2025.

Inhibition of Mettl3 alleviates low-dose cisplatin-induced renal fibrosis and enhances the chemotherapeutic efficacy in mouse models of cancer

Affiliations

Inhibition of Mettl3 alleviates low-dose cisplatin-induced renal fibrosis and enhances the chemotherapeutic efficacy in mouse models of cancer

Yuxin Xie et al. Int J Biol Sci. .

Abstract

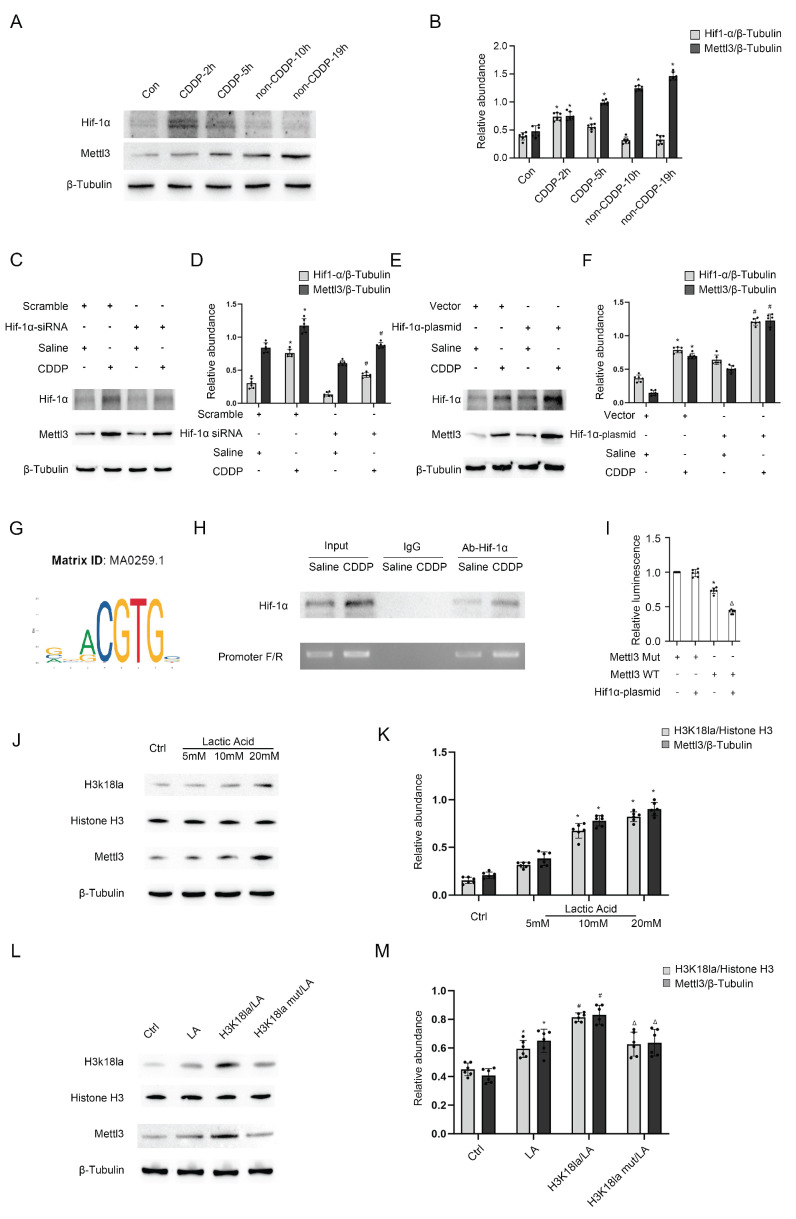
Cisplatin (CDDP), a commonly utilized anti-tumor drug, leads to acute kidney injury (AKI) and chronic kidney disease (CKD). The mechanisms and therapeutic approaches for injury in AKI have been extensively studied, but the mechanisms resulting in CKD are poorly comprehended and intervention methods are scarce. In the current study, we found that under different phases of the repeated low-dose CDDP treatment, Mettl3 expression was induced by two different mechanisms. In the presence of CDDP, the transcription factor Hif1-α was induced, resulting in an increase in Mettl3. When CDDP was removed, the previously increased Mettl3 caused an elevated lactate level, which formed a positive feedback loop by mutually reinforcing each other's expression via H3K18 lactylation. Functionally, we disclose that the knockout of Mettl3 in proximal tubules mitigates repeated low-dose CDDP-induced renal fibrosis both in vitro and in vivo. Mechanistically, Mettl3 stabilizes Pfkfb3 mRNA through N6-methyladenosine (m6A) modification and subsequently induces lactate production to upregulate the PD-L1 expression via H3K18 lactylation, thereby promoting both tumor growth and CDDP-induced renal damage. Intriguingly, we discovered that Levosimendan suppresses the methyltransferase activity of Mettl3 to lower the m6A level but has no impact on the abundance of the Mettl3-Mettl14 complex. PLGA-encapsulated Levosimendan not only alleviates repeated low-dose CDDP-induced renal fibrosis, but also significantly enhances the chemotherapeutic effects of cisplatin in several xenograft and syngeneic mouse tumor models by suppressing the Mettl3/Pfkfb3/lactate/ H3K18la/PD-L1 axis. Collectively, targeting Mettl3 might offer an effective therapeutic strategy during cisplatin-based chemotherapy-induced renal fibrosis, and PLGA-encapsulated Levosimendan is a potential intervention approach.

Keywords: Mettl3; acute kidney injury; renal fibrosis.


Conflict of interest statement

Competing Interests: The authors have declared that no competing interest exists.

Figures

Figure 1
Figure 1
The establishment of repeated low-dose CDDP-induced AKI-CKD models both in vitro and in vivo. A. Schematic diagram depicting the establishment of the in vitro model. Briefly, for each day within 1-3days, BUMPT cells are cultured in the medium with a low dose (1,2,5μM) of CDDP for 5 hours and then in the normal medium for 19 hours. B&C. Western blot analysis for Mettl3 and fibrotic markers FN, Col I & Col III in BUMPT cells treated with saline or 1,2,5μM CDDP for 3 days, with β-Tubulin as the internal reference. D&E. Western blot analysis for Mettl3 and fibrotic markers FN, Col I & Col III in BUMPT cells treated with saline or 5μM CDDP for 1,2,3 days, with β-Tubulin as the internal reference. F. Immunofluorescence staining of Mettl3. (scale bar: 20 μm). G. Schematic diagram depicting the establishment of the in vivo model. Briefly, grouped mice are either intraperitoneally injected with 8mg/kg CDDP or the same volume of saline once a week for 4 weeks, and then sacrificed 7,14 or 28 days later for sample collection. H&I, Measurements of renal function indicators BUN and serum creatinine. J-L. Masson's trichrome staining presenting the area of kidney fibrosis (scale bar: 100 μm) and immunohistochemical staining presenting the expression level of Mettl3 (scale bar: 100 μm). M. Correlation analysis of Mettl3 positive percentage and fibrotic area. N&O. Western blot analysis for Mettl3 and fibrotic markers FN, Col I & Col III in mice kidney samples collected 7, 14 or 21 days after 4 weeks of CDDP(8mg/kg) treatment, with β-Tubulin as the internal reference. Data are expressed as mean ± SD (n = 6). *P < 0.05 versus saline or control.
Figure 2
Figure 2
Mettl3 mediates repeated low-dose CDDP-induced tubular cell fibrosis. For suppression of Mettl3 expression, stable cell line of Mettl3 knockdown by lentivirus delivered shRNA was constructed. A&B. Western blot analysis for Mettl3 and fibrotic markers FN, Vimentin, Col I & Col III in Sr-shRNA transfected cell line and Mettl3-shRNA transfected cell line treated with saline or 5μM CDDP for 3 days. To enhance Mettl3 expression, the Mettl3 plasmid was transfected into BUMPT cells before CDDP treatment. C&D. Western blot analysis for Mettl3 and fibrotic markers FN, Vimentin, Col I & Col III in BUMPT cells treated with saline or 5μM CDDP for 3 days. Data are expressed as mean ± SD (n = 6). *P < 0.05 versus saline. #0.05 versus Sr-shRNA/CDDP or Vector/CDDP.
Figure 3
Figure 3
Mettl3 regulates the expression of Pfkfb3 through m6A modification. 3 groups of differently treated cells (NC / Saline, NC / CDDP, and Mettl3 KD/ CDDP) were used for RIP-seq analysis. A. The heatmap depicting genes' expression level (n=3, mixed samples). B. Go analysis. C. Differentially expressed mRNAs (fold change>3). D. Prediction of m6A binding sites along the Pfkfb3 sequence. 5μg/mL E. Actinomycin-D was introduced into the Sr/Mettl3-shRNA stable cell lines, and then the Pfkfb3 mRNA level at the indicated time points were detected through RT-qPCR analysis. *P < 0.05 versus Sr-shRNA. F. RIP-PCR of the two predicted binding sites with the highest score. G&H. Luciferase activity detection following co-transfection. *P < 0.05 versus Pfkfb3 Mut group. ΔP<0.05 versus other groups. I, J&K. RT-qPCR and Western blot analysis for Mettl3 and Pfkfb3 in Sr-shRNA or Mettl3-shRNA cell lines with or without CDDP treatment. L, M&N. RT-qPCR and Western blot analysis for Mettl3 and Pfkfb3 in vector or Mettl3 plasmid transfected BUMPT cells with or without CDDP treatment. Data are expressed as mean ± SD (n = 6). *P < 0.05 versus saline. # P <0.05 versus Sr-shRNA/CDDP or Vector/CDDP.
Figure 4
Figure 4
Pfkfb3 mediates repeated low-dose CDDP-induced tubular cell fibrosis. Pfkfb3 siRNA or plasmid was transfected into BUMPT cells before CDDP treatment. A&B. Western blot analysis for Pfkfb3 and fibrotic markers FN, Vimentin, Col I & Col III in nonsense control (NC) siRNA or Pfkfb3 siRNA transfected BUMPT cells treated with saline or 5μM CDDP for 3 days. C&D. Western blot analysis for Pfkfb3 and fibrotic markers FN, Vimentin, Col I & Col III in vector or Pfkfb3 plasmid transfected BUMPT cells treated with saline or 5μM CDDP for 3 days. Data are expressed as mean ± SD (n = 6). *P < 0.05 versus NC/saline or vector/saline. #P < 0.05 versus NC/CDDP or Vector/CDDP.
Figure 5
Figure 5
Pfkfb3 regulates renal cell fibrosis via lactate/H3K18la/PD-L1 axis. A. Schematic diagram depicting the role of Pfkfb3 in the lactate production process during glycolysis. B. Relative medium pyruvate level of BUMPT cells in different phases of the CDDP treatment. C. Relative medium lactate level of BUMPT cells in different phases of the CDDP treatment. *P < 0.05 versus day 1. D. Relative medium pyruvate level of BUMPT cells transfected with NC/Pfkfb3 siRNA plus CDDP treatment. E. Relative medium lactate level of BUMPT cells transfected with NC/Pfkfb3 siRNA plus CDDP treatment. F. Schematic diagram depicting the culture of NIH/3T3 cells using CDDP-treated BUMPT cell medium. G&H. Western blot analysis for fibrotic markers FN, Col I & Col III in NIH/3T3 cells treated with conditioned medium for 24, 48 and 72 hours. I&J. Western blot analysis for fibrotic markers FN, Col I & Col III in NIH/3T3 cells treated with conditioned medium or conditioned medium/NaHCO3 for 72 hours. K&L. Western blot analysis for PD-L1 and fibrotic markers FN, Col I & Col III in NIH/3T3 cells treated with lactate (5, 10, and 20 mM) for 24hours. M&O. Western blot analysis for Histone H3, H3k18la and PD-L1 in NIH/3T3 cells under lactate treatment after transfected with scramble/H3K18la mutant. N&P. Western blot analysis for Histone H3, H3k18la and PD-L1 in NIH/3T3 cells under lactate treatment after transfected with vector/H3K18la plasmid. Q&R. Western blot analysis for PD-L1 and fibrotic markers FN, Vimentin, Col I & Col III in NIH/3T3 cells under lactate treatment after PD-L1 inhibition. S&T. Western blot analysis for PD-L1 and fibrotic markers FN, Vimentin, Col I & Col III in NIH/3T3 cells under lactate treatment after co-transfection of Mettl3 plasmid and Pfkfb3 siRNA. Data are expressed as mean ± SD (n = 6). *P < 0.05 versus NC/saline. #0.05 versus plasmid/lactate. ΔP<0.05 versus Mettl3 plasmid/lactate group.
Figure 6
Figure 6
Both Hif1-α and H3K18la lactylation mediates Mettl3 expression during CDDP treatment. A&B. Western blot analysis for Hif1-α in different phases of the CDDP treatment. C&D. Western blot analysis for Hif1-α and Mettl3 in BUMPT cells treated with saline or CDDP (5μM, 2h) after NC/Hif1-α siRNA transfection. E&F. Western blot analysis for Hif1-α and Mettl3 in BUMPT cells treated with saline or CDDP (5μM, 2h) after vector/Hif1-α plasmid transfection. G. Illustration of predicted binding site of Hif1-α and Mettl3 promoter region. H. ChIP-PCR analysis of the binding site using Hif1-α antibody. I. Luciferase activity detection following co-transfection. *P < 0.05 versus Mettl3 Mut group. ΔP < 0.05 versus other groups. J&K. Western blot analysis for Histone 3, H3K18la and Mettl3 in BUMPT cells treated with lactate (5, 10, and 20 mM) for 24hours. L&M. Western blot analysis for Histone H3, H3K18la and Mettl3 in BUMPT cells treated with 20mM lactate after H3K18la mutant or plasmid transfection. Data are expressed as mean ± SD (n = 6). *P < 0.05 versus NC/saline. #0.05 versus plasmid/lactate.
Figure 7
Figure 7
Proximal tubular deletion of Mettl3 ameliorates CDDP-induced renal fibrosis. Littermate PT-Mettl3-WT and PT-Mettl3-KO mice of the same age and weight were grouped for saline or CDDP intraperitoneal injection as previously described. A. H&E staining. B. Masson's trichrome staining. C. Tubular damage score. D. Area of fibrosis. E. IHC staining of fibrotic markers FN, Col I, Col III and α-SMA. F&G. Western blot analysis for Mettl3, Pfkfb3, PD-L1 and fibrotic markers FN, Col I, Col III and α-SMA in mice kidneys from different groups. H. Relative lactate level of the kidney. Data are expressed as mean ± SD (n = 6). *P < 0.05 versus PT-Mettl3-WT/saline. #0.05 versus PT-Mettl3-WT/CDDP.
Figure 8
Figure 8
PLGA encapsulated Levosimendan mitigates CDDP-induced renal fibrosis. No load or Levosimendan loaded PLGA nanoparticles were injected into grouped (Saline/CDDP) littermate male C57BL/6 mice of the same age and weight. A. Structural prediction of the interaction between Mettl3-Mettl14 and Levosimendan. B. IP assay of Mettl3 and Mettl14 under Levosimendan interference. C. m6A dot blot of BUMPT cells under saline or Levosimendan treatment. D. Methytransferase activity assay. E. NTA measurement of no load PLGA and Levosimendan/PLGA. F. SEM and TEM observation of no load PLGA and Levosimendan/PLGA. G. H&E staining. H. Tubular damage score. I. Masson's trichrome staining. J. Area of fibrosis. K. IHC staining of fibrotic markers FN, Col I, Col III and α-SMA. F&G. L. Western blot analysis for Mettl3, Pfkfb3, PD-L1 and fibrotic markers FN, Col I, Col III and α-SMA in mice kidneys from different groups. Data are expressed as mean ± SD (n = 6). *P < 0.05 versus PLGA/saline. #0.05 versus PLGA/CDDP.
Figure 9
Figure 9
PLGA encapsulated-Levosimendan enhances CDDP efficacy in xenograft models of ovarian, bladder, and breast cancer. Nude mice were inoculated with A2780 ovarian cancer cells or MDM-231 breast cancer cells or T24 bladder cancer cells to build tumor xenografts. When the tumors reached approximately 200mm3, randomly group the nude mice into the PLGA group, the PLGA/CDDP group and the PLGA encapsulated- Levosimendan/CDDP group for subsequent weekly treatment. A, E&I. Representative images of the dissected tumors. B, F&J. Tumor volume measurements. CD, GH&KL. Western blot analysis of Mettl3, Pfkfb3 and PD-L1 in the dissected tumors. *P < 0.05 versus ctrl. #0.05 versus CDDP.

Similar articles

References

    1. Tang C, Livingston MJ, Safirstein R, Dong Z. Cisplatin nephrotoxicity: new insights and therapeutic implications. Nat Rev Nephrol. 2023;19:53–72. - PubMed
    1. Dasari S, Tchounwou PB. Cisplatin in cancer therapy: molecular mechanisms of action. Eur J Pharmacol. 2014;740:364–78. - PMC - PubMed
    1. Klumpers MJ, Witte W, Gattuso G, Schiavello E, Terenziani M, Massimino M. et al. Genome-Wide Analyses of Nephrotoxicity in Platinum-Treated Cancer Patients Identify Association with Genetic Variant in RBMS3 and Acute Kidney Injury. J Pers Med. 2022;12:892. - PMC - PubMed
    1. Latcha S, Jaimes EA, Patil S, Glezerman IG, Mehta S, Flombaum CD. Long-Term Renal Outcomes after Cisplatin Treatment. Clin J Am Soc Nephrol. 2016;11:1173–9. - PMC - PubMed
    1. Su H, Ye C, Lei CT, Tang H, Zeng JY, Yi F. et al. Subcellular trafficking of tubular MDM2 implicates in acute kidney injury to chronic kidney disease transition during multiple low-dose cisplatin exposure. Faseb j. 2020;34:1620–36. - PubMed