. 2024 Aug 21;1(4):100024.
doi: 10.1016/j.bvth.2024.100024. eCollection 2024 Dec.

Rising total leukocyte counts correspond with rising platelet counts in thrombotic thrombocytopenic purpura

Affiliations

Rising total leukocyte counts correspond with rising platelet counts in thrombotic thrombocytopenic purpura

Noelle I Samia et al. Blood Vessel Thromb Hemost. .

Abstract

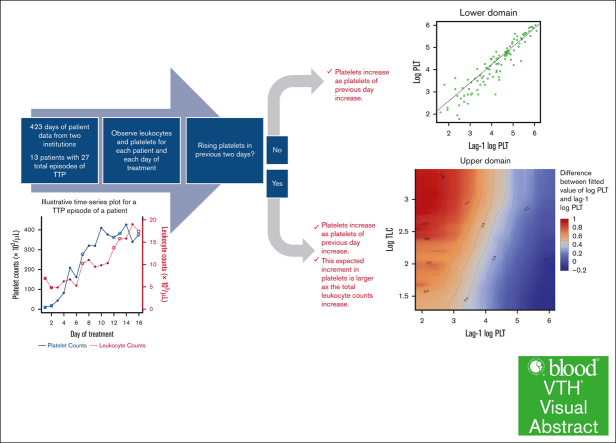
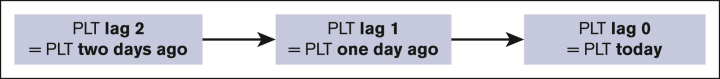
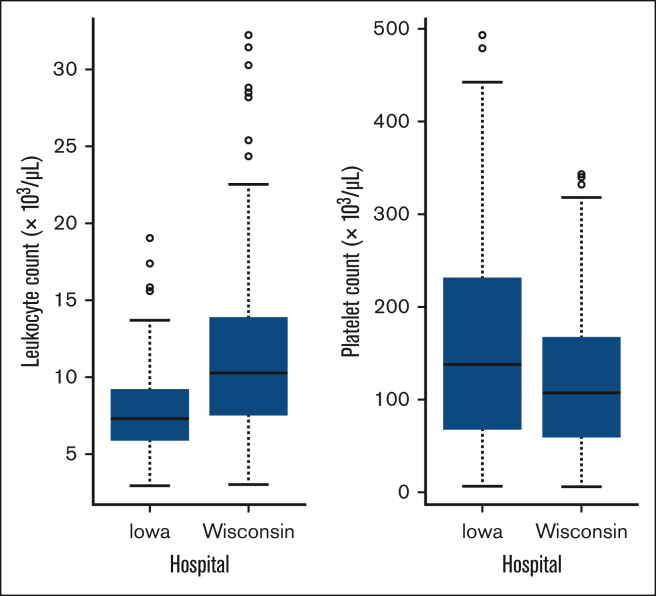
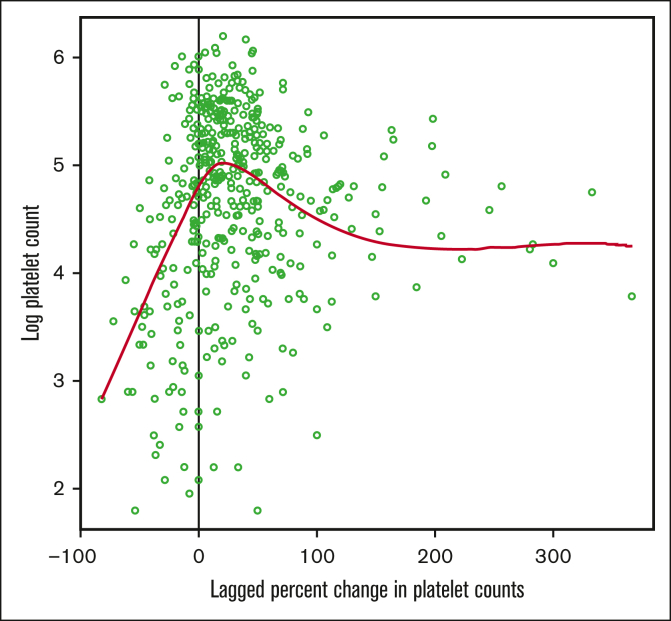
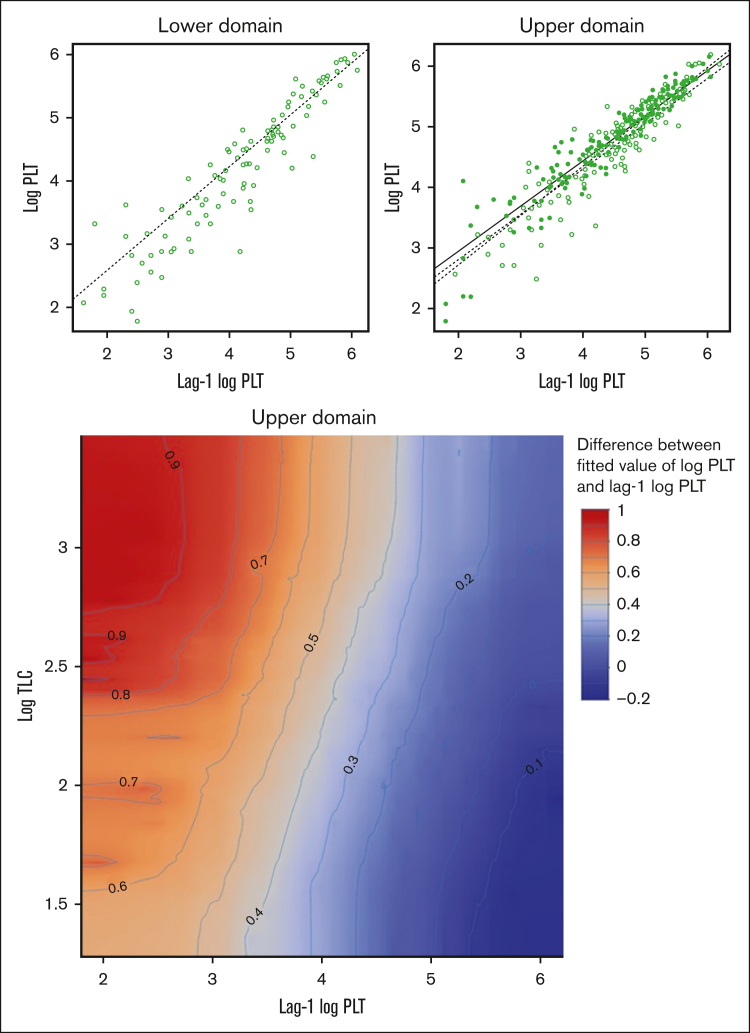
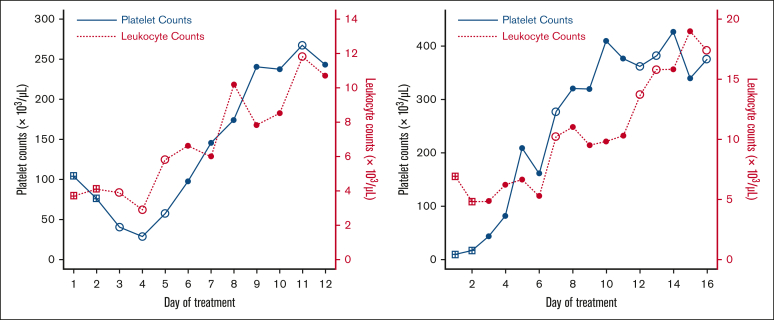
Thrombotic thrombocytopenic purpura (TTP) is a rare disorder involving pathological platelet-von Willebrand factor interaction, resulting in microvascular thrombosis. The consumption of platelets in TTP microthrombi results in severe thrombocytopenia which resolves with resolution of the microvascular thrombosis. Over the course of treatment, patient platelet counts often rise and fall multiple times before stable remission is achieved. On casual inspection, we noted that total leukocyte counts follow a pattern that appears to correspond to platelet counts. To explore whether changing leukocyte counts track significantly with changing platelet counts, we examined paired daily platelet counts and total leukocyte counts in 27 episodes of TTP in 13 patients across 2 institutions comprising 423 days of data. We modeled the nonlinear behavior in the data using a threshold mixed-effects regression model, in which we found a significant temporal relationship between total leukocyte counts and platelet counts. The model proved that, on a day when platelet counts were rising in previous days, the total leukocyte count is predictive of the rise in platelet count. The higher the total leukocyte count, the greater the rise in platelet count. Our results support the hypothesis that leukocytes play a role in the resolution of TTP microvascular thrombosis.


Conflict of interest statement

Conflict-of-interest disclosure: The authors declare no competing financial interests.

Figures

None
Graphical abstract
Figure 1.
Figure 1.
A schematic diagram to describe the lag for PLT in simple terms. The arrows are placed in chronological order.
Figure 2.
Figure 2.
Box plots of the TLCs and the PLTs per hospital.
Figure 3.
Figure 3.
Plot of log PLTs vs lagged percentage change in PLTs between the last 2 consecutive days. The red curve is a loess smoother that illustrates the nonlinear dynamic structure in the data. The vertical line indicates the location of the estimated threshold parameter at −0.425%.
Figure 4.
Figure 4.
Analytical scheme of the final fitted model in both the upper and lower domains of PLT data. The top panel shows a plot of log PLTs vs log PLTs of the previous day for the lower domain (left panel) and the upper domain (right panel). The dotted line is the fitted value of log PLTs without correcting for the effect of the TLCs. The dotted line in the lower domain is plotted using the parameter estimates in Table 1; however, the dotted line in the upper regime is plotted based on the results of fitting a linear regression to the observations in the plot. The open circles represent observations whose log TLCs are less than or equal to their overall mean value of 2.1. The solid circles represent the observations whose log TLCs are above their overall mean value of 2.1. The dotted line is the fitted line of log PLTs when log TLCs are fixed at 1.814, the mean value of the observations indicated in open circles. The solid line is the fitted line of log PLTs when log TLCs are fixed at 2.453, the mean value of the observations indicated in solid circles. The bottom panel shows a contour plot illustrating the effect of lag-1 log PLT and log TLC on the difference between the fitted value of log PLT and lag-1 log PLT, in the upper domain. In the upper domain, controlling for lag-1 log PLT (ie, for a fixed value of lag-1 log PLT), as log TLC increases, the expected difference between the fitted value of log PLT and lag-1 PLT increases and is positive.
Figure 5.
Figure 5.
Time-series plots of PLTs (solid blue) and TLCs (dotted red) for 1 episode in 2 patients illustrating concordance in changes in counts. The observations indicated with a square do not belong to any domain because the data at these time points have their lagged PLTs (lag 1 PLT and lag 2 PLT) missing. The observations indicated with an open circle belong to the lower domain (with lagged percent change in PLT less than or equal to −0.00425), and with a solid circle belong to the upper domain.

Similar articles

References

    1. Graça NAG, Joly BS, Voorberg J, et al. TTP: from empiricism for an enigmatic disease to targeted molecular therapies. Br J Haematol. 2022;197(2):156–170. - PMC - PubMed
    1. Subhan M, Scully M. Advances in the management of TTP. Blood Rev. 2022;55 - PubMed
    1. Furlan M, Robles R, Galbusera M, et al. von Willebrand factor–cleaving protease in thrombotic thrombocytopenic purpura and the hemolytic–uremic syndrome. N Engl J Med. 1998;339(22):1578–1584. - PubMed
    1. Tsai H-M, Lian EC-Y. Antibodies to von Willebrand factor–cleaving protease in acute thrombotic thrombocytopenic purpura. N Engl J Med. 1998;339(22):1585–1594. - PMC - PubMed
    1. Masias C, Cataland SR. The role of ADAMTS13 testing in the diagnosis and management of thrombotic microangiopathies and thrombosis. Blood. 2018;132(9):903–910. - PubMed

LinkOut - more resources