. 2024 Oct 25;7(20):24160-24171.
doi: 10.1021/acsanm.4c04888. Epub 2024 Oct 9.

Superparamagnetic Iron Oxide Nanoparticle-Labeled Extracellular Vesicles for Magnetic Resonance Imaging of Ischemic Stroke

Affiliations

Superparamagnetic Iron Oxide Nanoparticle-Labeled Extracellular Vesicles for Magnetic Resonance Imaging of Ischemic Stroke

Shannon Helsper et al. ACS Appl Nano Mater. .

Abstract

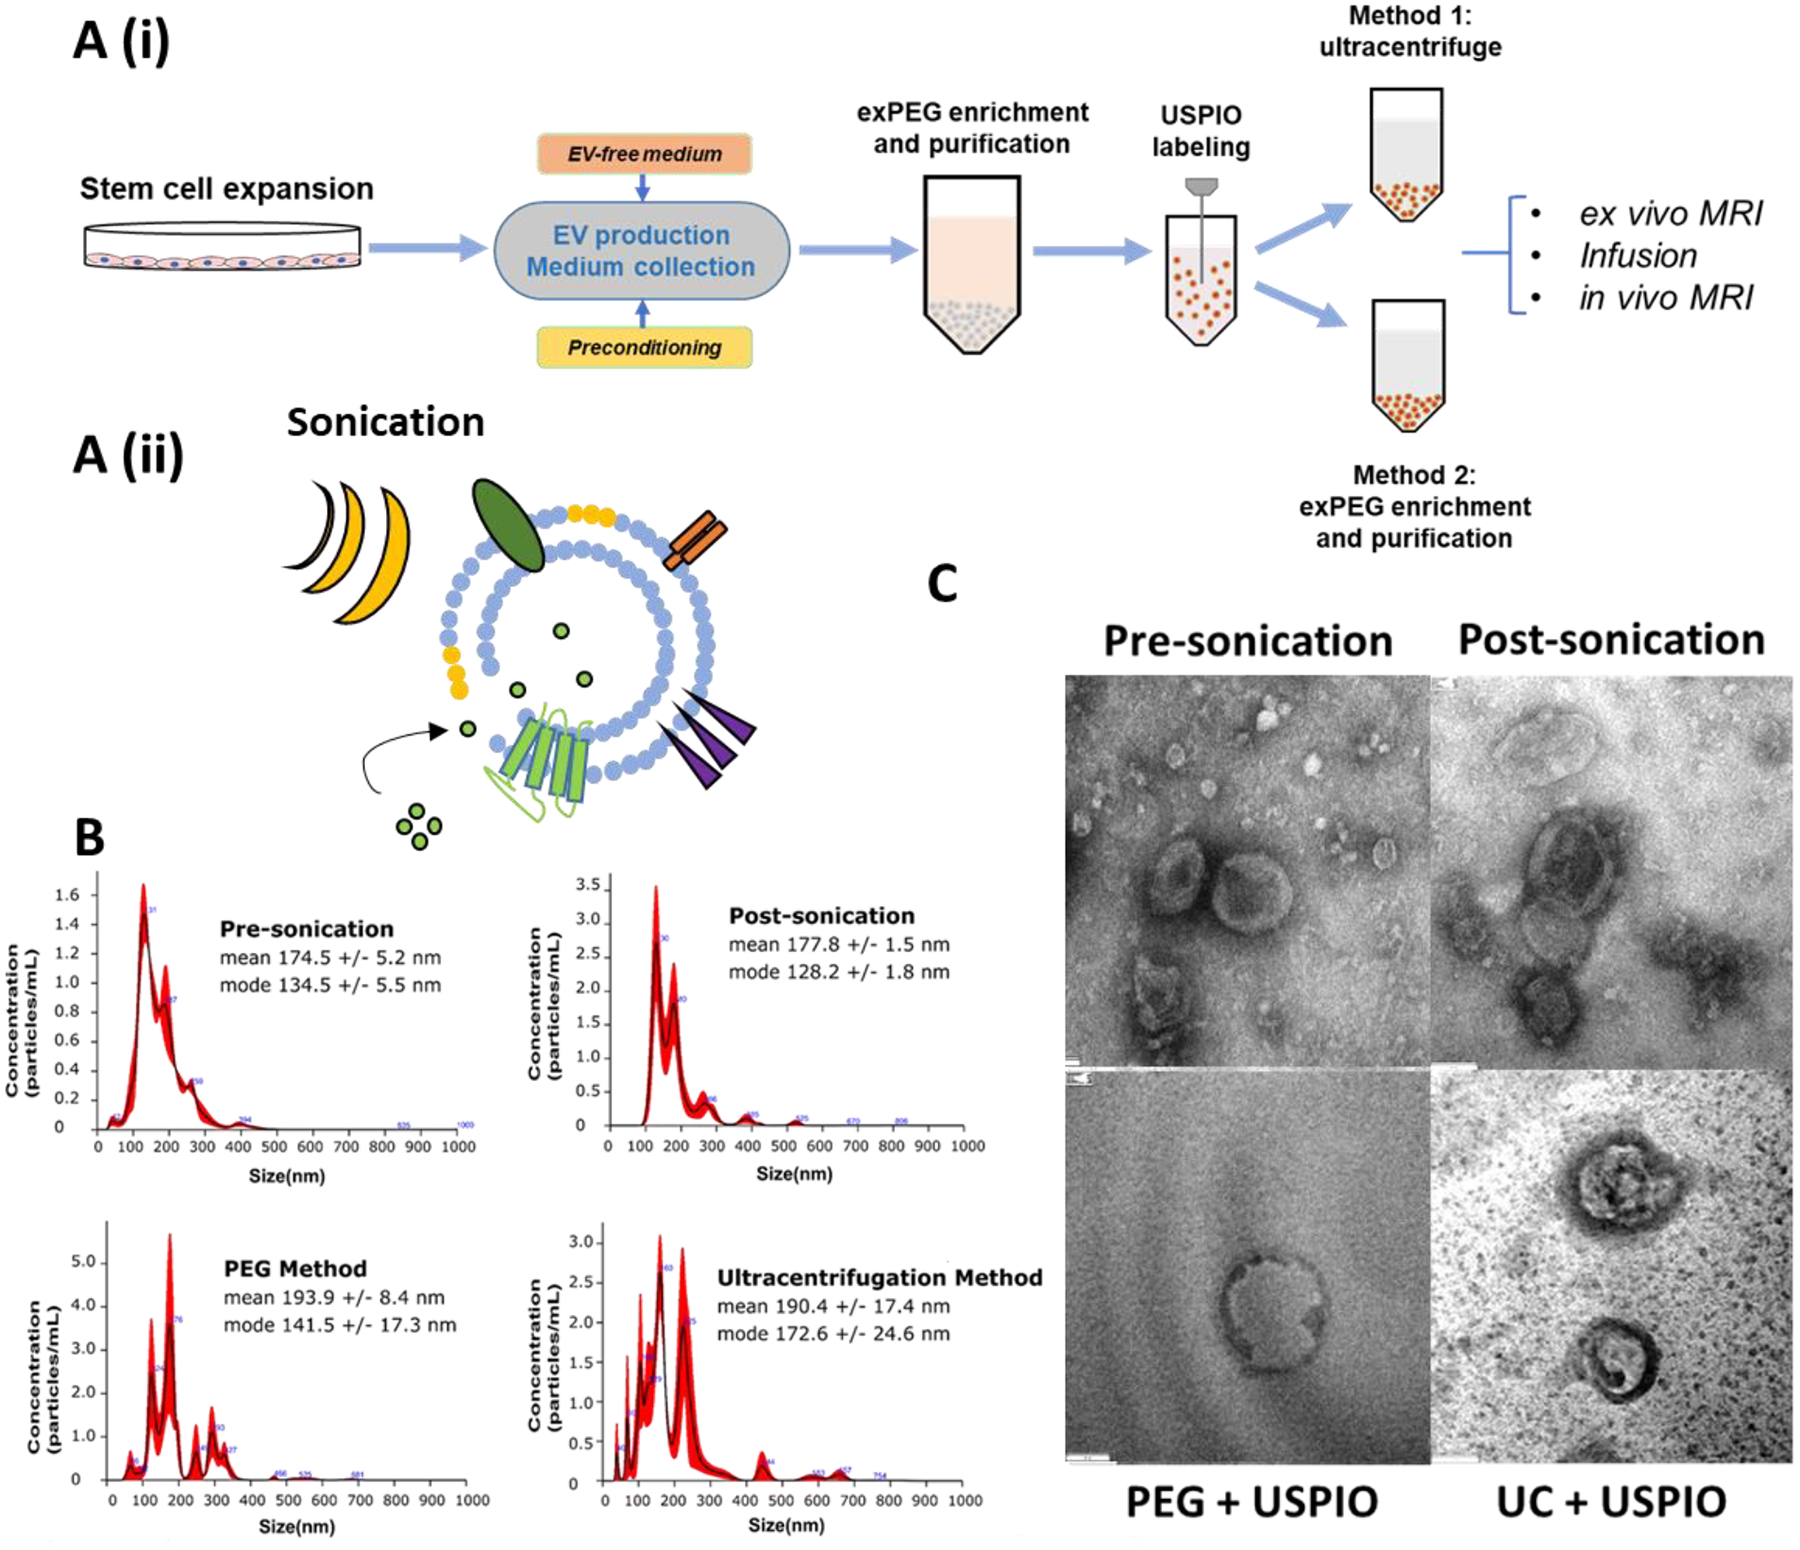
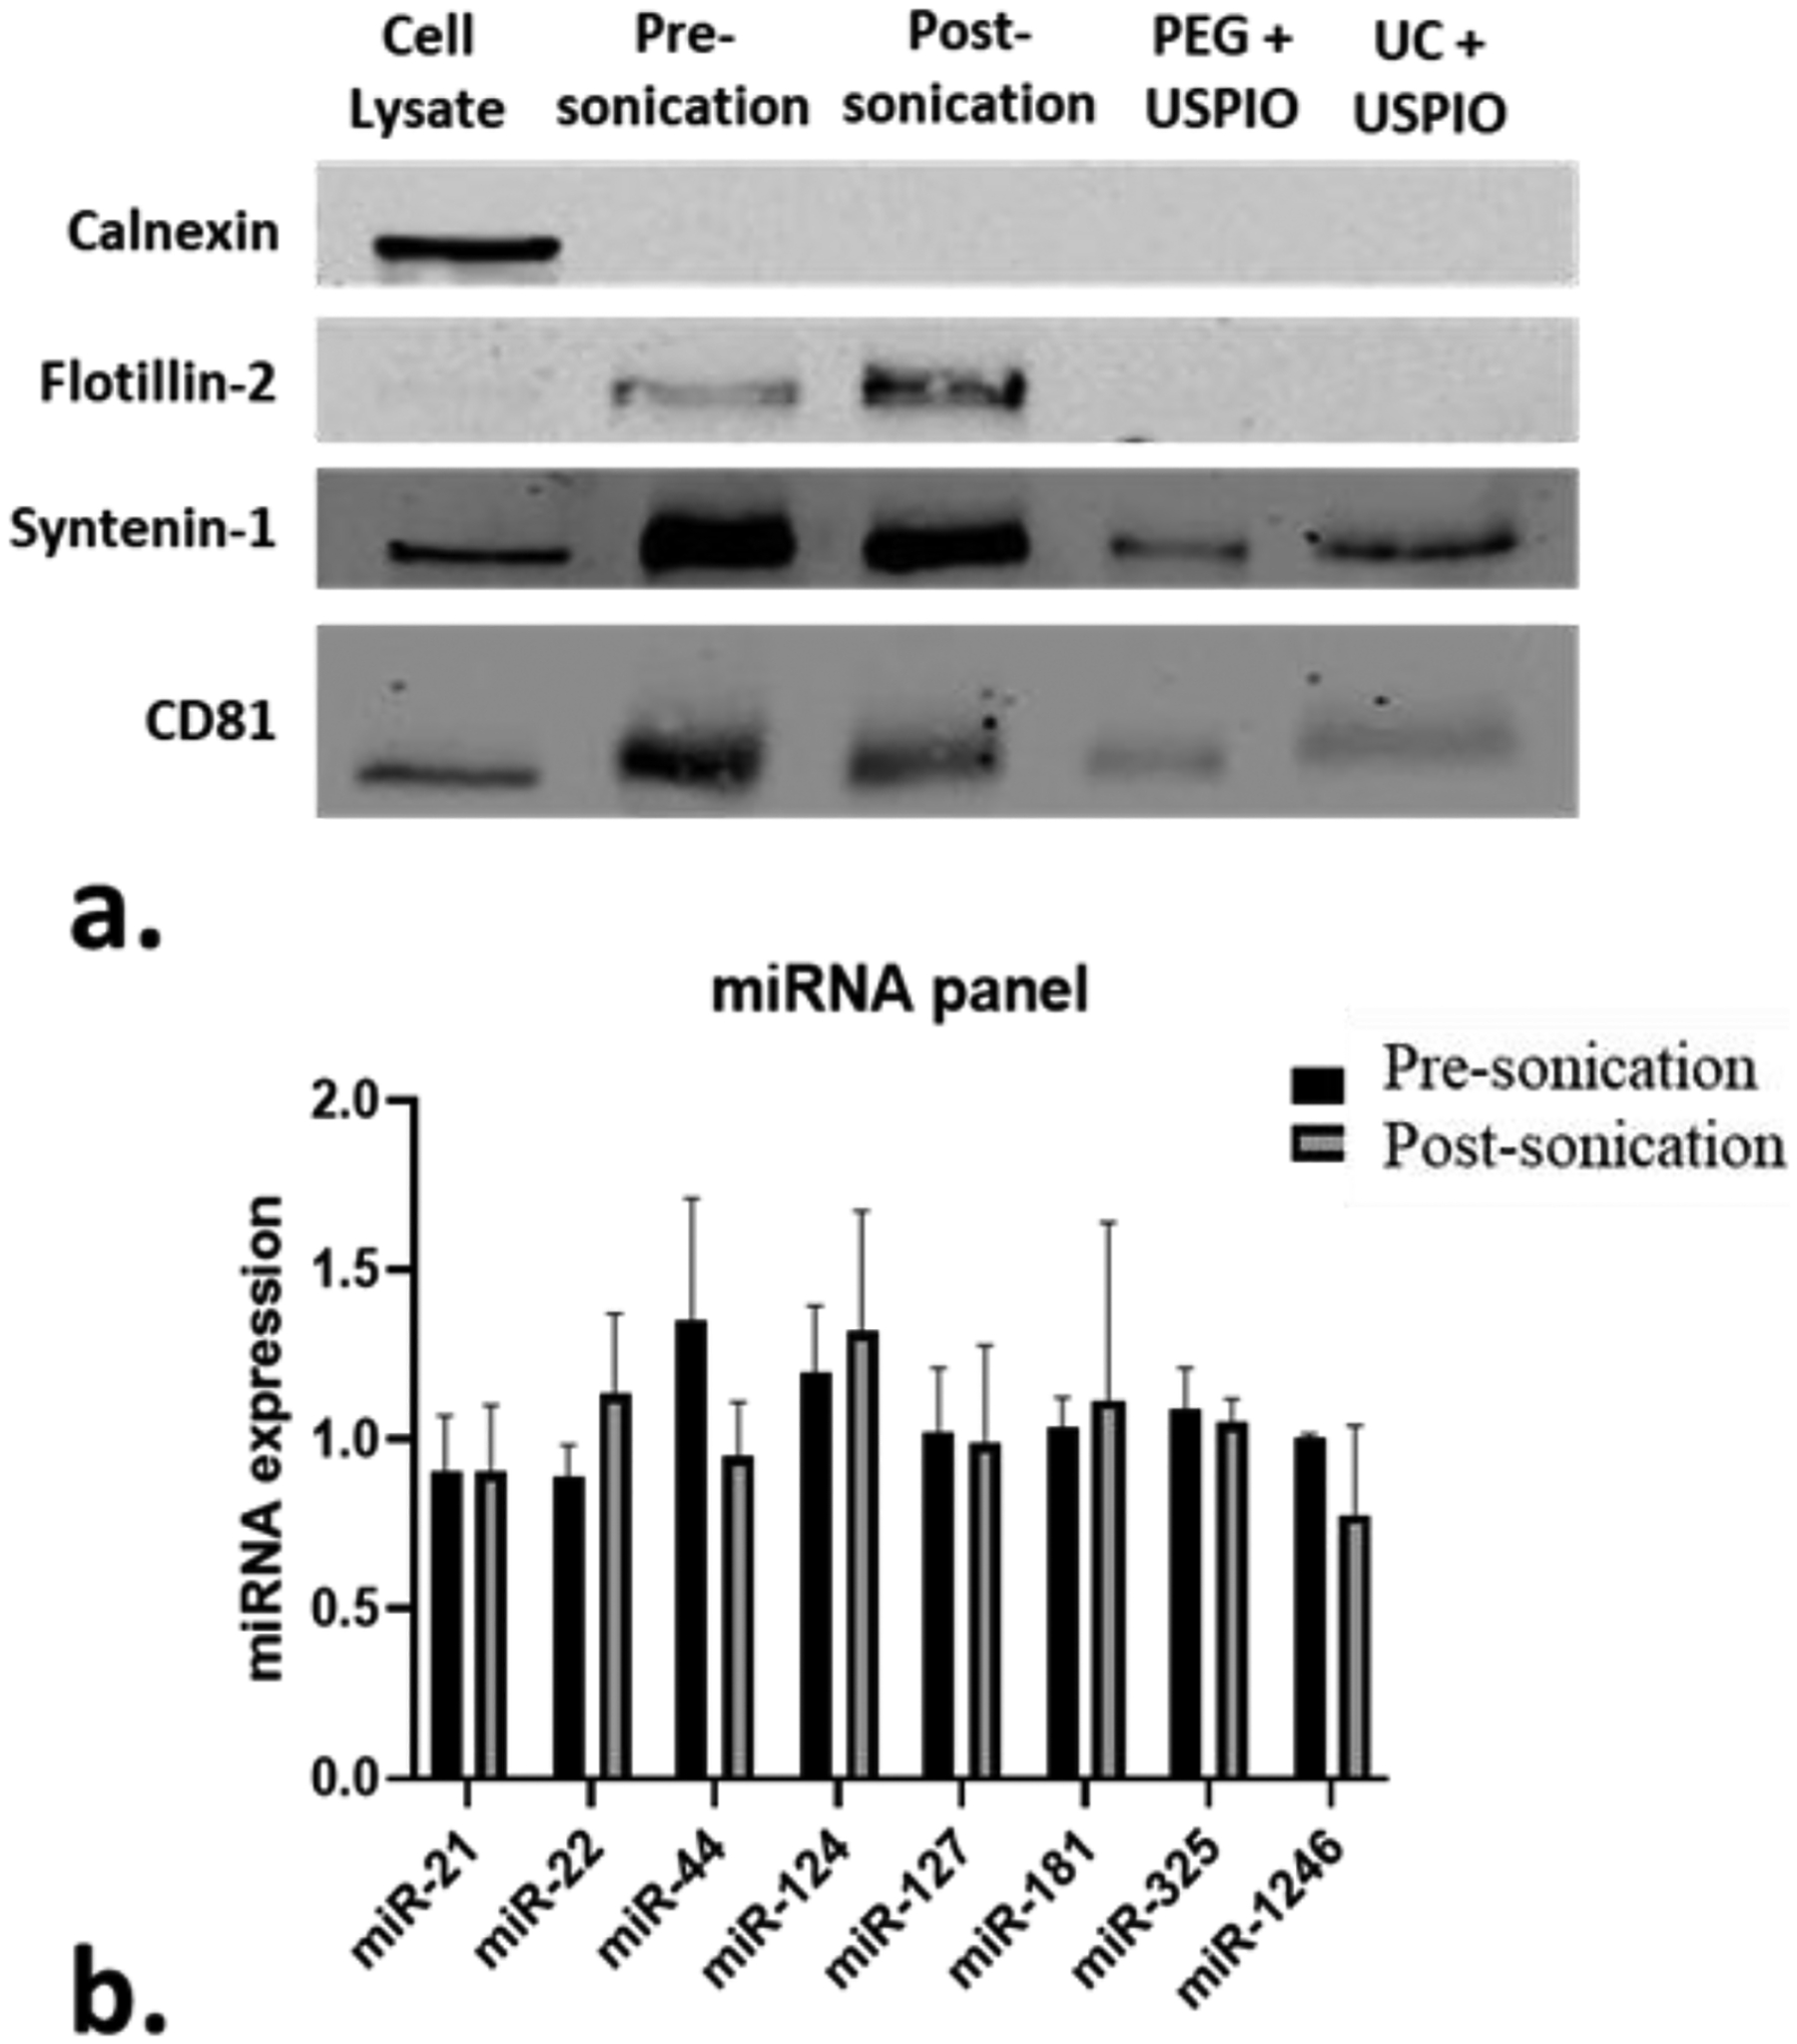
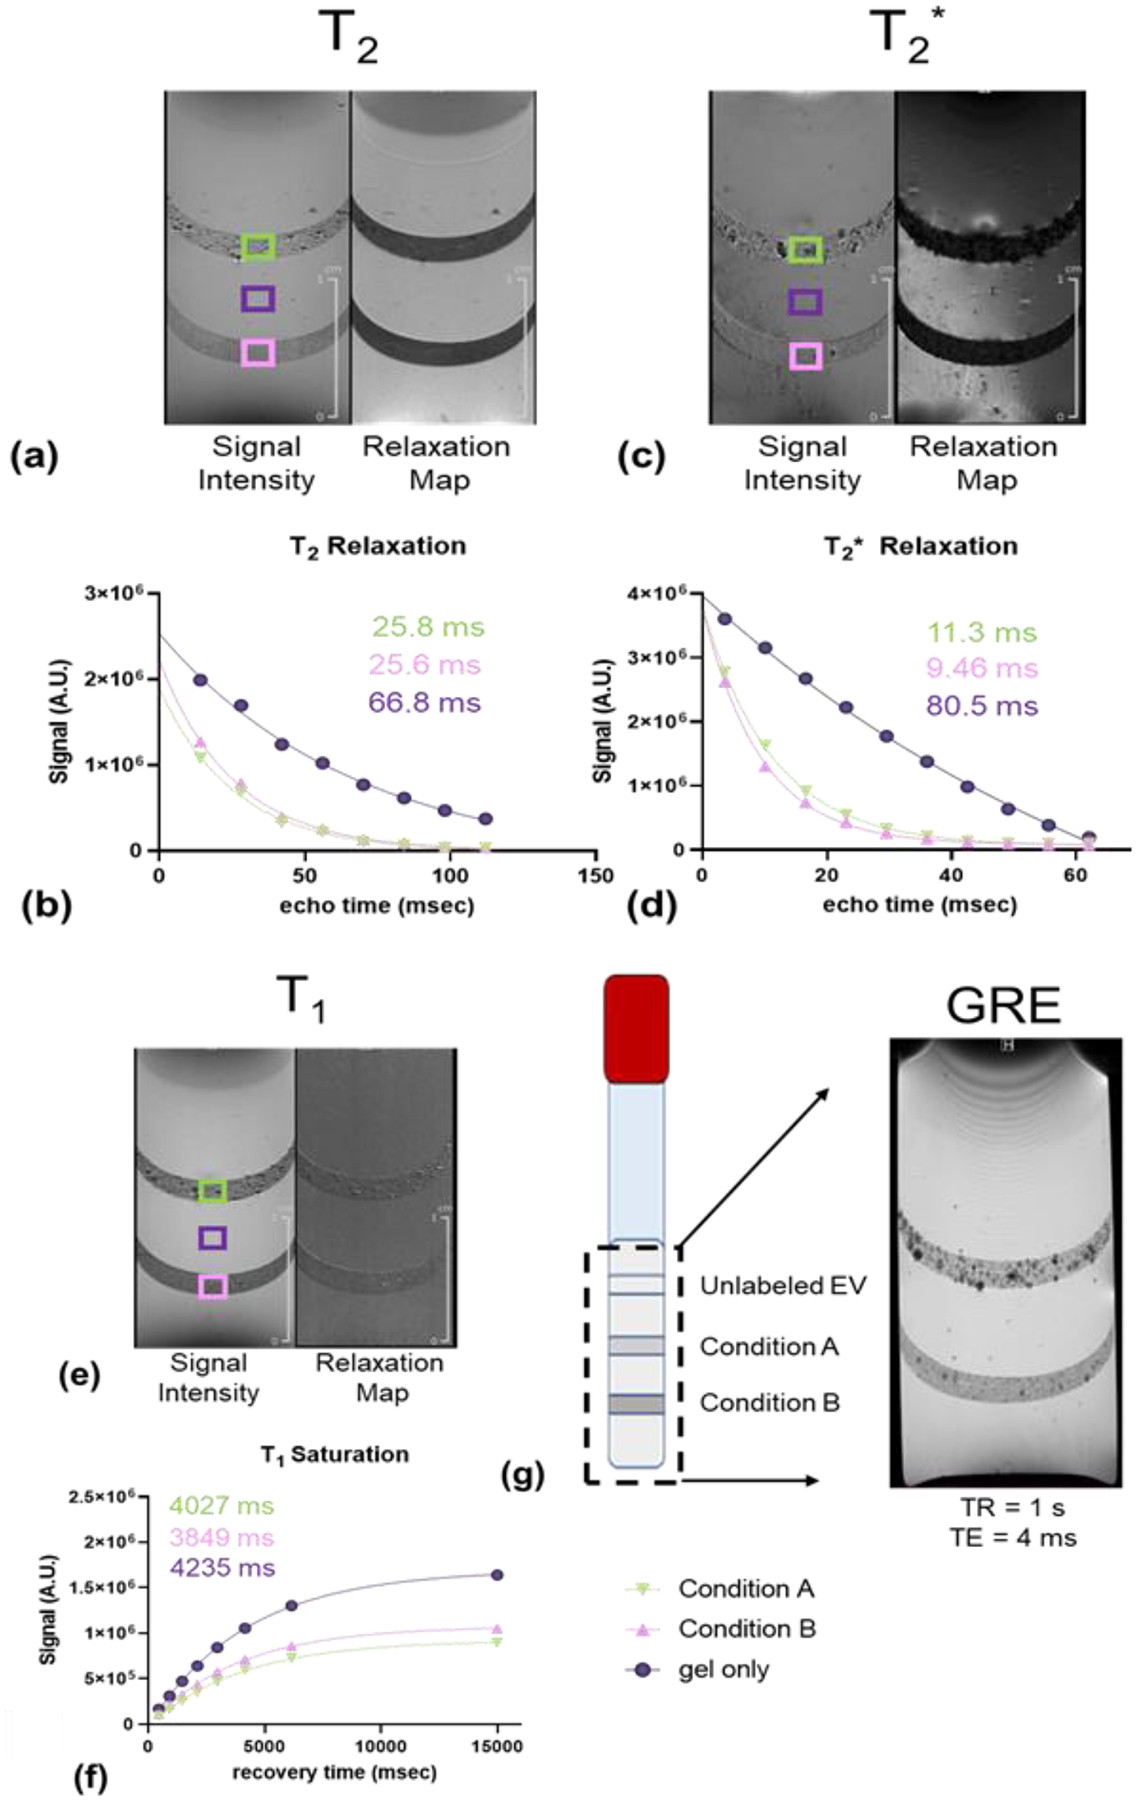
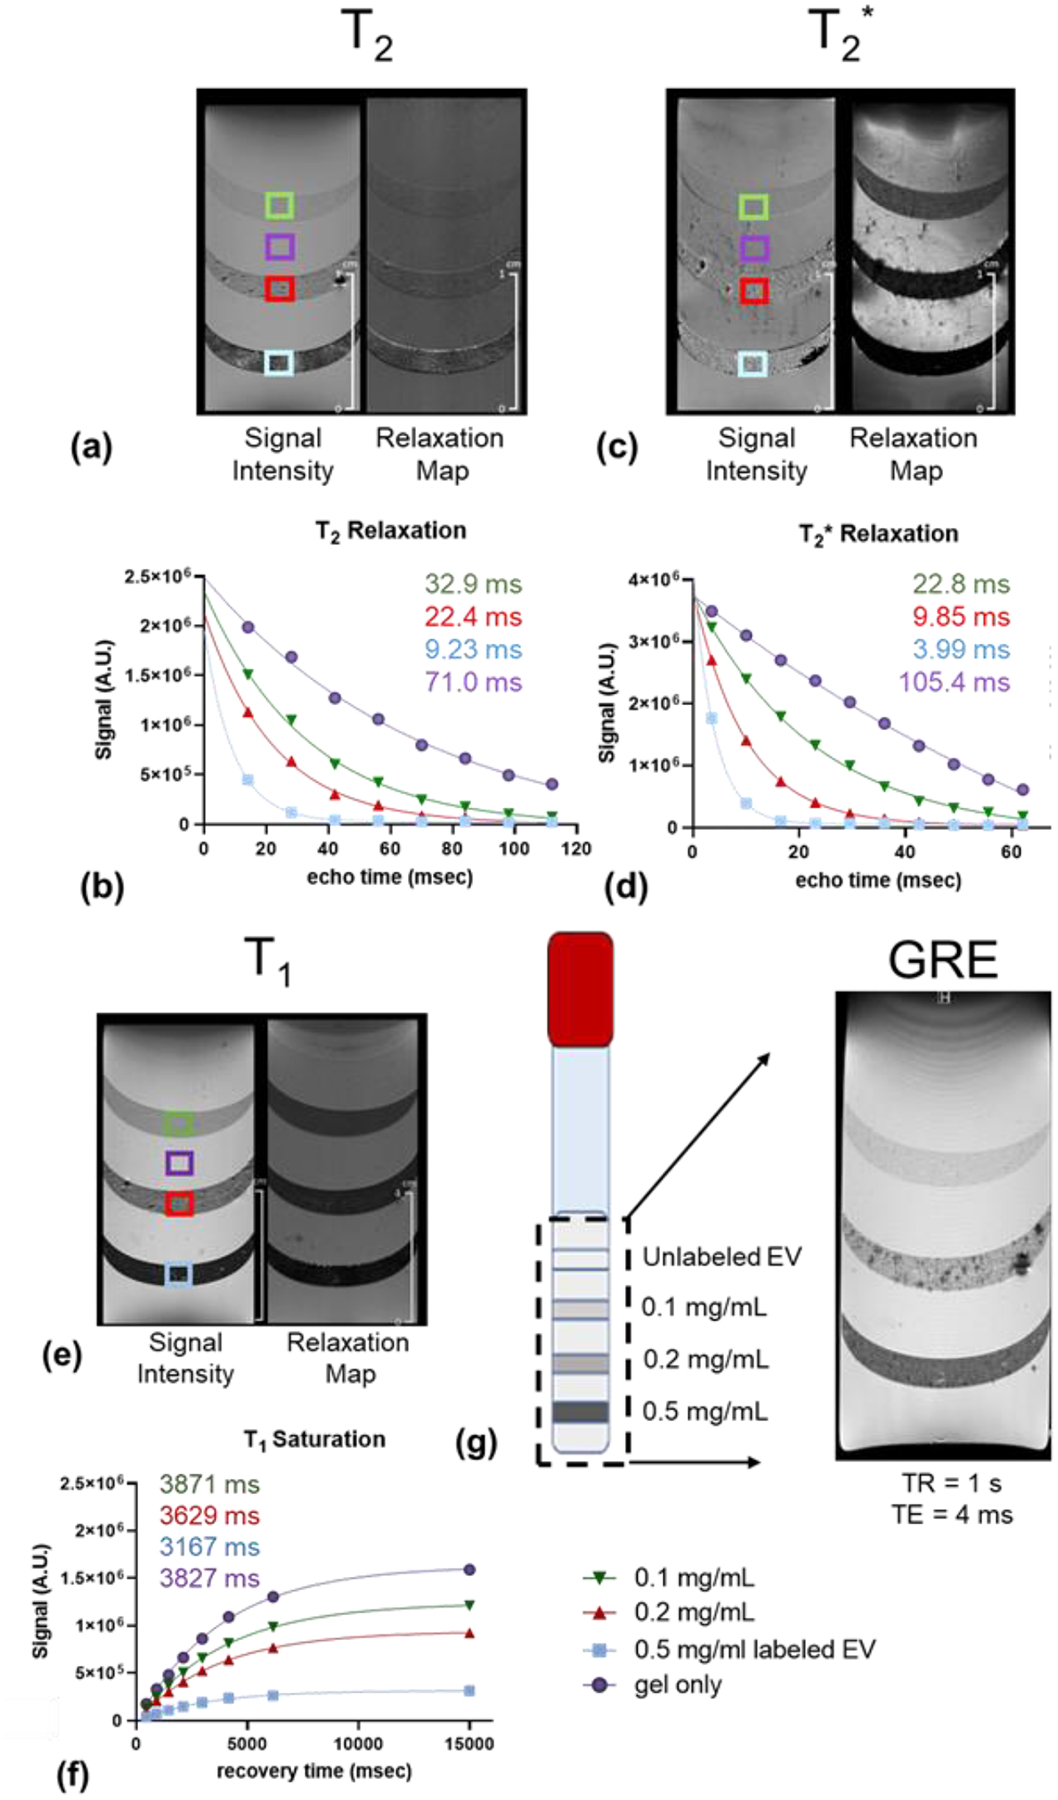
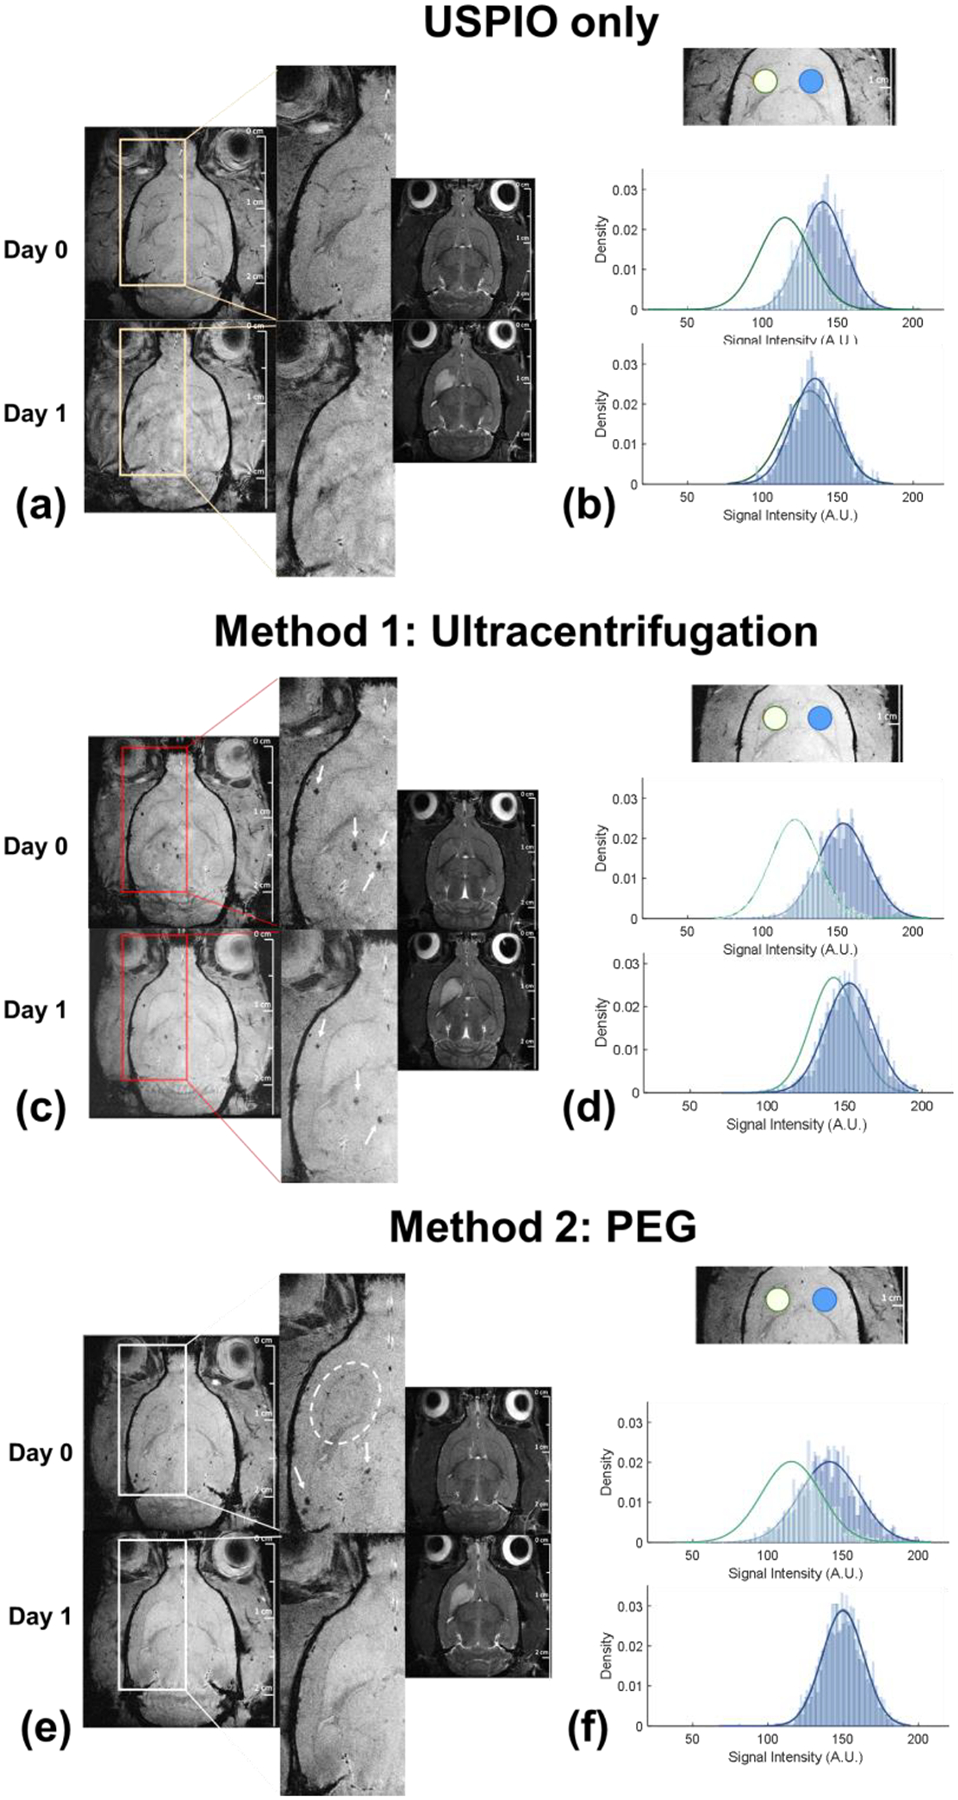
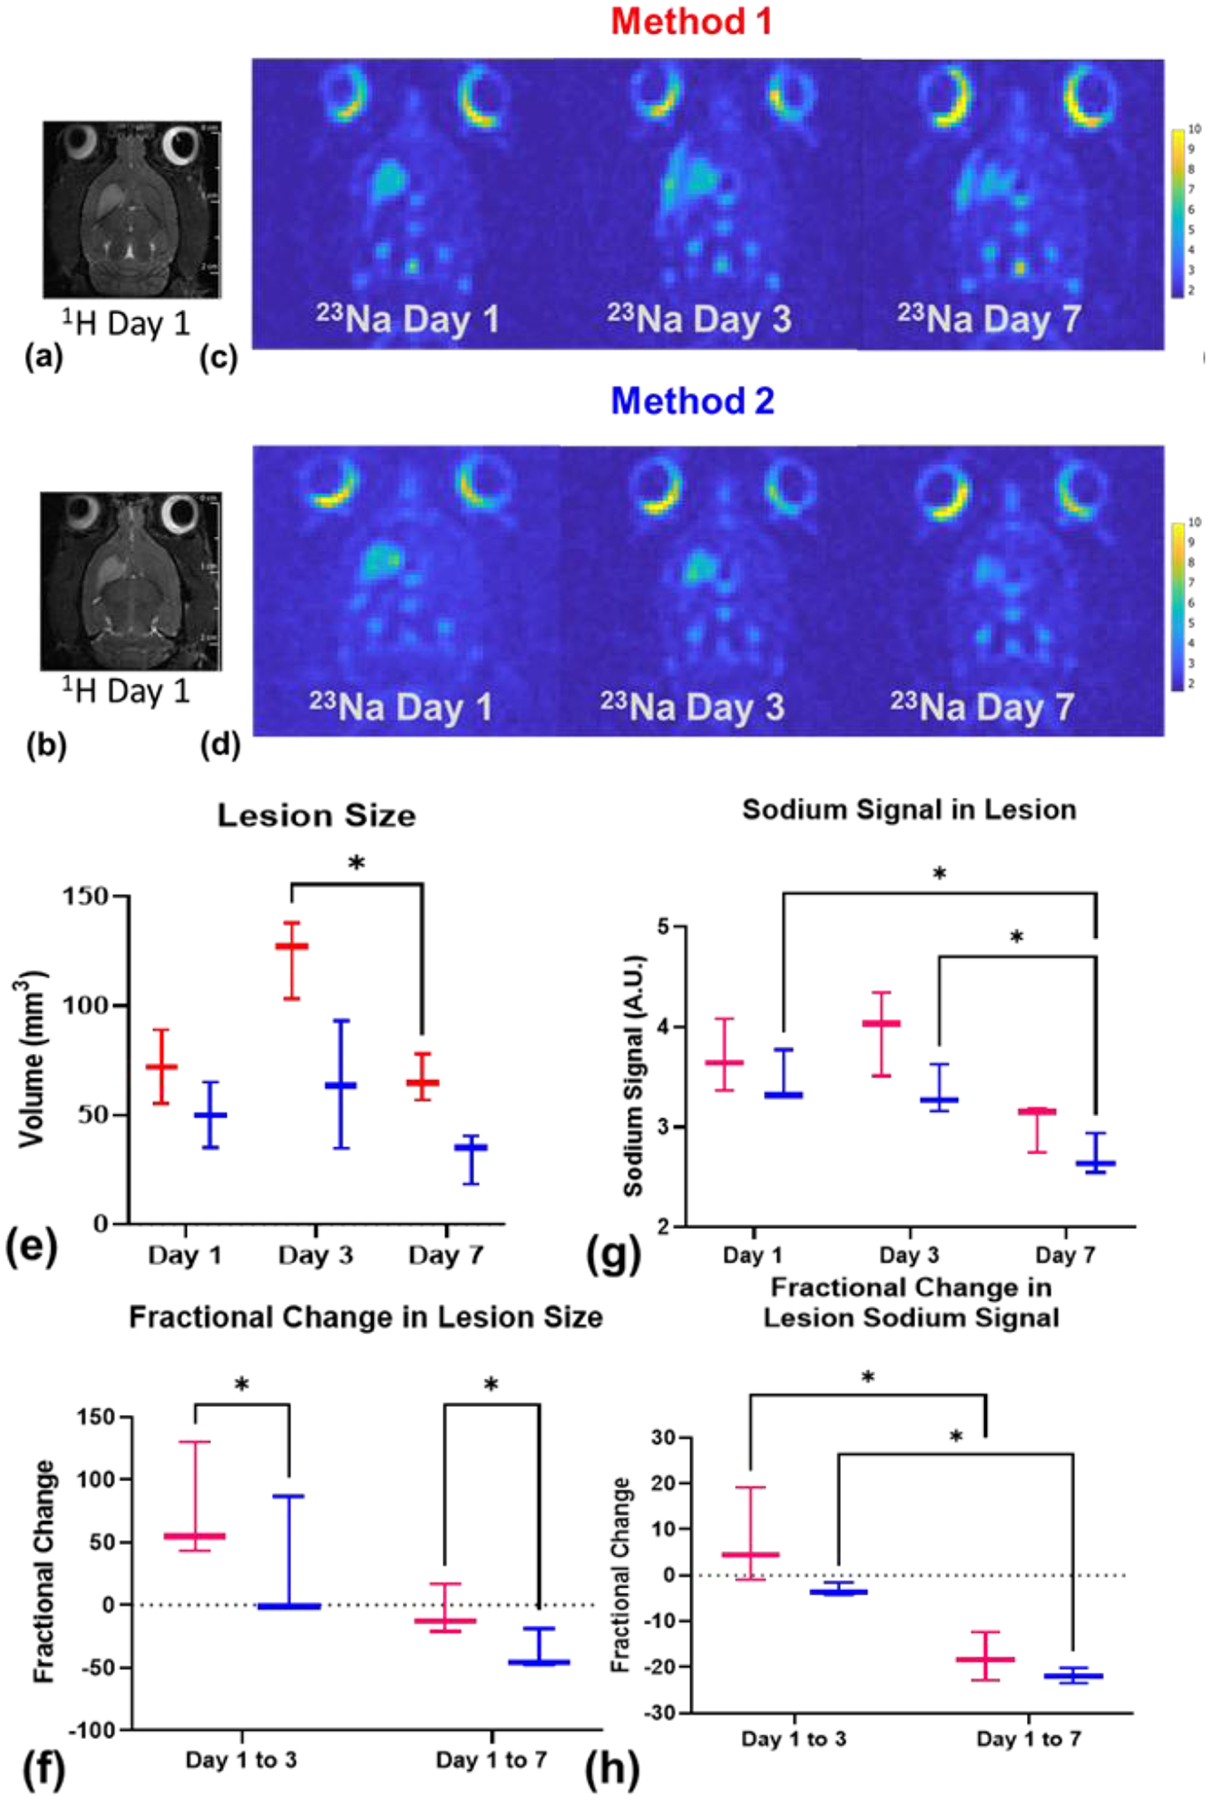
Stroke is a leading cause of death and disability worldwide. Extracellular vesicles (EVs) derived from human mesenchymal stem cells (hMSCs) offer a unique and promising alternative to direct cell injection as part of a cell-based therapy for stroke treatment. The development of labeling strategies is essential to identifying the initial biodistribution and clearance of EV-based therapeutics. In this study, hMSC-EVs were labeled with ultrasmall superparamagnetic iron oxide (USPIO) nanoparticles for magnetic resonance imaging (MRI). Two methods of preparation were evaluated after EVs were sonicated in the presence of USPIO nanoparticle. The labeled EVs were purified by (1) ultracentrifugation only or (2) an extension of a harvesting approach that employs polyethylene glycol (PEG) to enrich EVs. Following in vitro assessment, labeled EVs were applied to an ischemic stroke model and imaged both immediately and longitudinally using MRI. In vitro assessment showed the EV characteristics after USPIO nanoparticle labeling. The PEG method exhibited a 3.6-fold enhancement in contrast using an equivalent USPIO concentration at 0.5 mg/mL and equivalent acquisition parameters (TE = 3.5 ms, TR = 5 s) when the dilution factor is considered. Sufficient USPIO nanoparticle labeling was achieved to visualize initial biodistribution and assess initial therapeutic potential. Taken together, simultaneous USPIO nanoparticle labeling and EV enrichment with PEG enhanced MRI contrast and improved outcomes with respect to delivery and ischemic stroke recovery.

Keywords: MRI; extracellular vesicles; human mesenchymal stem cells; preclinical ischemia; superparamagnetic iron oxide.


Conflict of interest statement

Disclosures No competing financial interests exist.

Figures

Figure 1.
Figure 1.. Schematic illustration of labeling process and characterization of EVs after USPIO labeling.
(A) (i) Experimental schematic illustration of labeling process. hMSCs first were expanded under standard culture condition and then preconditioned under hypoxia. EVs were harvested from hMSC-conditioned media and underwent enrichment and purification by ExtraPEG. Following sonication with USPIO, ultracentrifugation only or an additional ExtraPEG method was used to purify the labeled EVs. (ii) illustration of the EV sonication process. (B) Size distribution of EVs. EV control (pre-sonication) and post-sonication with no label were compared to USPIO-labeled EV using either ExtraPEG or ultracentrifugation to separate the free USPIO. Representative images of C) pre-sonication with no label (control), post-sonication with no label, USPIO label via PEG method or ultracentrifugation. Scale bars are equal to 70 nm.
Figure 2.
Figure 2.. Protein and miRNA assessments following labeling process.
a) Western blot demonstrating expression of exosomal markers under varying processing conditions and b) miRNA expression pre- and post-sonication of hMSC-EVs determined by RT-PCR (n=3).
Figure 3.
Figure 3.. MRI of hMSC-EVs labeled and purified via Method 1 suspended in 1% agarose gel.
a,c,e) demonstrate signal intensity and relaxation maps for T2, T2* and T1, respectively. b,d,f) show data fitted to exponential decay or saturation curves. g) represents schematic (left) of EV samples in a 10-mm NMR tube with blank 1% agarose in between layers and GRE image (right) of the NMR tube depicting contrast for the bottom two sample layers only, Condition A and Condition B labeled with 0.5 mg/mL USPIO, and no contrast for unlabeled EVs in top layer.
Figure 4.
Figure 4.. MRI of hMSC-EVs labeled and purified via Method 2 suspended in 1% agarose gel.
a,c,e) demonstrate signal intensity and relaxation maps for T2, T2* and T1, respectively. b,d,f) show data fitted to exponential decay or saturation curves. g) represents schematic of EV samples in a 10-mm NMR tube (left) with blank 1% agarose in between layers and GRE image (right) of the NMR tube depicting contrast for bottom all three sample layers and no contrast for unlabeled EVs.
Figure 5.
Figure 5.. In vivo images of EV biodistribution and clearance on days 0 and 1.
a,c,e) GRE images of a representative animal on days 0 and 1 from each group. Boxes indicate magnified striatal region in the ischemic hemisphere. White arrows indicate aggregated EV contrast and white circles highlight diffused but strong contrast in the striatum. b,d,f) Signal intensities obtained from the striatum as indicated by colored circles in GRE images directly above histograms.
Figure 6.
Figure 6.. In vivo MRI of ischemic rats following administration of EVs labeled using Method 1 or 2.
a-b) Representative 1H T2-weighted images on day 1 with ischemic lesion in left hemisphere. c-d) Representative 23Na CSI generated on days 1, 3 and 7 with higher sodium signal indicated in yellow. e) Lesion size as defined by 23Na (*p = 0.0279) and f) fractional changes in lesion size over time (day 1 to 3, *p = 0.0199; day 1 to 7, *p = 0.0152). g) Average sodium signal intensity in the ischemic lesion (day 1 to 7, *p = 0.0143; day 3 to 7, *p = 0.0304) and h) fractional changes over time (Method 1, *p = 0.0382; Method 2, *p = 0.0202). Statistical significance calculated using a mixed-effects model with Tukey’s multiple comparisons post-hoc test (p < 0.05). All values presented as mean ± SD.

References

    1. Raposo G, Stoorvogel W Extracellular vesicles: Exosomes, microvesicles, and friends. J Cell Biol 2013;200:373. 10.1083/JCB.201211138. - DOI - PMC - PubMed
    1. Ludwig AK, Giebel B Exosomes: Small vesicles participating in intercellular communication. Int J Biochem Cell Biol 2012;44:11–5. 10.1016/J.BIOCEL.2011.10.005. - DOI - PubMed
    1. Boudna M, Campos AD, Vychytilova-Faltejskova P, Machackova T, Slaby O, Souckova K Strategies for labelling of exogenous and endogenous extracellular vesicles and their application for in vitro and in vivo functional studies. Cell Communication and Signaling 2024;22. 10.1186/s12964-024-01548-3. - DOI - PMC - PubMed
    1. Dabrowska S, Del Fattore A, Karnas E, Frontczak-Baniewicz M, Kozlowska H, Muraca M, et al. Imaging of extracellular vesicles derived from human bone marrow mesenchymal stem cells using fluorescent and magnetic labels. International Journal of Nanomedicine 2018;13:1653–64. 10.2147/IJN.S159404. - DOI - PMC - PubMed
    1. Buschmann D, Mussack V, Byrd JB. Separation, characterization, and standardization of extracellular vesicles for drug delivery applications q. Advanced Drug Delivery Reviews 2021;174:348–68. 10.1016/j.addr.2021.04.027. - DOI - PMC - PubMed

LinkOut - more resources