

Powder diffraction data beyond the pattern: a practical review
- PMID: 40765977
- PMCID: PMC12321027
- DOI: 10.1107/S1600576725004728
Powder diffraction data beyond the pattern: a practical review
Abstract
We share personal experience in the fields of materials science and high-pressure research, discussing which parameters, in addition to positions of peak maxima and intensities, may be important to control and to document in order to make deposited powder diffraction data reusable, reproducible and replicable. We discuss, in particular, which data can be considered as 'raw' and some challenges of revisiting deposited powder diffraction data. We consider procedures such as identifying ('fingerprinting') a known phase in a sample, solving a bulk crystal structure from powder data, and analyzing the size of coherently scattering domains, lattice strain, the type of defects or preferred orientation of crystallites. The specific case of characterizing a multi-phase multi-grain sample following in situ structural changes during mechanical treatment in a mill or on hydrostatic compression is also examined. We give examples of when revisiting old data adds a new knowledge and comment on the challenges of using deposited data for machine learning.
Keywords: 2D to 1D conversion; FAIR data; high-pressure data; images; in situ mechanochemical studies; materials; metadata; minerals; particle statistics; powder diffraction; raw data.
© Casati and Boldyreva 2025.
Figures
 and
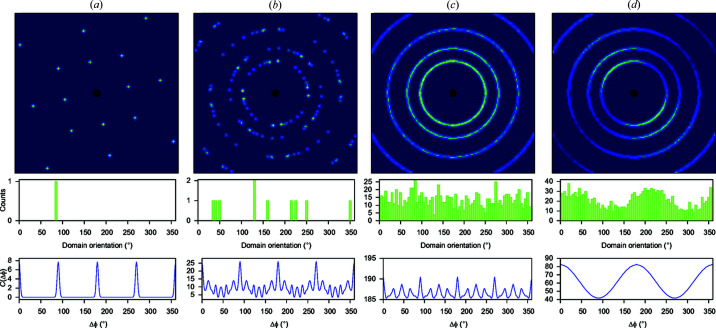
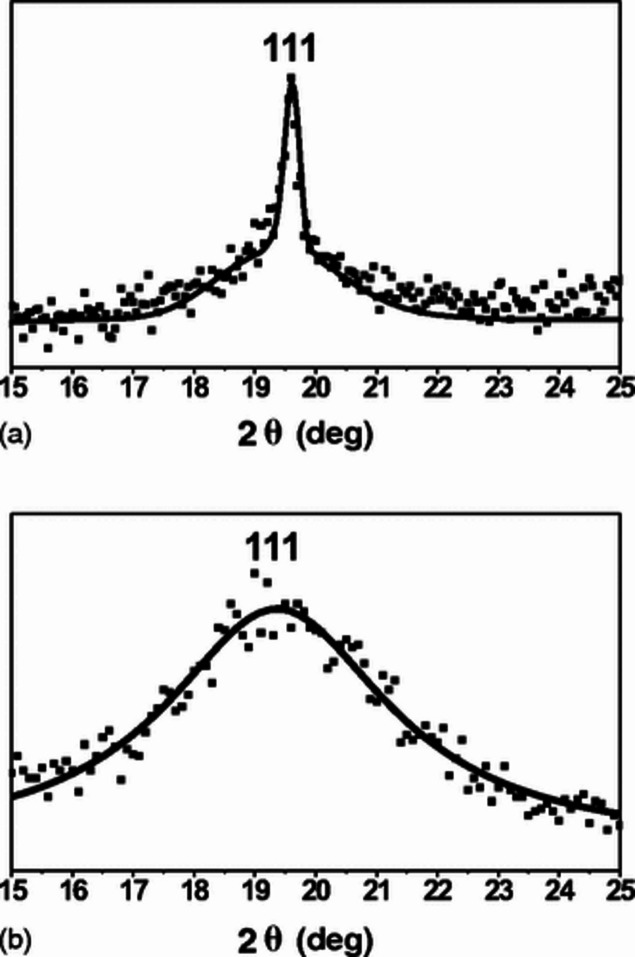
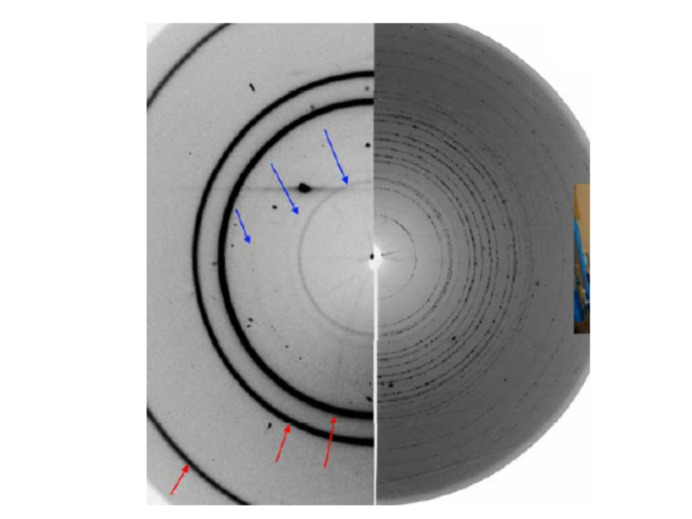
and  ) are bounded by the half-dislocations at a dislocation density equal to 20%. Reproduced with permission from Tsybulya & Kryukova (2008 ▸). Copyright (2008) the American Physical Society.
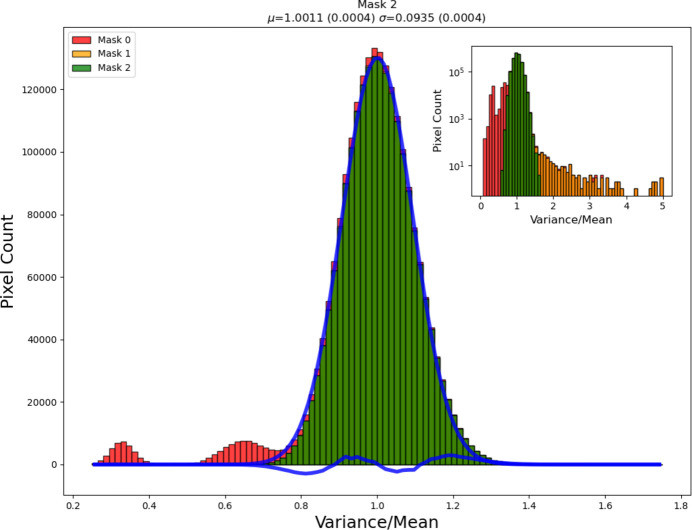
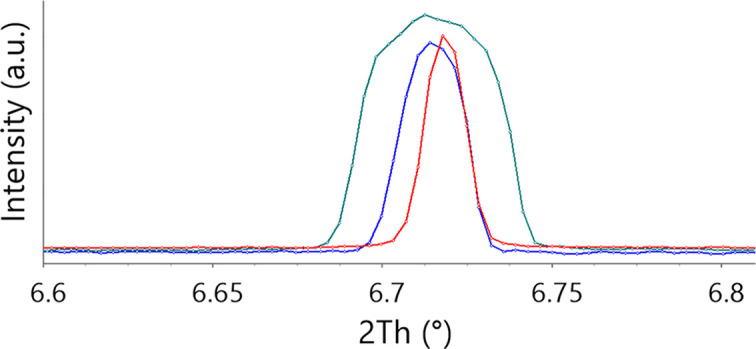
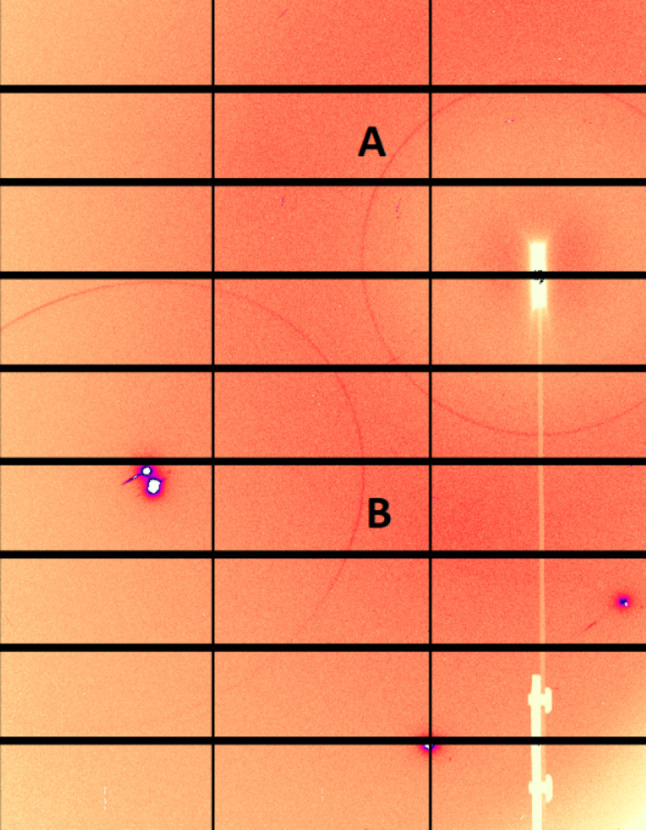
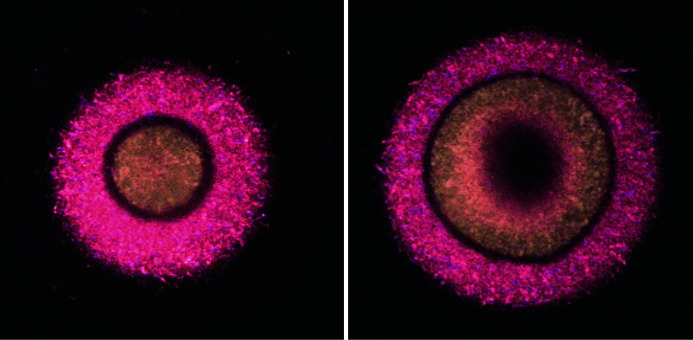
 (typically damaged pixels) as well as dilating by 1 pixel the regions around each masked pixel. The percentages of pixels masked in each case were 8.6%, 15.4% and 15.8%, respectively. The blue lines are a Gaussian fit to the final (mask 2) data and the difference curve. Inset: the same data on a semi-log scale. Reproduced with permission from Vaughan et al. (2025 ▸) under a
References
-
- Allen, F. H., Johnson, O., Shields, G. P., Smith, B. R. & Towler, M. (2004). J. Appl. Cryst.37, 335–338.
-
- Angel, R. & Gonzalez-Platas, J. (2013). J. Appl. Cryst.46, 252–254.
-
- Aranda, M. A. G. (2018). J. Appl. Cryst.51, 1739–1744.
-
- Aranda, M. A. G. (2019). The role of raw powder diffraction data in peer review; past, present and future, https://riuma.uma.es/xmlui/bitstream/handle/10630/18272/2019_08_18_progr....
-
- Arcelus, O., Rodríguez-Carvajal, J., Katcho, N. A., Reynaud, M., Black, A. P., Chatzogiannakis, D., Frontera, C., Serrano-Sevillano, J., Ismail, M., Carrasco, J., Fauth, F., Palacin, M. R. & Casas-Cabanas, M. (2024). J. Appl. Cryst.57, 1676–1690.
Publication types
LinkOut - more resources
Full Text Sources