. 2025 Jul 22:12:1615717.
doi: 10.3389/fmed.2025.1615717. eCollection 2025.

Exploring the relationship between co-abundance of gut microbiota and novel metabolic pathways in different subtypes of irritable bowel syndrome: insights from the American Gut Project

Affiliations

Exploring the relationship between co-abundance of gut microbiota and novel metabolic pathways in different subtypes of irritable bowel syndrome: insights from the American Gut Project

Li-Li Han et al. Front Med (Lausanne). .

Abstract

Background: Irritable bowel syndrome (IBS) is a prevalent functional gastrointestinal disorder with an unclear etiology. Recent studies have underscored the association between alterations in the gut microbiome and the pathogenesis of IBS. However, limited knowledge exists regarding the co-abundance patterns of gut microbiota and metabolic pathways across different IBS subtypes.

Methods: In this study, we utilized the comprehensive gut microbiome data from the American Gut Project (AGP). Through Spearman correlation analysis, the random forest model, SHAP analysis, and the PICRUSt2 prediction function, we constructed and screened the gut microbiota co-abundance groups and their metabolic characteristics of three cohorts of patients with different subtypes among cohorts of patients with three distinct IBS subtypes: predominant constipation (IBS-C), predominant diarrhea (IBS-D), and unclassified (IBS-U), as well as three non-IBS control groups (non-IBS1, non-IBS2, and non-IBS3, respectively).

Results: Our study findings indicate that, in comparison to their respective non-IBS groups, there was a significant difference in the prevalence of 37.5% specific co-abundance groups (CAGs) identified across all three IBS subtypes: IBS-C, IBS-D, and IBS-U. In addition, the random forest model shows that there are 2-4 characteristic CAGs for each subtype. We also analyzed the co-abundance networks between each CAG and metabolic pathways. Additionally, we analyzed the co-abundance networks between each CAG and metabolic pathways. No significant species-metabolic pathway co-abundance groups were found in the IBS-C group. In the IBS-D group, 50% of CAGs showed significantly different co-abundance with related metabolic pathways compared to the non-IBS control groups, while in the IBS-U group, this figure was 80%. Through the analysis of differentially expressed metabolic pathways, we revealed significant disturbances in SCFAs and LPS metabolic pathways (particularly a marked increase in acetate) in IBS-D patients, whereas IBS-U patients only exhibited a non-significant downward trend in tryptophan metabolic pathways.

Conclusion: These results indicate that the alterations in the gut microbiota and their associated metabolic pathways differ among IBS subtypes, leading to distinct developments and symptoms. This expands our current understanding of the gut microbiota in different IBS subtypes and provides a theoretical foundation for further research.

Keywords: American Gut Project; co-abundance group; gut microbiota; irritable bowel syndrome subtypes; metabolic pathways.


Conflict of interest statement

The authors declare that the research was conducted in the absence of any commercial or financial relationships that could be construed as a potential conflict of interest.

Figures

Figure 1
Figure 1
Cohort construction characteristics of IBS subtypes and non-IBS controls. (A–O) The paired t-test results for age, BMI, height, weight and sex between the three IBS subtypes and non-IBS controls showed no statistically significant difference. (P–T) The ordinary one-way ANOVA results for age, BMI, height, weight, and sex between the three IBS subtypes groups. Sex was coded as 1 (male) and 0 (female) for statistical analysis. *p < 0.05, **p < 0.01, ***p < 0.001, and ****p < 0.0001, ns, not significant.
Figure 2
Figure 2
The species co-abundance network and the Wilcoxon rank-sum test results for the average relative abundance of eight CAGs in the IBS-C group. (A) The genus-level co-abundance network is presented. The node size represents the average abundance of each genus, and different colors indicate different CAGs. The lines between nodes represent their correlations, with thicker lines indicating larger correlation coefficients. Only positive correlations with coefficients greater than 0.4 are shown in the graph. (B) The Wilcoxon rank-sum test results for the average relative abundance of the eight CAGs, with the red color representing the IBS-C group and the pinkish blue color representing the non-IBS1 group. The results not reaching significance were not labeled with “ns” in the figure. *p < 0.05, **p < 0.01, ***p < 0.001, and ****p < 0.0001.
Figure 3
Figure 3
The species co-abundance network and Wilcoxon rank-sum test results for the average relative abundance of eight CAGs in the IBS-D group. (A) The genus-level co-abundance network. The node size indicates the average abundance of each genus, with different colors representing different CAGs. The lines between nodes depict their correlations, with line thickness reflecting the magnitude of the correlation coefficients. Only positive correlations with coefficients greater than 0.4 are displayed in the graph. (B) The Wilcoxon rank-sum test results for the average relative abundance of the eight CAGs, with red color representing the IBS-D group and purple color representing the non-IBS2 group. The results not reaching significance were not labeled with “ns” in the figure. *p < 0.05, **p < 0.01, ***p < 0.001, and ****p < 0.0001.
Figure 4
Figure 4
The species co-abundance network and Wilcoxon rank-sum test results for the average relative abundance of eight CAGs in the IBS-U group. (A) The genus-level co-abundance network. The node size indicating the average abundance of each genus and different colors representing different CAGs. The lines between nodes represent their correlations, with line thickness indicating the magnitude of the correlation coefficients. Only positive correlations with coefficients greater than 0.4 are shown in the graph. (B) The Wilcoxon rank-sum test results for the average relative abundance of the eight CAGs, with red representing the IBS-U group and green representing the non-IBS3 group. The results not reaching significance were not labeled with “ns” in the figure. *p < 0.05, **p < 0.01, ***p < 0.001, and ****p < 0.0001.
Figure 5
Figure 5
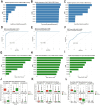
Analysis of the importance of gut microbiota characteristics and evaluation of model performance. (A–C) Relative importance of eight gut microbiota CAGs in different IBS subtypes, calculated based on the Gini index decrease method. (D–F) Receiver operating characteristic (ROC) curves and the area under the curve (AUC) of the random forest model for different IBS subtypes. (G–I) SHAP value distributions of the top six CAGs ranked by importance in different IBS subtypes. (J–L) Box plots of the SHAP value distributions of the top six CAGs grouped by different categories.
Figure 6
Figure 6
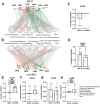
The co-abundance network and Wilcoxon rank-sum test results for the intestinal microbiota and metabolic pathways in IBS-D group. (A,B) The co-abundance network of the intestinal microbiota and metabolic pathways in IBS-D patients is depicted. Node size represents the average abundance of each genus and metabolic pathway, with circular nodes denoting metabolic pathways and rectangular nodes representing genera. Lines between nodes indicate correlations, with pink representing positive correlations and green representing negative correlations. The thickness of the lines indicates the absolute magnitude of the correlation coefficients. Only correlations with coefficients greater than 0.2 are displayed in the graph. (C–H) The Wilcoxon rank-sum test results for the average correlation coefficients between each CAG and different metabolic pathway categories in IBS-D. Different colors represent distinct metabolic pathway categories. The number to the left of the significance marker indicate the names of metabolically significant pathways. The results not reaching significance were not labeled with “ns” in the figure. *p < 0.05, **p < 0.01, ***p < 0.001, and ****p < 0.0001.
Figure 7
Figure 7
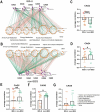
The co-abundance network and Wilcoxon rank-sum test results for the intestinal microbiota and metabolic pathways in IBS-U group. (A,B) The co-abundance network of the intestinal microbiota and metabolic pathways in IBS-U patients is shown. Node size represents the average abundance of each genus and metabolic pathway, with circular nodes denoting metabolic pathways and rectangular nodes representing genera. Lines between nodes indicate correlations, with pink representing positive correlations and green representing negative correlations. The thickness of the lines indicates the absolute magnitude of the correlation coefficients. Only correlations with coefficients greater than 0.2 are displayed in the graph. (C–G) The Wilcoxon rank-sum test results for the average correlation coefficients between each CAG and different metabolic pathway categories in IBS-U. Different colors represent distinct metabolic pathway categories. The number to the left of the significance marker indicate the names of metabolically significant pathways. The results not reaching significance were not labeled with “ns” in the figure. *p < 0.05, **p < 0.01, ***p < 0.001, and ****p < 0.0001.
Figure 8
Figure 8
The paired t-test results for the predicted pathway abundance of SCFA, LPS-associated, and tryptophan metabolic pathways in IBS-D and IBS-U groups. (A–C) The predicted pathway abundance of the three short-chain fatty acid (acetate, propionate, and butyrate) metabolic pathways. (D) The predicted pathway abundance of the LPS-associated metabolic pathways. (E,F) The predicted pathway abundance of the tryptophan metabolism-associated metabolic pathways. *p < 0.05 and **p < 0.01, ns, no significant.

Similar articles

References

    1. Oka P, Parr H, Barberio B, Black CJ, Savarino EV, Ford AC. Global prevalence of irritable bowel syndrome according to Rome III or IV criteria: a systematic review and meta-analysis. Lancet Gastroenterol Hepatol. (2020) 5:908–17. doi: 10.1016/S2468-1253(20)30217-X, PMID: - DOI - PubMed
    1. Lacy BE, Mearin F, Chang L, Chey WD, Lembo AJ, Simren M, et al. Bowel disorders. Gastroenterology. (2016) 150:1393–407. doi: 10.1053/j.gastro.2016.02.031 - DOI - PubMed
    1. Thompson JR. Is irritable bowel syndrome an infectious disease? World J Gastroenterol. (2016) 22:1331–4. doi: 10.3748/wjg.v22.i4.1331, PMID: - DOI - PMC - PubMed
    1. Chey WD, Kurlander J, Eswaran S. Irritable bowel syndrome: a clinical review. JAMA. (2015) 313:949. doi: 10.1001/jama.2015.0954, PMID: - DOI - PubMed
    1. Takiishi T, Fenero CIM, Câmara NOS. Intestinal barrier and gut microbiota: shaping our immune responses throughout life. Tissue Barriers. (2017) 5:e1373208. doi: 10.1080/21688370.2017.1373208, PMID: - DOI - PMC - PubMed

LinkOut - more resources