

Vancomycin levels for Bayesian dose-optimization in critical care: a prospective cohort study
- PMID: 40766073
- PMCID: PMC12321875
- DOI: 10.3389/fmed.2025.1575224
Vancomycin levels for Bayesian dose-optimization in critical care: a prospective cohort study
Abstract
Background: Vancomycin dosing in critically ill patients typically requires monitoring the area under the concentration-time curve/minimum inhibitory concentration (AUC/MIC), often using at least two vancomycin levels (VLs). However, the optimal number of VLs needed for accurate AUC/MIC estimation in this population remains uncertain. This study aimed to determine the minimum number of VLs required to accurately estimate the AUC/MIC in critically ill patients treated with intermittent infusion of vancomycin.
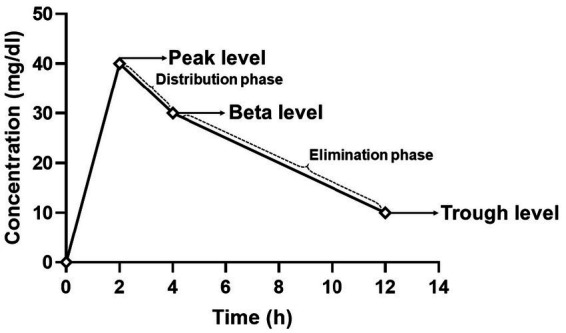
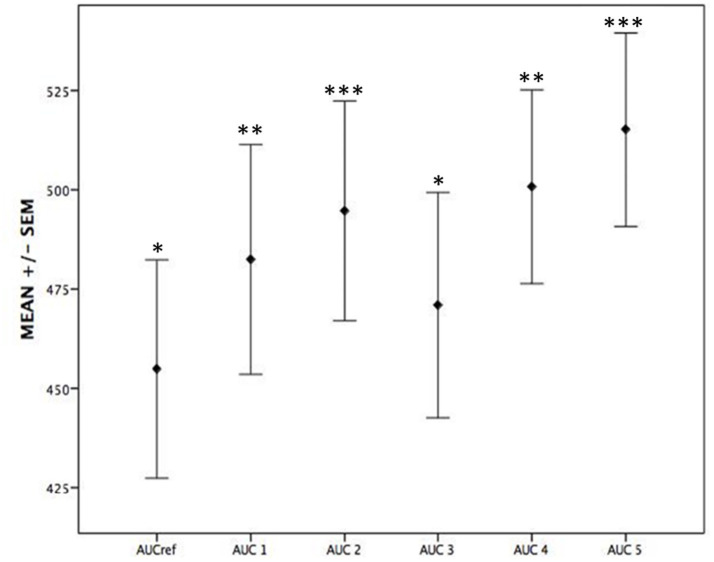
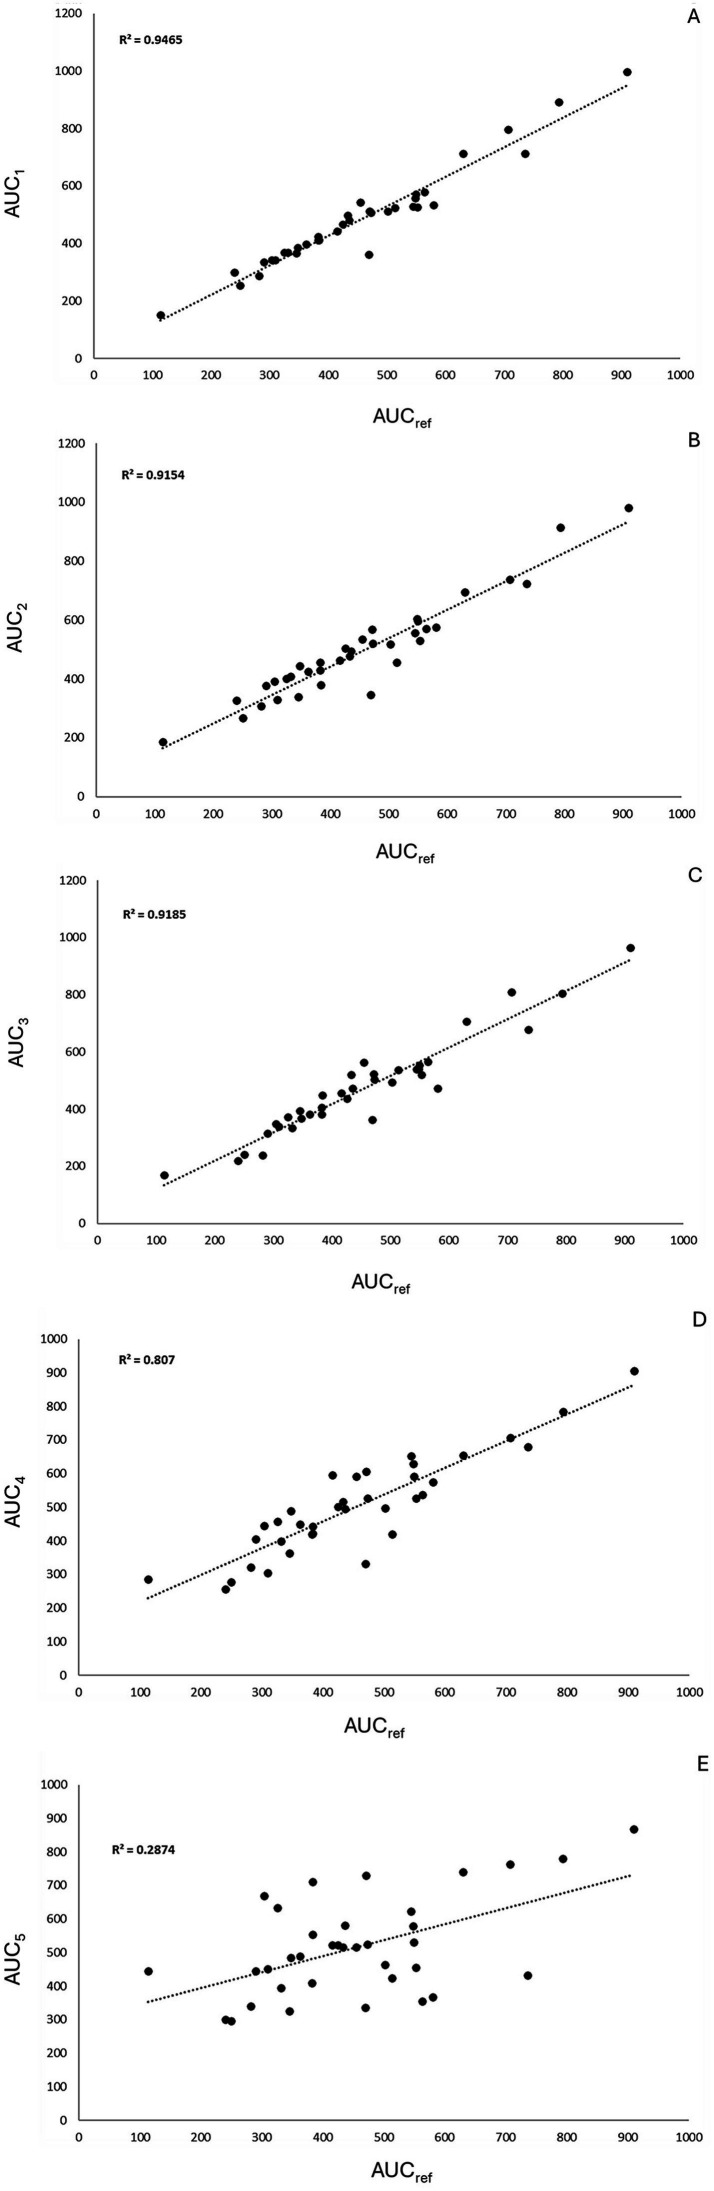
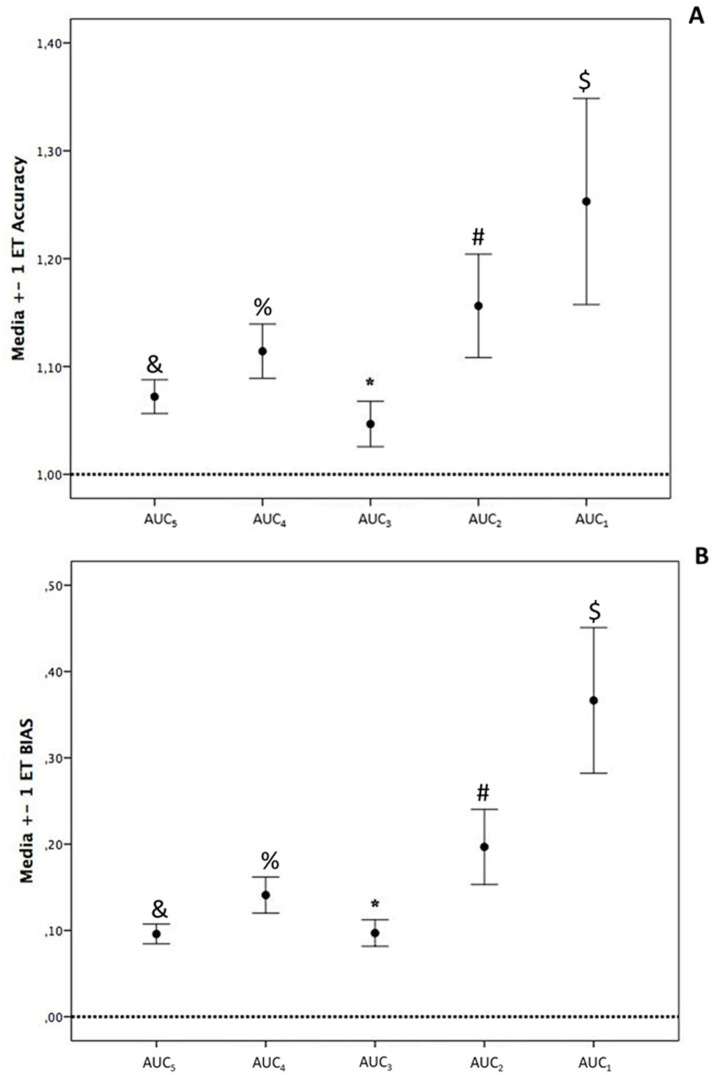
Methods: A prospective cohort study was conducted in critically ill patients, where VLs were obtained at peak, beta, and trough phases. Five AUC estimates were derived using PrecisePK™, a Bayesian software: AUC-1 [peak, beta (2 h after the end infusion), trough], AUC-2 (beta, trough), AUC-3 (peak, trough), AUC-4 (trough), and AUC-5 (only Bayesian prior, without VL). These estimates were compared for accuracy and bias (mean ± SEM) against the reference AUC calculated via the trapezoidal model (AUCRef).
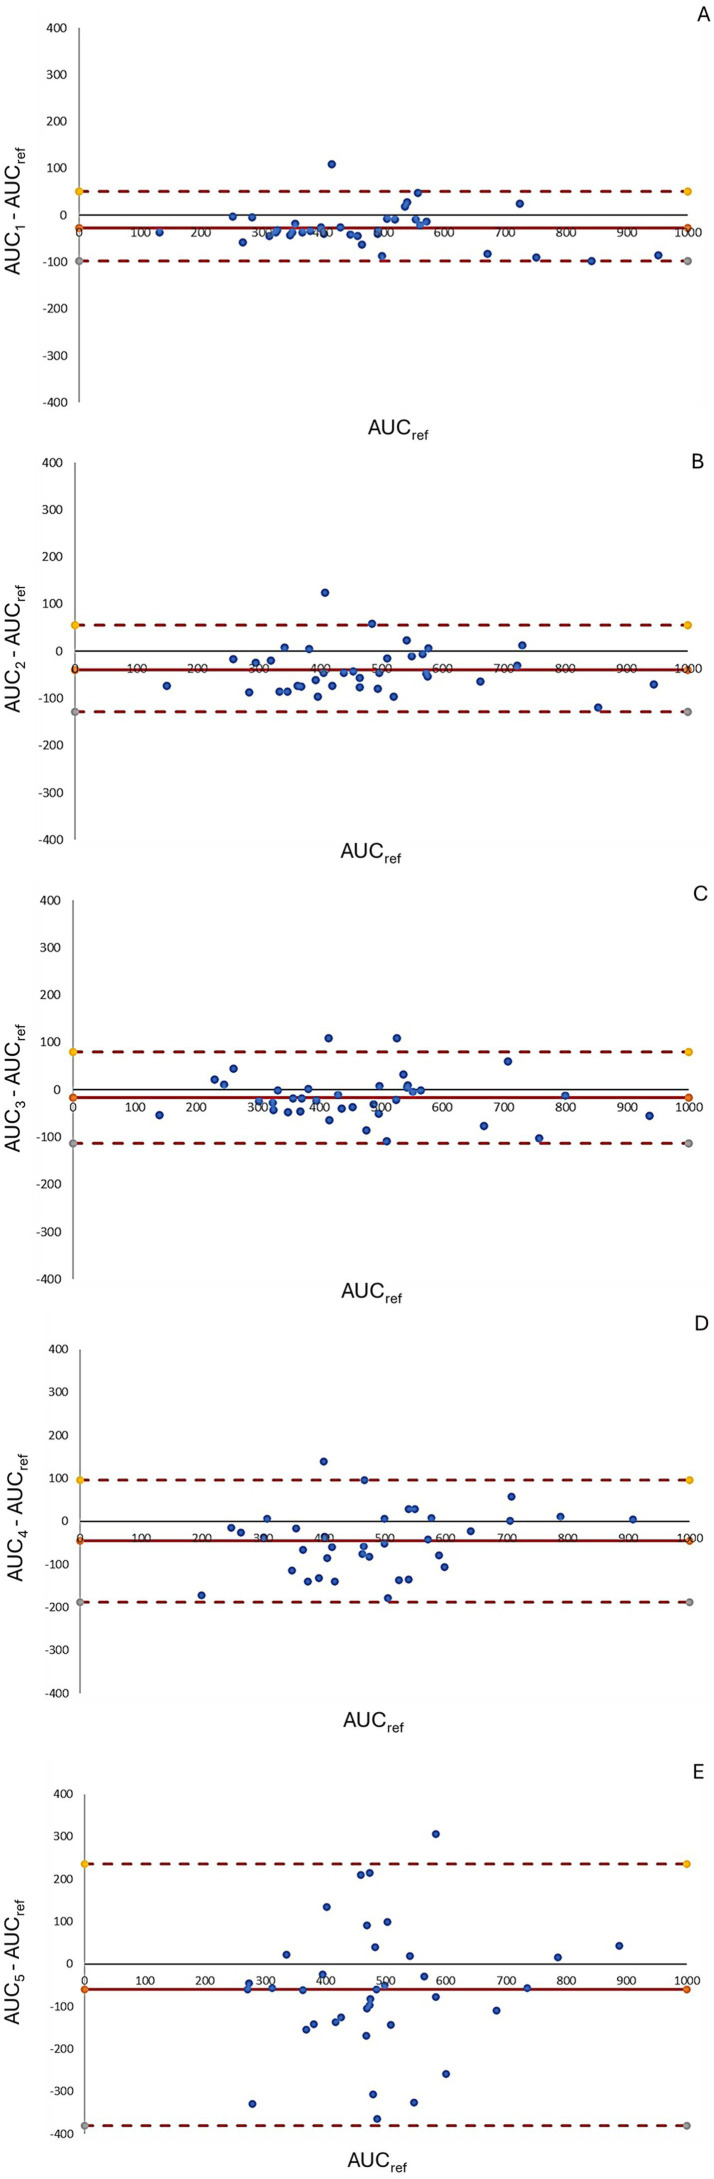
Results: We enrolled 36 adult patients with age of 65 (52-77) years, moderate severity [APACHE II 10 (5-14) and SOFA 5 (4-6)], 6 of them in ECMO and 4 in renal replacement therapy. A total of 108 blood samples for VL were analyzed. The AUC-3 (0.976 ± 0.012) showed greater accuracy compared to AUC-4 (1.072 ± 0.032, p = 0.042) and AUC-5 (1.150 ± 0.071, p = 0.042). AUC-3 also demonstrated lower bias (0.053 ± 0.009) than AUC-4 (0.134 ± 0.026, p = 0.036) and AUC-5 (0.270 ± 0.060, p = 0.003). Bland-Altman analysis indicated better agreement between AUC-3 and AUC-2 with AUCRef.
Conclusion: Bayesian software using two vancomycin levels provides a more accurate and less biased AUC/MIC estimation in critically ill patients.
Keywords: antibiotics; area under curve/minimum inhibitory concentration; glycopeptides; intensive care unit; pharmacokinetics; sepsis.
Copyright © 2025 Dreyse, Salazar, Munita, Rello and López.
Conflict of interest statement
The authors declare that the research was conducted in the absence of any commercial or financial relationships that could be construed as a potential conflict of interest.
Figures

Similar articles
-
Multiple Model Optimal Sampling Promotes Accurate Vancomycin Area-Under-the-Curve Estimation Using a Single Sample in Critically Ill Children.Ther Drug Monit. 2025 Jan 23;47(4):512-519. doi: 10.1097/FTD.0000000000001293. Ther Drug Monit. 2025. PMID: 39846757
-
Empirical dosage determination of vancomycin for a target area under the concentration-time curve of 400 μg·h/mL in the first 24 h: A prospective multicenter observational study with rich sampling.Br J Clin Pharmacol. 2025 Jul;91(7):1914-1926. doi: 10.1002/bcp.70002. Epub 2025 Feb 17. Br J Clin Pharmacol. 2025. PMID: 39961584
-
The Relationship Between Vancomycin Trough Concentrations and AUC/MIC Ratios in Pediatric Patients: A Qualitative Systematic Review.Paediatr Drugs. 2018 Apr;20(2):153-164. doi: 10.1007/s40272-018-0282-4. Paediatr Drugs. 2018. PMID: 29344778
-
Are Current Survival Prediction Tools Useful When Treating Subsequent Skeletal-related Events From Bone Metastases?Clin Orthop Relat Res. 2024 Sep 1;482(9):1710-1721. doi: 10.1097/CORR.0000000000003030. Epub 2024 Mar 22. Clin Orthop Relat Res. 2024. PMID: 38517402
-
Systemic pharmacological treatments for chronic plaque psoriasis: a network meta-analysis.Cochrane Database Syst Rev. 2017 Dec 22;12(12):CD011535. doi: 10.1002/14651858.CD011535.pub2. Cochrane Database Syst Rev. 2017. Update in: Cochrane Database Syst Rev. 2020 Jan 9;1:CD011535. doi: 10.1002/14651858.CD011535.pub3. PMID: 29271481 Free PMC article. Updated.
References
-
- Rybak MJ, Le J, Lodise TP, Levine DP, Bradley JS, Liu C, et al. Therapeutic monitoring of vancomycin for serious methicillin-resistant Staphylococcus aureus infections: a revised consensus guideline and review by the American Society of Health-System Pharmacists, the Infectious Diseases Society of America, the Pediatric Infectious Diseases Society, and the Society of Infectious Diseases Pharmacists. Am J Health Syst Pharm. (2020) 77:835–64. doi: 10.1093/ajhp/zxaa036, PMID: - DOI - PubMed
-
- Yamada Y, Niwa T, Ono Y, Yamada S, Niwa K, Yasue M, et al. Comparison of the incidence of vancomycin-associated nephrotoxicity following the change from trough-guided dosing to AUC-guided dosing using trough-only data. J Antimicrob Chemother. (2023) 78:2933–7. doi: 10.1093/jac/dkad333, PMID: - DOI - PubMed
LinkOut - more resources
Full Text Sources