. 2025 Jul 14:16:1601381.
doi: 10.3389/fmicb.2025.1601381. eCollection 2025.

A stable systemic infection of methicillin-resistant Staphylococcus aureus (MRSA) in cynomolgus macaques produces extended window for therapeutic intervention

Affiliations

A stable systemic infection of methicillin-resistant Staphylococcus aureus (MRSA) in cynomolgus macaques produces extended window for therapeutic intervention

Adrienne J Gamblin et al. Front Microbiol. .

Abstract

Introduction: Staphylococcus aureus is a common gram-positive commensal that, upon entering the bloodstream, can cause devastating illness and death within hours or days. Methicillin-resistant S. aureus (MRSA) infections, now a leading cause of bloodstream infections worldwide, pose significant challenges due to their rapid progression, high mortality rates, and limited therapeutic options. While there are prevalent small animal models of experimental MRSA infection, there has been minimal development of larger mammalian models capable of recapitulating clinical aspects of human systemic MRSA infection.

Methods: Following a pilot study to determine the optimal dose and route to establish systemic MRSA infection, we challenged six cynomolgus macaques with 109 colony-forming units MRSA (lineage USA300) via intravenous (IV) route. Animals were monitored closely up to 8 days for physiological, immunological, and cellular endpoints. Histopathology was performed on tissues collected 2 and 8 days after infection.

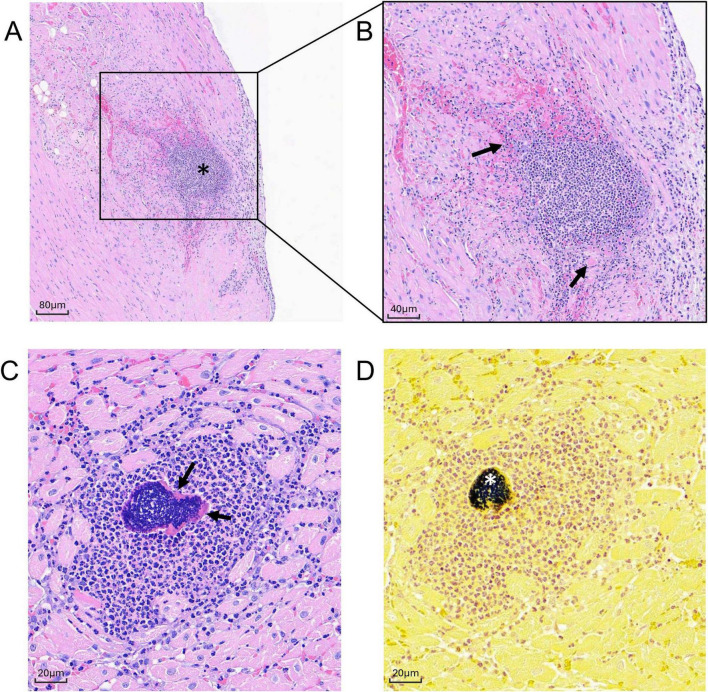
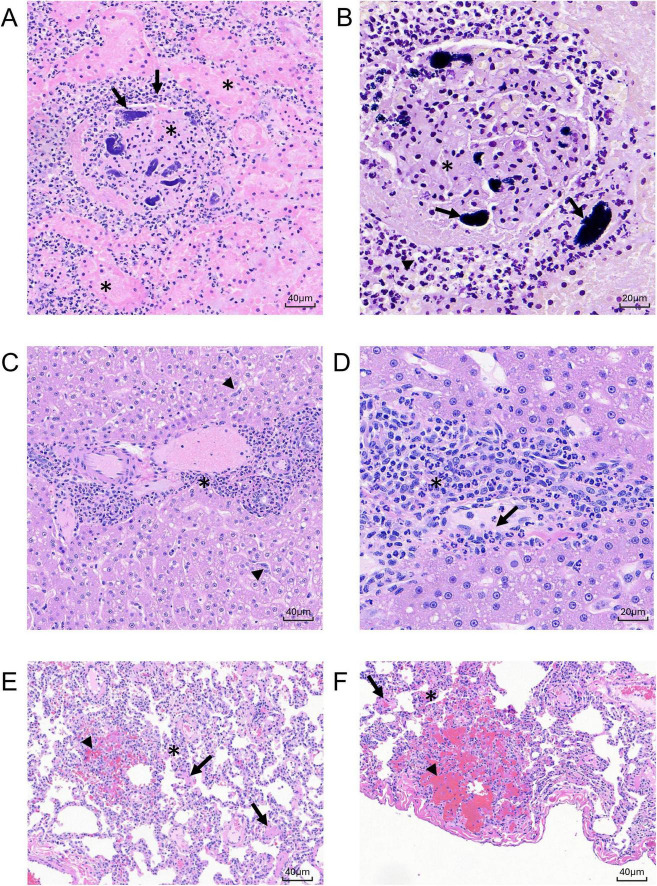
Results: An IV dose of 109 CFU MRSA USA300 in cynomolgus macaques produced bacteremia resulting from multifocal invasive infections, elevated markers of systemic inflammation, as well as weight loss, fever, and hemodynamic changes consistent with bloodstream infection. Hematological analyses demonstrated neutrophilic leukocytosis, lymphocytopenia, monocytosis, and mild thrombocytopenia. We observed a robust cytokine response, including TNF-α, IL-6, G-CSF, and IL-1RA, peaking 6 h post-infection. Flow cytometry immunophenotyping revealed dynamic shifts in circulating monocyte subpopulations, and histopathological analysis demonstrated multi-organ damage with significant findings in the kidneys, heart, liver, and lungs. By 8 days post-infection, moderate to severe myocardial, renal, and hepatic dysfunction were evident, supported by changes in clinical chemistry biomarkers. None of the animals required euthanasia before the scheduled date of termination.

Discussion: In this study, we establish a non-human primate model of systemic MRSA infection that allows for the characterization of MRSA pathogenesis and evaluation of therapeutics over a period of days rather than hours. This model successfully recapitulates key aspects of human MRSA bloodstream infections, providing a valuable platform for evaluating therapeutic interventions and understanding disease mechanisms.

Keywords: MRSA; S. aureus bacteremia; Staphylococcus aureus; bacterial infection model; cynomolgus macaque; nonhuman primate; sepsis.


Conflict of interest statement

AG, SS, MP, TO, EP, GS, GP, AW, HK, DB, JM, KF, FP, BF, AC, and SK were employed by the company BIOQUAL, Inc.

Figures

Graphs A through D display physiological and hematological changes over 48 hours post-infection (hpi) in cynomolgus macaques with different bacterial colony forming unit (CFU) counts and injection methods. A shows body weight changes, B shows body temperature variations, C presents mean arterial pressure, and D shows complete blood count changes. Different lines represent CFU values via intravenous (IV) and intraperitoneal (IP) routes. Key trends include a decrease in body weight and changes in blood cell counts, with the 10^10 CFU IP group showing notable shifts in leukocyte levels.
FIGURE 1
Pilot dose-finding study for systemic NHP MRSA infection model. Cynomolgus macaques were challenged with 1010–107 CFU MRSA via IV or IP route and monitored for up to 7 days. Physical exams and blood collections were performed frequently between 0 and 48 hpi. (A) Percent change (%Δ) in body weight compared to baseline (0 hpi). (B) Change in rectal body temperature compared to baseline (0 hpi). (C) Mean arterial pressure (MAP) calculated from systolic and diastolic cuff readings. (AC) The pilot animal that received a 1010 CFU dose via IV route (dark red) succumbed to infection between 5 and 18 hpi. (D) Absolute white blood cell counts from CBC hematology analysis of the pilot animal challenged with 1010 CFU MRSA via IP route.
“Five line graphs depict various health metrics over time for different subjects labeled DL606, DN361, DN362, DN233, DN508, and DN666. A. Bacteremia: Shows fluctuating CFU/mL levels, peaking at 1 to 2 days. B. C-Reactive Protein: Moderate rise over time, spiking at 7 days. C. Body Weight Change: Consistent decline, especially for DL606. D. Body Temperature Change: Small variations over time, some increases. E. Mean Arterial Pressure: Relatively stable, with slight fluctuations. Each line represents a distinct subject, with colors corresponding to the legend.”
FIGURE 2
IV challenge of NHPs with 109 CFU MRSA produces bacteremia, elevated CRP, and clinical signs of systemic infection. Six cynomolgus macaques were infected with 109 CFU MRSA via IV route. Three of the animals were monitored for 2 dpi and then euthanized; the remaining three animals were monitored up to 8 dpi and then euthanized. (A) Bacteremia was assessed via semi-quantitative bacteriology of whole blood. The upper limit of quantification (LOQ) for this bacteriological assay was 300 CFU/mL (black dotted line). Data are shown as the mean ± SD of two replicate TSA plates. Data are interleaved for clarity. (B) Concentrations of CRP in serum determined via CRP-ELISA. (C) Percent changes (%Δ) in body weight are shown calculated based on baseline body weight recorded at 0 hpi. (D) Changes (Δ) in body temperatures are shown calculated on baseline body temperatures recorded rectally at 0 hpi. (E) Mean arterial pressure (MAP) was estimated from systolic and diastolic blood pressure data recorded during physical exams. Gray areas indicate values outside the normal clinical ranges for cynomolgus macaques.
Graphs of blood cell counts over time for various cell types: A) Total leukocytes show an increase starting at 2 hours. B) Neutrophils rise at 2 hours, peaking at 12 hours. C) Lymphocytes decrease initially, then rise by day 1. D) Monocytes increase gradually, peaking by day 7. E) Eosinophils fluctuate, peaking at 2 hours. F) Platelets remain stable, with a slight increase by day 8. Each graph includes lines representing different datasets labeled DL606, DN361, DN362, DN233, DN508, DN666. Gray shading marks the normal range.
FIGURE 3
Changes in circulating white blood cell subtypes following IV MRSA challenge. Complete blood count (CBC) analyses were performed on an IDEXX analyzer for absolute (A) total white blood cells (leukocytes), (B) neutrophils, (C) lymphocytes, (D) monocytes, (E) eosinophils, and (F) platelets. (A–F) Statistical comparisons were performed using repeated-measures, mixed-effect analyses with Dunnett’s post hoc multiple comparisons test; *P < 0.05, **P < 0.01. Asterisks indicate p-values of multiple comparisons against the baseline “Pre” timepoint, and are shown below the x axis. Gray areas indicate values outside normal clinical ranges for cynomolgus macaques.
Heatmap and line graphs show cytokine levels over time. Panel A is a heatmap indicating cytokine expression. Panels B to J display line graphs of specific cytokines, each represented by a different colored line corresponding to a legend indicating various subjects. Time points range from pre-experiment to eight days, with y-axes measuring cytokine concentration in picograms per milliliter. Key cytokines include TNF-α, IL-6, IFN-γ, G-CSF, IL-1RA, IP-10, MCP-1, MIG, and MIP-1α. The graphs indicate peak cytokine levels shortly after the zero-hour mark.
FIGURE 4
Host cytokine/chemokine immune response of cynomolgus macaques following IV infection with 109 CFU MRSA. Concentrations of 37 cytokines, chemokines, and growth factors were characterized in cynomolgus macaque serum at baseline (Pre) through 8 dpi on the ProcartaPlex platform. (A) Heat map showing log-normalized change (Δ) in mean fluorescence intensity (MFI) of 21 analytes that were detected above the lower limit of detection in > 50% of animals. Serum concentrations of TNF-α (B), IL-6 (C), IFN-γ (D), G-CSF (E), IL-1RA (F), IP-10 (G), MCP-1 (H), MIG (I), and MIP-1α (J), are shown in pg/mL. (B–J) Statistical comparisons were performed using repeated-measures, mixed-effect analyses with Dunnett’s post hoc multiple comparisons test; *P < 0.05, **P < 0.01, ***P < 0.001, and ****P < 0.0001. Asterisks indicate p-values of multiple comparisons against the baseline “Pre” timepoint and are shown below the x axis for clarity.
Flow cytometry plots and graphs illustrate monocyte analysis. Panel A shows gating for monocyte subsets: classical, intermediate, and non-classical. Panels B to E display time-course graphs of monocyte frequencies: total (B), classical (C), intermediate (D), and non-classical (E). Each graph shows different subject trends over time, with distinct lines representing various datasets labeled DL606, DN361, DN362, DN233, DN508, and DN666. Data points indicate significant changes at multiple time intervals.
FIGURE 5
Monocyte subpopulations in whole blood of cynomolgus macaques infected with 109 CFU MRSA via IV route. Immunophenotyping performed by flow cytometry on whole blood collected throughout the study reveals unique behavior of circulating monocyte populations. (A) Representative gating strategy for monocyte subpopulations. (B) Total monocytes shown as frequency of CD45 + parent population. (C) Classical monocytes shown as frequency of monocyte population. (D) Intermediate monocytes shown as frequency of monocyte population. (E) Non-classical monocytes shown as frequency of monocyte population. (B–E) Statistical comparisons were performed using repeated-measures, mixed-effect analyses with Dunnett’s post hoc multiple comparisons test; *P < 0.05, **P < 0.01, ***P < 0.001, ****P < 0.0001.
Histological slides of kidney tissue showing inflammation. Panel A displays dense cellular infiltrates marked by arrows. Panel B highlights tubular structures, with an asterisk indicating a darker region and an arrowhead showing a tubular cross-section. Panel C exhibits prominent inflammatory cell clusters marked by arrows. Each panel includes a scale bar, with Panels A and B at forty micrometers and twenty micrometers, respectively.
FIGURE 6
Histologic sections of MRSA-challenged cynomolgus macaque kidney harvested from DN508 and DN233 at 2 dpi. (A) H&E stain (200x) of multifocal tubular degeneration (arrows) with regeneration and inflammation. (B) H&E stain (400x) of tubular epithelial necrosis (asterisk) with eosinophilic granular or inflammatory cell casts (arrowhead). (C) H&E stain (400x) of peritubular or tubular neutrophilic inflammation (arrows).
“Four microscopic images show different tissues stained to highlight cellular structures. A: A tissue section with an asterisk marking a cluster of dense cells, with a scale bar of 80 micrometers. B: A closer view of the cluster in A, with arrows indicating specific regions, scale bar 40 micrometers. C: Blue-stained tissue showing cellular detail with arrows pointing to certain cells, scale bar 20 micrometers. D: Yellow-stained tissue with an asterisk marking a distinct cluster of cells, scale bar 20 micrometers.”
FIGURE 7
Histologic sections of MRSA-challenged cynomolgus macaque heart tissue harvested at 2 dpi. (A,B) H& E stain of cardiac section from animal DN508 showing moderate neutrophilic inflammation (asterisk) with coalescing area of myocardial necrosis (arrows) at (A) 100x, and (B) 200x. (C,D) Successive cardiac sections (400x) harvested from animal DN508 showing (C) H&E strain showing foci of neutrophilic inflammation and Splendore-Hoeppli structures (arrows) and (D) hematoxylin/Gram stain with moderate numbers of gram-positive cocci (asterisk).
Histological slides labeled A to F showing different tissue samples stained with hematoxylin and eosin. Arrows, asterisks, and arrowheads point to specific features within each sample, possibly indicating areas of inflammation, cellular structures, or other significant histopathological details. Each panel includes a scale bar for size reference.
FIGURE 8
Histologic sections of MRSA-challenged cynomolgus macaque kidney, liver, and lung harvested at 8 dpi. (A) H&E stain (200 x) of kidney section from animal DL606 showing severe regional area of glomerular vascular thrombosis with renal parenchymal infarction/necrosis (asterisks), vascular wall necrosis, and fibrin deposition. (B) Hematoxylin/Gram stain (400x) of sequential kidney section from animal DL606 showing abundant neutrophilic inflammatory cells (arrowhead), and gram-positive cocci (arrows). (C) H&E stain (200x) of liver section from animal DN362 showing moderate neutrophilic or mixed cell inflammation with a primarily periportal distribution (asterisk), reactive hypertrophy and hyperplasia of sinusoidal Kupffer cells/macrophages, and expansion of the hepatic sinusoids with reactive appearing cells of histiocytic or endothelial origin (arrowheads). (D) H&E stain (400 x) of liver section from animal DN361 showing increased intravascular neutrophils and monocytic infiltrates with mild scattered single cell hepatocellular necrosis (arrow). (E–F) H& E stain of lung section from animal DN361 at 200x (E) and animal DL606 at 400x (F) showing minimal multifocal and regionally extensive areas of alveolar hemorrhage with alveolar septal necrosis (arrowheads) and numerous intravascular fibrin microthrombi (arrows). A mixed cell inflammation, consisting primarily of neutrophils and monocytes, expanded the alveolar septae; increased intravascular inflammatory cell infiltrate (asterisk) was observed.
“Graphical data showing six panels (A-F) with various biochemical parameters over time. A: AST levels, peaking around 12 hours. B: ALT levels, peaking at 8 hours. C: TBIL levels, fluctuating between 0.2 and 1.0 mg/dL. D: ALB/GLOB ratio decreases over time. E: BUN/CRE ratio shows slight variability. F: CK levels, peaking around 12 hours. Each panel includes multiple colored lines representing different samples or conditions. Time points range from pre-experiment to eight days post-experiment. Gray areas indicate reference ranges.”
FIGURE 9
Clinical chemistry markers of liver, kidney, and other organ function are disrupted throughout MRSA infection of cynomolgus macaques. Analyte concentrations and ratios were determined by serum biochemistry panel on IDEXX platform. (A) Concentration of aspartate transferase (AST) in units per liter. (B) Concentration of alanine transaminase (ALT) in units per liter. (C) Concentration of total bilirubin (TBIL) in mg/dL. (D) Ratio of albumin to globulin (A/G) concentrations. (E) Ratio of blood urea nitrogen (BUN) to creatinine (CRE) concentrations. (F) Concentration of creatine kinase (CK) in units per liter (A–F) Statistical comparisons were performed using repeated-measures, mixed-effect analyses with Dunnett’s post hoc multiple comparisons test; *P < 0.05, **P < 0.01, ***P < 0.001, ****P < 0.0001. Asterisks indicate p-values of multiple comparisons against the baseline “Pre” timepoint and are shown below the x axis for clarity. Gray areas indicate values outside the normal clinical ranges for cynomolgus macaques.

References

    1. Angus D., van der Poll T. (2013). Severe sepsis and septic shock. N. Engl. J. Med. 369 840–851. 10.1056/NEJMra1208623 - DOI - PubMed
    1. Baddour L., Wilson W., Bayer A., Fowler V., Tleyjeh I., Rybak M., et al. (2015). Infective endocarditis in adults: diagnosis, antimicrobial therapy, and management of complications: A scientific statement for healthcare professionals from the American Heart Association. Circulation 132 1435–1486. 10.1161/CIR.0000000000000296 - DOI - PubMed
    1. Bain P., Latimer K. (2011). “Chapter 7. Liver,” in Duncan and Prasse’s Veterinary Laboratory Medicine: Clinical Pathology, 5th Edn, eds Kenneth S., Latimer (Chichester: Wiley-Blackwell; ), 213–214.
    1. Bandaru S., Killeen R., Gupta V. (2025). Poikilocytosis. Treasure Island, FL: StatPearls Publishing. - PubMed
    1. Bergersen K., Zheng Y., Rossetti M., Ruffin F., Pickering H., Parmar R., et al. (2025). Early cytokine signatures and clinical phenotypes discriminate persistent from resolving MRSA bacteremia. BMC Infect. Dis. 25:231. 10.1186/s12879-025-10620-3 - DOI - PMC - PubMed

LinkOut - more resources